Tinder has more than 50 million MAUs worldwide and is expected to surpass 100 million MAUs by 2030.
Americans prefer using Tinder as their preferred dating app, with around 18% of the country’s dating users using it. This resulted in it having around 25% market share in the dating industry.
This blog will help you understand how big Tinder is in the casual dating space globally by providing detailed insights about its monthly and daily active user count, paid user count, demographics, and usage patterns. This data can allow brands to target their audience better and improve their marketing strategies in the future.
Before starting lets take a look at the number of tinder users growth:
Key Tinder Statistics 2026: At A Glance
- Tinder is the largest dating app worldwide, with over 50 million MAU in 2026.
- Today, Tinder has over 9.8 million paid subscribers.
- The platform has around 75% female and 25% male users.
- Over 60% of the Tinder users are aged between 18 to 30 years.
- Tinder supports up to 9 sexual orientations and over 50+ gender identities globally.
- As of today, Tinder has successfully made 100+ billion matches in total.
- Tinder users spend about 90 minutes a day on the app, logging in around 11 times daily.
- As of 2026, Tinder users perform an average of 1.6 billion swipes daily and around 48 billion swipes monthly.
How Many Tinder Users Are There Globally?
Tinder has over 50 million monthly active users (MAU) in around 190 countries as of 2026. It is projected that its MAU count will cross 100 million by 2030.
The app has around 26.25 million daily active users (DAU). This makes it one of the most popular online dating apps globally.
Source: World Population Review
Number of Paid Subscribers of Tinder
Today, Tinder has around 9.8 million paid subscribers worldwide. Projections suggest that its paid subscriber base will increase to about 10 million by the end of 2026 and reach around 10.5 million by the end of 2027.
Tinder has three subscription tiers – Tinder+, Tinder Gold, and Tinder Platinum. Here are the price tags for these subscription plans:
| Tenure | Tinder+ | Tinder Gold | Tinder Platinum |
|---|---|---|---|
| 1 month | $24.99 | $39.99 | $49.99 |
| 6 months | $16.66/month | $23.33/month | $29.99/month |
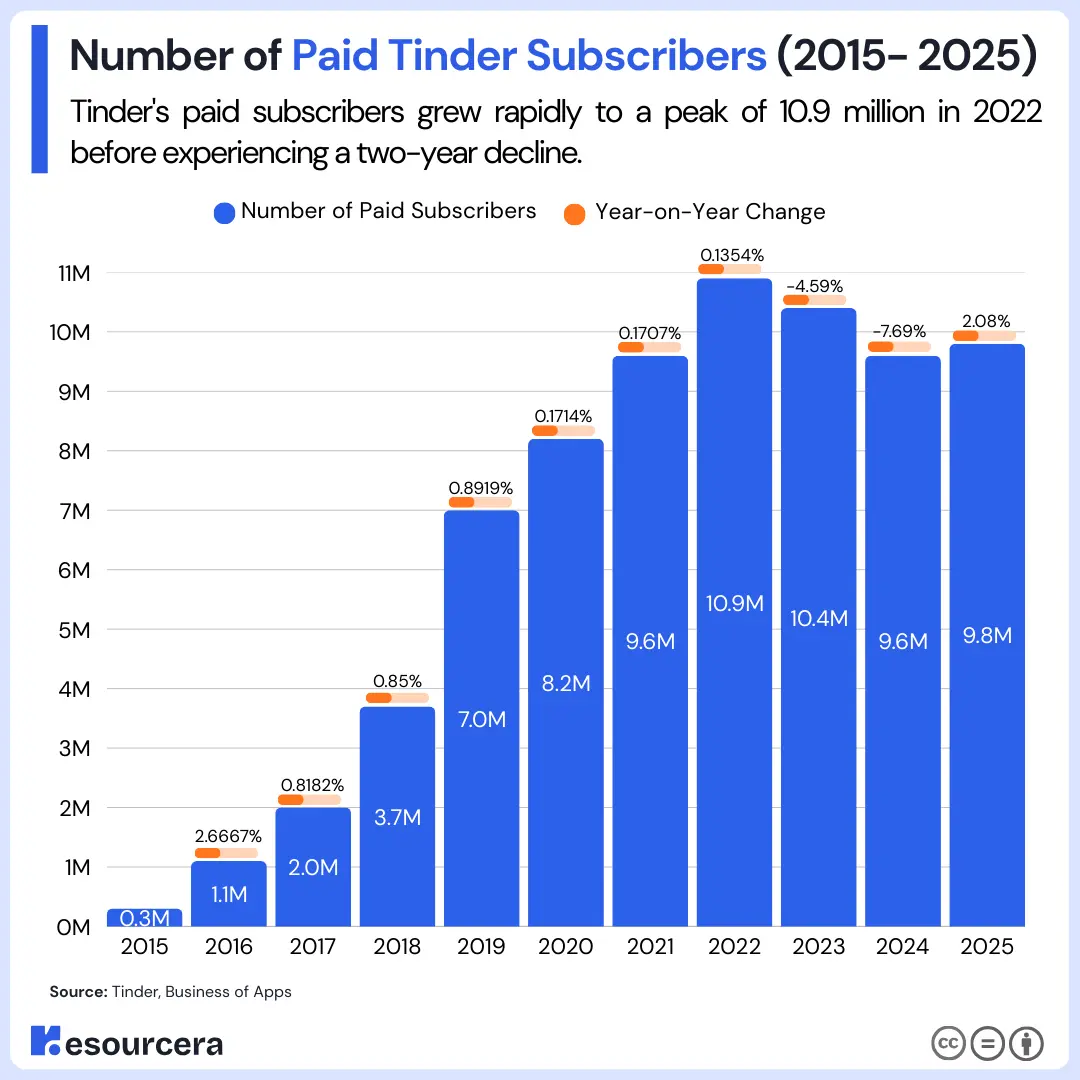
From 2015 to 2025, the subscriber base grew from 0.3 million to 9.8 million. This indicates strong long-term growth despite recent years of decline.
The table below shows the number of Tinder paid subscribers over the years:
| Year | Number of Paid Subscribers | Year-on-Year Change |
|---|---|---|
| 2015 | 0.3 million | – |
| 2016 | 1.1 million | 2.6667 |
| 2017 | 2 million | 0.8182 |
| 2018 | 3.7 million | 0.85 |
| 2019 | 7 million | 0.8919 |
| 2020 | 8.2 million | 0.1714 |
| 2021 | 9.6 million | 0.1707 |
| 2022 | 10.9 million | 0.1354 |
| 2023 | 10.4 million | -4.59% |
| 2024 | 9.6 million | -7.69% |
| 2025 | 9.8 million | 2.08% |
Sources: Tinder, Business Of Apps
Tinder Users By Country
As of 2025, Tinder has over 7.8 million users in the United States, making it the country with the highest number of users.
Brazil, France and Germany rank third, fourth, and fifth in the list of countries with the most Tinder users.
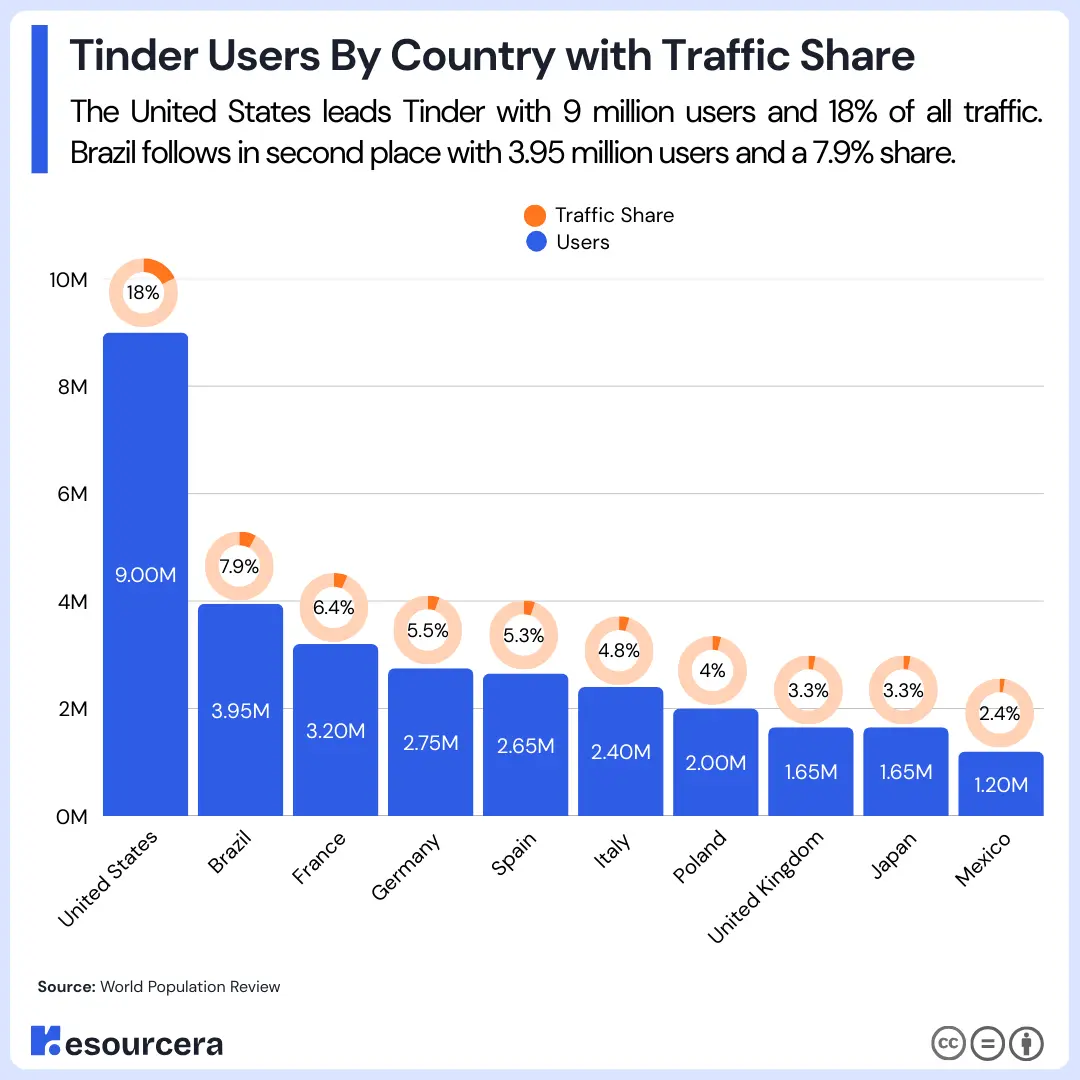
Here are the top countries with the highest number of Tinder users by rank:
| Ranking | Location | Traffic Share | Users |
|---|---|---|---|
| 1 | United States | 18.00% | 9 million |
| 2 | Brazil | 7.90% | 3.95 million |
| 3 | France | 6.40% | 3.20 million |
| 4 | Germany | 5.50% | 2.75 million |
| 5 | Spain | 5.30% | 2.65 million |
| 6 | Italy | 4.80% | 2.40 million |
| 7 | Poland | 4.00% | 2 million |
| 8 | United Kingdom | 3.30% | 1.65 million |
| 9 | Japan | 3.30% | 1.65 million |
| 10 | Mexico | 2.40% | 1.20 million |
Source: World Population Review,
Tinder Users By Gender
Around 75% of Tinder users are males, whereas the rest 24% are females. This gender distribution reflects a notable imbalance, resulting in female users receiving a 10% match rate while males have a 0.6% match rate.
In countries like India, this gender disparity is much higher, resulting in higher male user counts. However, in Europe, the situation is around a 50:50 ratio.
Meanwhile, the 1% belongs to other genders besides male and female. Tinder provides inclusive gender selection beyond binary options, supporting up to 9 sexual orientations and expanded gender identities.
Additional categories include Non-binary, Transgender man/woman, Gender fluid, and more, promoting diverse self-identification.
Source: Business Of Apps
Tinder Users By Age Group
53% of Tinder users are under the age of 34, with the 25–34 age group representing about 32% of the total user population.
Users aged between 18 to 24 years account for around 21.48% of Tinder’s user base.
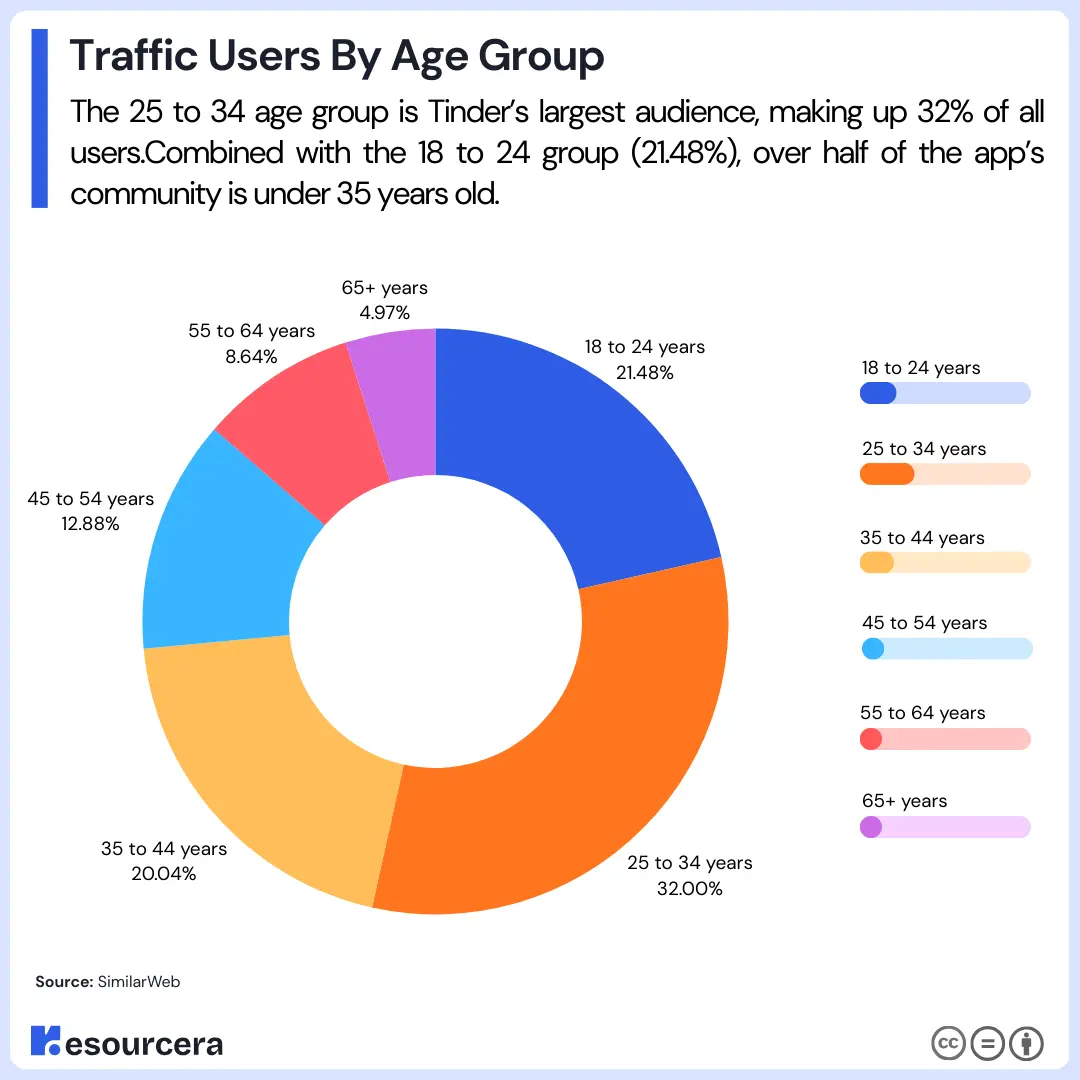
The table below shows a detailed distribution of the Tinder user base by age groups:
| Age Groups | Share of Tinder Users |
|---|---|
| 18 to 24 years | 21.48% |
| 25 to 34 years | 32% |
| 35 to 44 years | 20.04% |
| 45 to 54 years | 12.88% |
| 55 to 64 years | 8.64% |
| 65+ years | 4.97% |
Source: SimilarWeb
Tinder Users By Income Levels
Around 30% of Tinder users have an annual income between $60K and $80K, making this the most common income bracket among the platform’s users.
An additional 22% report earning between $80K and $100K per year. This shows that over half of the app’s users are from middle to higher income levels.
In addition to its popularity among middle- and high-income users, around 30% of Tinder’s user base falls in the $30K to $60K income range.
Here is the table showing the detailed distribution of Tinder users by different income levels:
| Annual Income Range | Share of Tinder Users |
|---|---|
| Below $30K | 10% |
| $30K to $60K | 20% |
| $60K to $80K | 30% |
| $80K to $100K | 22% |
| Over $100K | 18% |
Source: Business Of Apps
Tinder Users by Education
According to various reports and surveys, around 19% of Tinder users hold a post-graduate degree.
Whereas, around 28% of its users are bachelor’s degree holders, and another 53% of the app’s user base have an education up to high school level but not with a college-level degree.
The table below showcases the distribution of Tinder users by their educational levels:
| Education Level | Share of Tinder Users |
|---|---|
| High School Level | 53% |
| Bachelor’s Degree | 28% |
| Post-Graduate Degree | 19% |
Source: Enterprise Apps Today
Tinder Users by Device Type
Around 98% of Tinder users access its services via mobile devices, like smartphones, while only 2% use desktops.
This means around 49 million users access Tinder on smartphones and tablets, while 1 million use it on desktops.
The table below shows the distribution of Tinder users by device types:
| Device Type | Share of Tinder Users |
|---|---|
| Smartphones or Mobile Devices | 98.20% |
| Computer or PCs | 1.80% |
Source: SimilarWeb
Tinder Market Share in the United States
In the U.S. online dating market, Tinder holds the largest share at around 25%. Bumble follows closely with around 24%, while Hinge ranks third with an estimated 18% market share.
Plenty Of Fish, Grindr, and Hily rank fourth, fifth, and sixth in the list, with around 7% market share in the United States.
The table below showcases the market share of online dating apps in the United States:
| Dating App | Market Share in the United States |
|---|---|
| Tinder | 25% |
| Bumble | 24% |
| Hinge | 18% |
| Plenty Of Fish | 7% |
| Grindr | 7% |
| Hily | 7% |
| Badoo | 4% |
| Others | 8% |
Key Tinder Usage Statistics
- Tinder users have witnessed over 100 billion matches since launch.
- Tinder is available in over 190 countries with 45+ languages.
- Surveys suggested that Tinder’s women users swipe right on almost 14% of profiles, whereas men users swipe right on around 46% of total profiles.
- Over 52 million GIF’s on Tinder are used per week by users.
- Tinder user activity increases between 6:00 PM and 10:00 PM, with peak usage occurring around 9:00 PM. The highest levels of activity are observed on Thursdays and Sundays.
- 8 out of 10 Tinder users look for a serious relationship. On the other hand, 4 out of 10 users are already in a relationship, of which 30% are married and 12% are in a relationship.
- Tinder has over 50+ gender indentities globally.
- As of 2026, there hve been 6.8 billion LGBTQA+ matches made on Tinder.
- Users on Tinder can select from up to 9 different sexual orientations.
Sources: Tinder, Enterprise Apps Today, Business of Apps
Tinder Usage Behavior Statistics
Men and women use Tinder very differently. Be it the average time spent on the app or message response time, men are ahead of women. Here are some interesting user behavior statistics of Tinder that might intrigue you:
What is the average time spent on Tinder?
Users log in to Tinder on an average of 11 times per day and spend an average of 1 hour and 30 minutes, or 90 minutes, daily using it. Each session on the app is about 7 to 9 minutes. Reports suggested that men log in more frequently while women spend more time per session on Tinder.
Tinder Match Rate Statistics by Gender
According to various surveys, men get one match on Tinder after swiping 100 profiles, while women can get one match for every 10 swipes.
For the match-to-likes ratio, on average, men receive 1 match for every 40 likes on Tinder, while women receive 1 match for every 2 likes.
Around half of men on Tinder receive less than one match per day, and about 12% of men get less than one match a week.
Average Message Response Time on Tinder (Men vs Women)
On Tinder, 63% of male users send a message within 5 minutes of matching, while only 18% of female users do the same.
Over 75% of Gen Z users on the app reply to their messages within half an hour or less.
Impact of Bio, Prompts, and Anthem on Tinder Matches
Various reports have revealed that a Tinder user with a well-structured bio and prompts can receive four times more matches than a typical user.
76% of young singles (18-25) surveyed across the US, UK, Canada, and Australia say they would use AI tools in dating, with exactly 28% favoring AI for selecting best photos and another 28% for providing bio prompts.
This suggests bios and prompts help users present clearer, more authentic selves amid trends like Clear-Coding (73% know they like someone when being themselves) and Emotional Vibe Coding, where honest self-expression boosts appeal.
Users have also boosted their match rate by up to 10% on Tinder by adding a song or anthem to their profile.
Sources: Tinder (Match Group), Roast.dating, Datingzest
Tinder User Intentions and Popular Interests & Professions Statistics
Tinder is widely used by individuals searching for meaningful relationships. According to user data, a majority of users are interested in long-term relationships. Among them, Gen Z represents a large demographic group. Here are various intriguing Tinder statistics you must know:
- Over 60% of Tinder users have turned on its Relationship Goals feature, which lets them share their relationship intentions.
- Around 4 out of 10 users seek a long-term relationship on Tinder, while only 13% of the users look for short-term relationships.
- Various surveys among Gen Zs revealed that over 50% of them expressed interest in serious relationships and prefer monogamous relationships. About 48% of them are open to non-traditional or flexible relationships.
- About 73% of Tinder users search for someone who “Knows what they want” in a partner.
Top Interests and Date Activities on Tinder Profiles
A study analyzing over 10,000 Tinder profiles in the U.S. identified the most common user interests: music, food, adventure, the outdoors, travel, movies, and dogs.
Whereas, Yoga, Concerts, Sushi, Vintage Fashion, and Shopping are the most right-swiped interests across the United States.
The study also revealed that Hiking, Picnics, Netflix & chill, Bowling, and Walks are the most popular date activities for Tinder users in the U.S.
Tinder Statistics By Common Bios
Around 74% of women and 68% of men prioritize having a photo as a DP on an online dating app. And, 4 out of 10 women love to know their matches’ hobbies and interests, compared to 32% of men with similar preferences.
The table below shows what Tinder users look for in a user’s profile of the opposite gender:
| What Tinder users look for in the opposite gender’s profile | Men | Women |
|---|---|---|
| Hobbies and Interests | 32% | 40% |
| Religious Beliefs | 18% | 32% |
| Occupation | 8% | 27% |
| Racial or Ethnic Background | 15% | 23% |
| Height | 8% | 22% |
| Political Affiliation | 10% | 18% |
Source: Finance Online
Most Popular Dating Apps in the United States
Tinder and Bumble are the most popular dating apps in the United States, with over 37% and 35% of online dating users using them, respectively.
Badoo and Plenty Of Fish rank third and fourth with over 22% and 21% of dating users using them, respectively.
Hinge is the fifth most popular dating app among Americans, with over 20% of users using it for dating purposes.
Here is the table showing the most popular dating apps in the US:
| Dating App | Sharing of Online Dating Users in the US |
|---|---|
| Tinder | 37% |
| Bumble | 35% |
| Badoo | 22% |
| Plenty Of Fish | 21% |
| Hinge | 20% |
| eharmony | 19% |
| BlackPeopleMeet | 18% |
| Match | 18% |
Source: Statista
Most Popular Dating Apps in the World by Downloads
Tinder is the most downloaded dating app globally, with over 63.58 million annual downloads. This figure includes downloads from Android and iOS. Tinder has been downloaded over 630 million times since its launch.
Bumble ranks second with over 36.23 million downloads, while Badoo ranks third with over 23.04 million downloads globally.
FRND and Omi rank fourth and fifth in the list with more than 19.2 million and 19.01 million downloads, respectively.
Below are the top downloaded dating apps in the world:
| Dating Apps | Number of Downloads Worldwide |
|---|---|
| Tinder | 63.58 million |
| Bumble | 36.23 million |
| Badoo | 23.04 million |
| FRND | 19.20 million |
| Omi | 19.01 million |
| Hinge | 16.43 million |
| Boo | 16.35 million |
| SweetMeet | 13.30 million |
| Soul | 12.09 million |
| TanTan | 11.60 million |
| PopUp | 11.54 million |
| Grindr | 11.40 million |
| Kismia | 11.27 million |
| happn | 10.53 million |
| Timo | 9.36 million |
Source: Statista
