
TAM SAM SOM Calculator
Estimate your market sizes using simple business inputs.
Revenue Projections
Explore the complete list of market research tools and calculators.
What Is a TAM SAM SOM Calculator?
A TAM SAM SOM Calculator is a market sizing tool that helps you estimate how large a business opportunity is at three different levels.
It starts with the full market size, then narrows it down to the part your business can serve, and finally shows the part your business may realistically capture.
| Term | Full Form | What It Means |
|---|---|---|
| TAM | Total Addressable Market | The total revenue opportunity in the full market |
| SAM | Serviceable Available Market | The part of the market your business can realistically serve |
| SOM | Serviceable Obtainable Market | The part of the serviceable market your business can realistically win |
A business may operate in a very large market, but that does not mean it can serve or capture the entire market.
For example, a SaaS company may target a global software market, but it may only serve small businesses in the United States. In that case, the global market is the TAM, the US small business segment is the SAM, and the share the company can win is the SOM.
This calculator helps you keep those three numbers separate.
How to Use the TAM SAM SOM Calculator
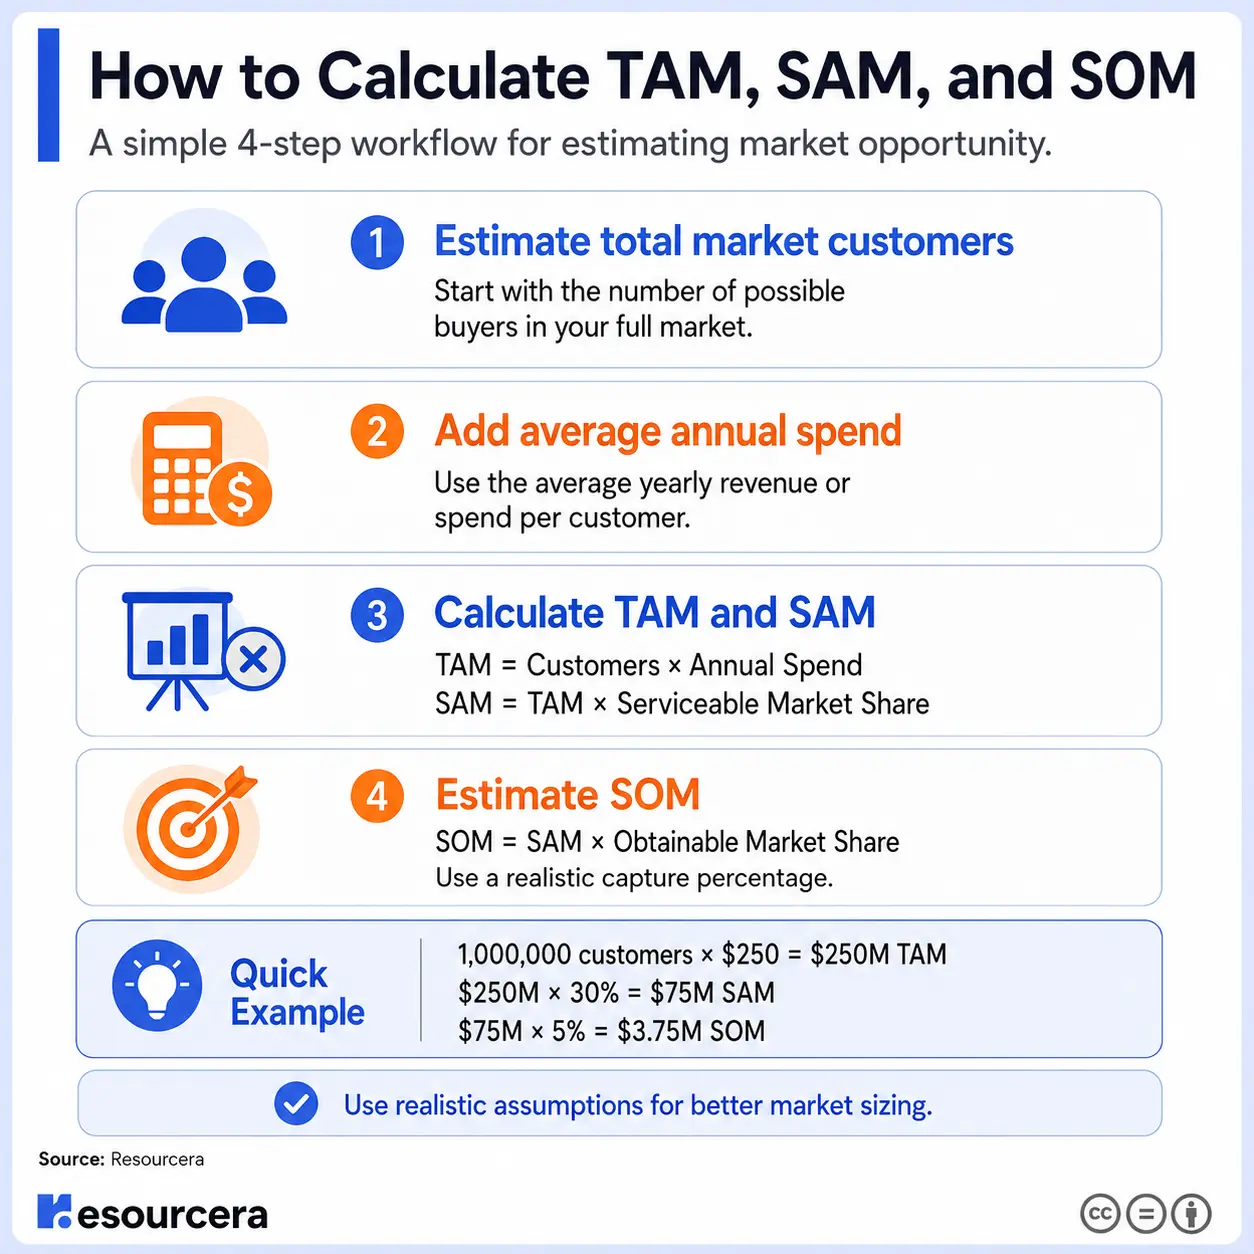
Follow these steps to calculate your market opportunity.
1. Select Your Currency
Choose the currency you want to use for the calculation.
You can select:
- USD
- INR
- EUR
- GBP
Use the currency that matches your target market, business plan, or investor presentation.
2. Enter Total Market Customers
Enter the total number of possible customers in your market.
This can be:
| Business Type | Customer Unit |
|---|---|
| SaaS | Businesses, users, or accounts |
| E-commerce | Online buyers or households |
| Mobile app | Potential users |
| B2B services | Target companies |
| Education | Students, schools, or institutions |
| Healthcare | Patients, clinics, or providers |
| Fintech | Users, merchants, or businesses |
For example, if you sell software to small businesses, your total market customers should be the number of small businesses that could use your product.
3. Enter Average Annual Spend per Customer
Enter how much one customer spends per year on your product or category.
This may come from:
- Subscription pricing
- Average order value
- Annual contract value
- Customer spending data
- Competitor pricing
- Market research reports
- Internal sales data
If your product has monthly pricing, convert it into annual spend.
Example:
$40 per month × 12 months = $480 annual spend
Use the annual value in the calculator.
4. Enter Serviceable Market Share
Enter the percentage of the total market your business can realistically serve.
This is used to calculate SAM.
Your serviceable market share depends on:
- Geography
- Customer segment
- Product availability
- Pricing
- Distribution
- Language support
- Business model
- Industry focus
For example, if your product can serve only 25% of the total market, enter 25%.
5. Enter Obtainable Market Share
Enter the percentage of your SAM that you can realistically capture.
This is used to calculate SOM.
Your obtainable market share depends on:
- Competition
- Marketing reach
- Sales capacity
- Brand strength
- Product differentiation
- Customer acquisition budget
- Existing customer base
- Market entry timing
For early-stage businesses, SOM should usually be conservative.
6. Click Calculate
The calculator will show:
- TAM
- SAM
- SOM
Use the result to understand the difference between total opportunity, reachable opportunity, and realistic opportunity.
Inputs Used in the Calculator
| Input | What It Means | Example |
|---|---|---|
| Currency | Currency used in the final result | USD |
| Total Market Customers | Total possible buyers in the market | 1,000,000 |
| Average Annual Spend | Yearly revenue per customer | $250 |
| Serviceable Market Share | Share of TAM your business can serve | 30% |
| Obtainable Market Share | Share of SAM your business can capture | 5% |
The final result depends on the quality of these inputs. If the input assumptions are weak, the output will also be weak.
Why TAM, SAM, and SOM Are Important
TAM, SAM, and SOM help you understand the difference between a large market and a realistic business opportunity.
A large market size may look attractive, but investors, founders, and business teams usually want to know three things:
| Question | Market Metric |
|---|---|
| How large is the full opportunity? | TAM |
| What part of that opportunity can we serve? | SAM |
| What part can we realistically win? | SOM |
This is important because TAM alone can be misleading.
A company may say, “We are entering a $50 billion market.” But if the company can only serve a small customer segment and capture a small share, the realistic opportunity may be much smaller.
That is why SAM and SOM matter. They make the market sizing more realistic.
What Is TAM?
TAM stands for Total Addressable Market.
It shows the total revenue opportunity if your product or service could serve every possible customer in the market.
TAM answers this question:
How big is the full market opportunity?
TAM Formula
TAM = Total Market Customers × Average Annual Spend per Customer
TAM Example
Suppose you are launching a project management software product.
| Input | Value |
|---|---|
| Total potential customers | 1,000,000 |
| Average annual spend per customer | $250 |
TAM = 1,000,000 × $250
TAM = $250 million
This means the total addressable market is $250 million per year.
TAM is useful because it shows whether the overall market is large enough. However, TAM does not mean your business can capture the full market.
It only shows the full revenue opportunity if every possible customer bought from you.
What Is SAM?
SAM stands for Serviceable Available Market.
It shows the part of the total market your business can realistically serve based on your current product, location, pricing, customer segment, and business model.
SAM answers this question:
What part of the total market can our business actually serve?
SAM Formula
SAM = TAM × Serviceable Market Share
SAM Example
If your TAM is $250 million and your business can serve 30% of the market:
SAM = $250 million × 30%
SAM = $75 million
This means the serviceable available market is $75 million.
SAM is smaller than TAM because most businesses have limits.
These limits may include:
- Geography
- Language
- Product features
- Pricing model
- Target customer type
- Distribution channels
- Sales capacity
- Legal or regulatory requirements
For example, if your product is available only in India, you should not treat the full global market as your SAM. Your SAM should focus on the part of the market you can actually serve.
What Is SOM?
SOM stands for Serviceable Obtainable Market.
It shows the part of the serviceable market your business can realistically capture.
SOM answers this question:
How much of the reachable market can we realistically win?
SOM Formula
SOM = SAM × Obtainable Market Share
SOM Example
If your SAM is $75 million and your business expects to capture 5% of it:
SOM = $75 million × 5%
SOM = $3.75 million
This means the realistic obtainable market is $3.75 million.
SOM is usually the most practical number because it is closer to realistic revenue potential.
It considers real business limits such as:
- Competition
- Brand awareness
- Marketing budget
- Sales team size
- Product quality
- Customer trust
- Pricing strength
- Market maturity
- Customer acquisition cost
A strong SOM estimate should be realistic, not inflated.
TAM vs SAM vs SOM
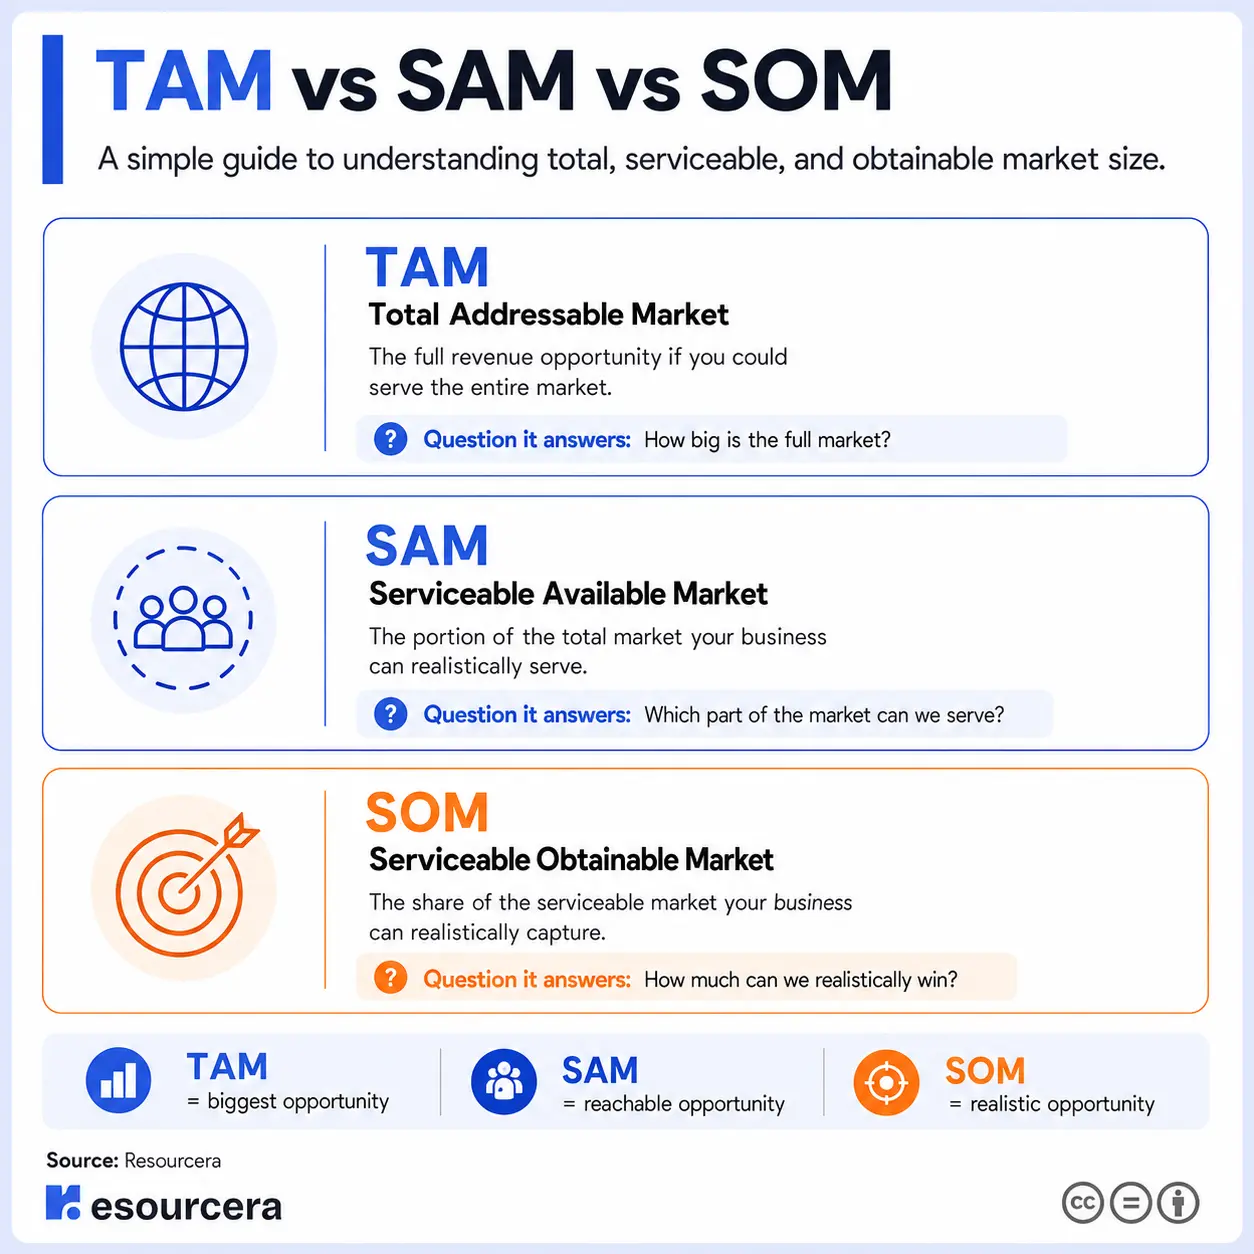
| Metric | Meaning | Scope | Practical Use |
|---|---|---|---|
| TAM | Total Addressable Market | Full market | Shows total opportunity |
| SAM | Serviceable Available Market | Reachable market | Shows target market size |
| SOM | Serviceable Obtainable Market | Realistic capture | Shows practical revenue potential |
TAM is the largest number. SAM is smaller than TAM. SOM is smaller than SAM.
The correct order is:
TAM > SAM > SOM
If your SAM is larger than TAM, or your SOM is larger than SAM, the calculation is incorrect.
How the TAM SAM SOM Calculator Works
This calculator uses a simple bottom-up market sizing method.
Instead of starting with a broad industry value, it uses customer count and average annual spend to estimate the market.
The calculator uses these formulas:
| Metric | Formula |
|---|---|
| TAM | Total Market Customers × Average Annual Spend |
| SAM | TAM × Serviceable Market Share |
| SOM | SAM × Obtainable Market Share |
For example:
| Input | Value |
|---|---|
| Total Market Customers | 1,000,000 |
| Average Annual Spend | $250 |
| Serviceable Market Share | 30% |
| Obtainable Market Share | 5% |
The result would be:
| Metric | Calculation | Result |
|---|---|---|
| TAM | 1,000,000 × $250 | $250 million |
| SAM | $250 million × 30% | $75 million |
| SOM | $75 million × 5% | $3.75 million |
This means the full market opportunity is $250 million, but the realistic obtainable opportunity is $3.75 million.
Detailed TAM SAM SOM Example
Let’s say a company is launching a B2B SaaS product for small businesses.
The company estimates that:
- There are 1,000,000 potential small business customers.
- Each customer may spend $250 per year.
- The company can serve 30% of the market based on its product and sales reach.
- The company expects to capture 5% of that serviceable market.
Step 1: Calculate TAM
TAM = Total Market Customers × Average Annual Spend
TAM = 1,000,000 × $250
TAM = $250 million
The total addressable market is $250 million.
Step 2: Calculate SAM
SAM = TAM × Serviceable Market Share
SAM = $250 million × 30%
SAM = $75 million
The serviceable available market is $75 million.
Step 3: Calculate SOM
SOM = SAM × Obtainable Market Share
SOM = $75 million × 5%
SOM = $3.75 million
The serviceable obtainable market is $3.75 million.
Final Result
| Market Metric | Value |
|---|---|
| TAM | $250 million |
| SAM | $75 million |
| SOM | $3.75 million |
This shows that although the full market is worth $250 million, the realistic near-term opportunity is closer to $3.75 million.
TAM SAM SOM Example by Business Type
Different businesses can use TAM, SAM, and SOM in different ways.
SaaS Business Example
| Input | Example |
|---|---|
| Total market customers | Number of target companies |
| Average annual spend | Annual subscription revenue |
| Serviceable market share | Segment your product can serve |
| Obtainable market share | Share you expect to win |
A SaaS company can use TAM SAM SOM to estimate subscription revenue potential.
E-commerce Business Example
| Input | Example |
|---|---|
| Total market customers | Number of online shoppers |
| Average annual spend | Average yearly purchase value |
| Serviceable market share | Reachable customer segment |
| Obtainable market share | Expected customer capture |
An e-commerce brand can use this calculator to estimate demand for a product category.
B2B Service Business Example
| Input | Example |
|---|---|
| Total market customers | Number of target companies |
| Average annual spend | Average yearly service contract |
| Serviceable market share | Companies your team can serve |
| Obtainable market share | Clients you can realistically win |
A B2B service provider can use TAM SAM SOM to estimate revenue potential from a target industry.
Mobile App Example
| Input | Example |
|---|---|
| Total market customers | Potential app users |
| Average annual spend | Subscription or in-app revenue per user |
| Serviceable market share | Reachable users by geography or language |
| Obtainable market share | Users you can acquire |
A mobile app business can use this calculator to estimate user monetization potential.
Bottom-Up vs Top-Down Market Sizing
There are two common ways to estimate market size.
Bottom-Up Market Sizing
Bottom-up market sizing starts with customer-level assumptions.
Example:
Number of potential customers × Average annual spend
This calculator uses a bottom-up method because it is simple and practical.
It is useful when you know or can estimate:
- Customer count
- Pricing
- Annual spend
- Target segment
- Expected market share
Bottom-up market sizing is often more credible for startups because it is based on business-level assumptions.
Top-Down Market Sizing
Top-down market sizing starts with a large market number and narrows it down.
Example:
Global market size → Country market → Target segment → Realistic capture
This method is useful when reliable industry data is available.
However, top-down estimates can become too broad if they are not narrowed properly.
Which Method Should You Use?
| Method | Best For |
|---|---|
| Bottom-up | Startup planning, pricing-based estimates, pitch decks |
| Top-down | Industry analysis, market reports, large market studies |
For best results, use both methods and compare the outcome.
How to Estimate Total Market Customers
Total market customers are the full number of possible buyers for your product or service.
This input is important because it directly affects TAM.
You can estimate total market customers using:
- Industry reports
- Government datasets
- Trade associations
- Company databases
- Public market studies
- Customer surveys
- Search demand
- CRM data
- Competitor customer estimates
Example Customer Units
| Market | Customer Unit |
|---|---|
| B2B software | Companies |
| Consumer app | Individual users |
| E-commerce | Buyers or households |
| Education platform | Students or schools |
| Healthcare product | Patients or providers |
| Financial service | Consumers or businesses |
Choose one customer unit and stay consistent.
Do not mix companies, users, and households in the same calculation unless you clearly separate them.
How to Estimate Average Annual Spend
Average annual spend means how much one customer spends per year.
This can also be called:
- Annual revenue per customer
- Annual contract value
- Average revenue per user
- Average order value per year
- Yearly customer spend
Example Annual Spend Calculations
| Pricing Type | How to Calculate Annual Spend |
|---|---|
| Monthly subscription | Monthly price × 12 |
| One-time product | Average order value × purchase frequency |
| B2B service | Average yearly contract value |
| Marketplace | Average yearly transaction value |
| App subscription | Monthly subscription × 12 |
Example:
If a customer pays $30 per month, annual spend is:
$30 × 12 = $360
If a customer buys a $50 product four times per year, annual spend is:
$50 × 4 = $200
Use the number that best reflects yearly customer value.
How to Estimate Serviceable Market Share
Serviceable market share is the part of the total market your business can realistically serve.
This input helps calculate SAM.
You should reduce TAM into SAM based on practical limits.
Factors That Affect SAM
| Factor | How It Affects SAM |
|---|---|
| Geography | You may only serve selected countries or cities |
| Language | Your product may support only certain languages |
| Pricing | Not every customer can afford your product |
| Product fit | Your product may serve only one segment |
| Sales channel | Your reach may depend on online, retail, or direct sales |
| Regulation | Some markets may require compliance or licenses |
| Distribution | You may not have access to all customers |
Example:
If the full market has 1,000,000 customers but your business can realistically serve only 300,000 of them, your serviceable market share is:
300,000 ÷ 1,000,000 = 30%
So you would enter 30% in the calculator.
How to Estimate Obtainable Market Share
Obtainable market share is the part of SAM your business can realistically capture.
This input helps calculate SOM.
SOM should be realistic because it is often used for revenue planning.
Factors That Affect SOM
| Factor | How It Affects SOM |
|---|---|
| Competition | Strong competitors reduce capture potential |
| Brand awareness | New brands usually capture less market |
| Marketing budget | Larger budgets can improve customer acquisition |
| Sales capacity | Smaller teams may capture less market |
| Product quality | Better products may improve conversion |
| Pricing | High or low pricing can affect adoption |
| Customer trust | Buyers may prefer known companies |
| Timing | Entering early or late changes opportunity |
For early-stage companies, obtainable market share is often much smaller than serviceable market share.
A realistic SOM is better than an inflated SOM.
How to Interpret Your TAM SAM SOM Results
After calculating TAM, SAM, and SOM, compare the three numbers.
If TAM Is Large but SAM Is Small
This means the full market is large, but your current business can serve only a small part of it.
This may happen if:
- You operate in one country
- Your product serves one segment
- Your pricing fits only a small group
- Your sales channels are limited
In this case, growth may require expansion into new regions, customer segments, or distribution channels.
If SAM Is Large but SOM Is Small
This means the reachable market is large, but your realistic capture is limited.
This may happen because of:
- Strong competition
- Low brand awareness
- Limited sales resources
- Small marketing budget
- Long sales cycles
In this case, you may need stronger positioning, better distribution, or more sales capacity.
If SOM Looks Too High
Your estimate may be too optimistic.
Review:
- Competitor strength
- Customer acquisition cost
- Sales team capacity
- Conversion rate
- Market share assumptions
- Time period
A high SOM can make the business plan look less credible.
If TAM Looks Too Small
The market may not support your growth goals.
You may need to:
- Increase pricing
- Target a larger segment
- Expand geography
- Add new customer types
- Enter adjacent markets
How TAM SAM SOM Helps in a Pitch Deck
TAM SAM SOM is commonly used in startup pitch decks because it gives investors a clear view of market opportunity.
A good pitch deck should not only show a big market. It should show a market that is large, reachable, and realistic.
What Investors Look For
| Investor Question | Related Metric |
|---|---|
| Is the market large enough? | TAM |
| Can this company serve the market? | SAM |
| Can this company realistically win market share? | SOM |
| Are the assumptions believable? | All three |
| Can this business scale? | TAM and SAM |
| Is the revenue target realistic? | SOM |
A large TAM may catch attention, but a well-supported SAM and SOM make the market sizing more credible.
TAM SAM SOM for Market Research Reports
TAM SAM SOM can also be used in market research reports to explain opportunity size.
A market research report may use TAM SAM SOM to show:
- Full industry opportunity
- Addressable customer segments
- Regional opportunity
- Revenue potential
- Product category opportunity
- Competitive opportunity
- Future expansion potential
For example, a report on AI tools may estimate the full market size, then narrow it down by business users, paid users, geography, and expected adoption.
This makes the analysis more useful for decision-makers.
TAM SAM SOM for Business Planning
Businesses can use TAM SAM SOM before launching a product or entering a new market.
It helps answer practical planning questions such as:
- Is this market large enough?
- Which customer segment should we target?
- How much revenue can we realistically expect?
- Is the opportunity worth the investment?
- Which region or segment has better potential?
- How much market share do we need to reach our revenue goal?
This makes TAM SAM SOM useful for founders, analysts, consultants, and strategy teams.
TAM SAM SOM Template
You can use this simple structure when documenting your market sizing assumptions.
| Section | What to Add |
|---|---|
| Target market | Define the product, customer, and geography |
| Total customers | Add the estimated number of possible customers |
| Average annual spend | Add estimated yearly spend per customer |
| TAM calculation | Customers × annual spend |
| Serviceable segment | Explain what part of TAM you can serve |
| SAM calculation | TAM × serviceable market share |
| Obtainable share | Explain what part of SAM you can capture |
| SOM calculation | SAM × obtainable market share |
| Assumptions | List the data sources and logic used |
This makes your calculation easier to understand and defend.
Common TAM SAM SOM Mistakes
| Mistake | Why It Is a Problem |
|---|---|
| Using a market that is too broad | Makes the opportunity look unrealistic |
| Treating TAM as expected revenue | TAM is opportunity, not actual sales |
| Overestimating SOM | Makes projections less credible |
| Ignoring competition | Competitors reduce obtainable market share |
| Using weak assumptions | Leads to unreliable results |
| Mixing customer types | Can distort the calculation |
| Using monthly spend instead of annual spend | Can understate or overstate market size |
| Ignoring geography | Makes SAM too broad |
| Ignoring pricing differences | Different customer groups spend differently |
| Not explaining assumptions | Makes the result hard to trust |
A strong TAM SAM SOM estimate should be clear, realistic, and based on explainable assumptions.
Best Practices for Accurate TAM SAM SOM Calculation
Use these best practices to improve your market sizing estimate.
Use Real Data Where Possible
Use reliable data from market research reports, government sources, industry associations, company filings, customer surveys, and internal sales data.
Keep Customer Units Consistent
Do not mix users, companies, households, and transactions in the same calculation unless you separate them clearly.
Use Annual Spend
This calculator uses average annual spend. If your pricing is monthly, multiply it by 12.
Be Conservative With SOM
SOM should reflect what your business can realistically capture, not what you hope to capture.
Explain Your Assumptions
Always explain how you estimated customers, spend, serviceable share, and obtainable share.
Update the Calculation Over Time
Your TAM SAM SOM can change as your business expands into new markets, adds features, changes pricing, or improves distribution.
Limitations of TAM SAM SOM
TAM SAM SOM is useful, but it is still an estimate.
It should not be treated as a guaranteed revenue forecast.
The result can change based on:
- Market growth
- Customer demand
- Pricing changes
- New competitors
- Economic conditions
- Product adoption
- Regulations
- Sales performance
- Marketing efficiency
Use TAM SAM SOM as a planning tool, not as a fixed prediction.
For better accuracy, combine this calculator with customer research, competitor analysis, pricing data, and real sales performance.
Who Can Use This Calculator?
This calculator is useful for:
| User | How It Helps |
|---|---|
| Startup founders | Estimate market size for pitch decks |
| Business analysts | Build market sizing models |
| Market researchers | Estimate market opportunity |
| Product managers | Validate product launch potential |
| Consultants | Prepare client market analysis |
| Investors | Review market opportunity |
| Students | Learn market sizing with examples |
| SaaS teams | Estimate subscription revenue opportunity |
| E-commerce brands | Estimate category demand |
| Strategy teams | Compare new market opportunities |
Anyone who needs to estimate market opportunity can use this calculator.
