Once a simple messaging app, WeChat has become a digital ecosystem that now commands the attention of over 1.4 billion active users worldwide as of 2025.
With 33.5% of its users aged 24 or younger, and a nearly even gender split, 52% male, and 48% female, WeChat is widely used by everyone from every age for multiple daily tasks.
In this blog, we’ll explore the latest WeChat user statistics, from country-wise usage to age demographics, gender splits, and payment trends, painting a full picture of its global impact in 2025.
Key WeChat Statistics for 2025
- WeChat has more than 1.4 billion active users in 2025.
- 25% of WeChat users are aged between 25 and 30 years.
- 935 million users use WeChat Pay.
- WeChat generated $16.38 billion in revenue in 2023.
- China has more than 810 million WeChat users, which accounts for 57.86% of the platform’s total user base.
WeChat Users Statisticsn2025
As of 2025, WeChat has more than 1.4 billion active users in the world.
In 2024, WeChat reached 1.371 billion users, reflecting a 3.3% increase compared to 2023.
WeChat had around 1.343 billion users in 2023. Earlier in 2022, WeChat gained momentum again with a 3.5% rise, bringing its user base to 1.313 billion.
The same 3.5% increase was seen in 2021, pushing the total to 1.268 billion active users.
In 2020, during the global pandemic, WeChat saw a 5.2% rise, reaching 1.225 billion users globally.
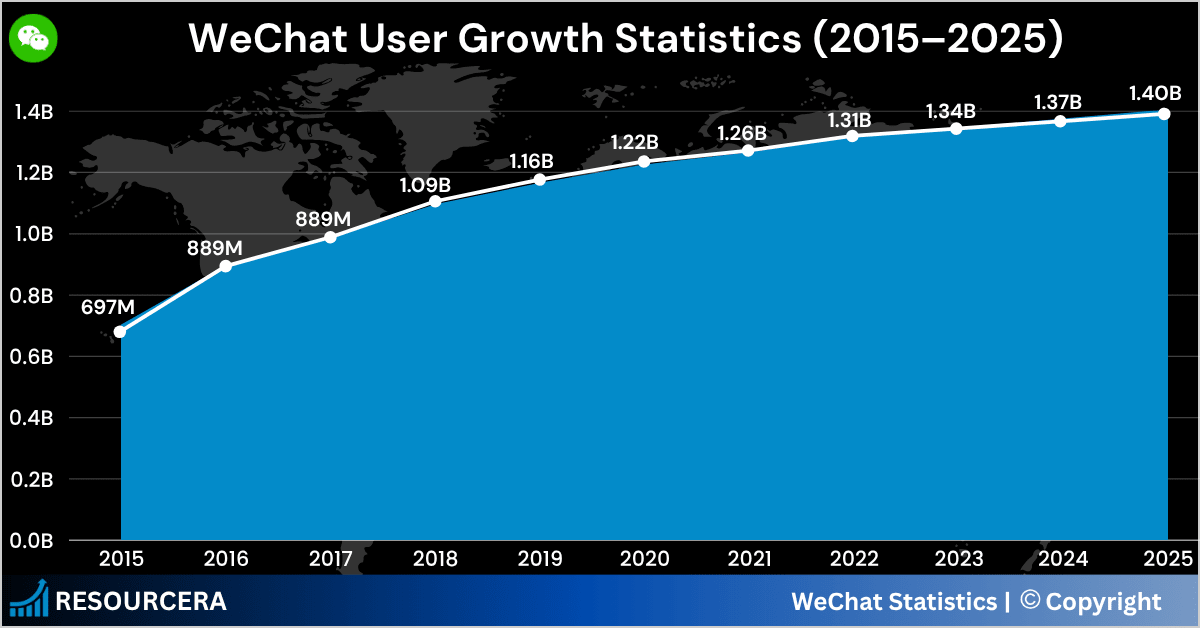
Here is a table showing the growth of WeChat users over the years:
Source: Statista
WeChat Users By Country
With a staggering 810 million WeChat users in 2025, the app is not just popular in China, it’s an essential part of daily life.
Malaysia secures the second spot with 12 million WeChat users, reflecting its strong connection with Chinese-speaking communities and cross-border commerce.
India comes in third with 10 million WeChat users, and Russia follows with 9.5 million active users.
Around 5.5 million people from Japan use WeChat, while the United States has around 4 million active WeChat users.
Here are the top 10 countries with the most WeChat users:
| Country | WeChat users |
|---|---|
| China | 810 million |
| Malaysia | 12 million |
| India | 10 million |
| Russia | 9.5 million |
| Japan | 5.5 million |
| South Korea | 5 million |
| United States | 4 million |
| Indonesia | 3 million |
| Thailand | 2.5 million |
| Mexico | 2.5 million |
| Brazil | 2 million |
| Singapore | 1.5 million |
Source: World Population Review
WeChat Users By Age
33.5% of WeChat users are 24 years old or younger, making this the largest demographic on the platform.
25% of WeChat users fall in the 25 to 30 age range, representing the digitally active, career-oriented young adults who use WeChat in both their personal and professional lives.
Meanwhile, around 19% of users are aged 41 and above.
Source: Statista
WeChat Users By Gender
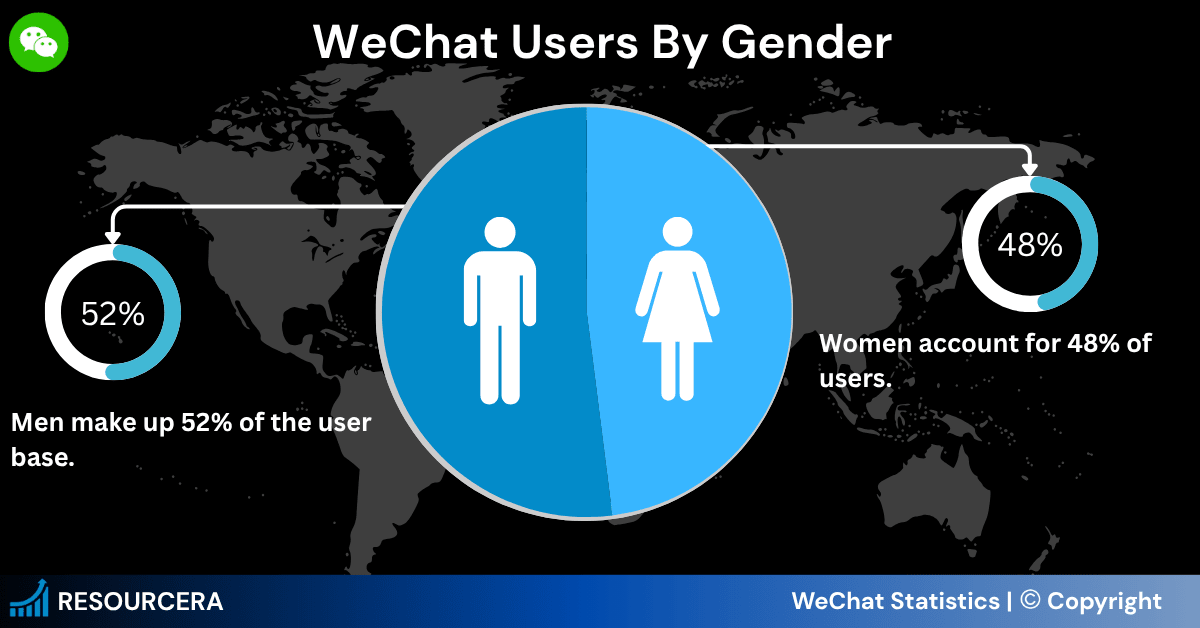
Despite a fairly balanced gender split, men slightly lead the WeChat users, making up 52% of the user base, while women follow closely at 48%.
Source: Statista
WeChat Usage Statistics
WeChat users send over 45 billion messages and make 410 million voice and video calls daily.
On average, WeChat users spend 90 minutes per day on the app.
The WeChat Moments feature attracts 750 million daily users, with 10 billion visits per day.
Sources: Harvard Business Review, ZDnet, EMC Magazine
WeChat Pay Users
By 2023, WeChat Pay had reached 935 million active users, cementing its status as China’s second-largest digital payments platform after AliPay.
In 2022, the platform came closer to the billion-user mark with 920 million users, signaling a near-saturation in China’s digital finance ecosystem.
In 2021, WeChat Pay gained 35 million new users compared to 2020, growing from 865 million to 900 million.
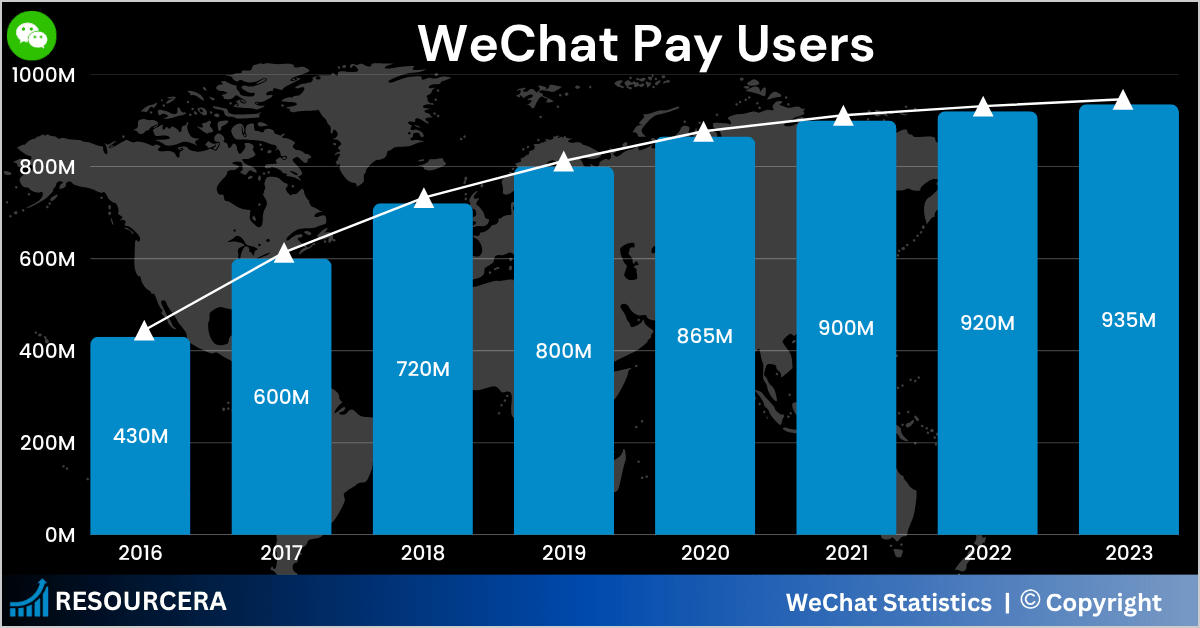
Here is a table with WeChat Pay users over the years:
| Year | WeChat Pay Users |
|---|---|
| 2016 | 430 million |
| 2017 | 600 million |
| 2018 | 720 million |
| 2019 | 800 million |
| 2020 | 865 million |
| 2021 | 900 million |
| 2022 | 920 million |
| 2023 | 935 million |
Source: Tech Crunch
WeChat Mini Programs Users
As of Q1 2024, WeChat Mini Programs had 945 million monthly active users in China. That’s over 90% of all WeChat users! This represented a 2.38% increase from 923 million users in Q4 2023.
In 2023, Mini Programs had 923 million users, a small rise from 921 million in both 2022 and 2021. The biggest jump happened in 2021 when user numbers went up from 832 million in 2020 to 921 million, a 10.7% increase.
Here is a table with WeChat’s Mini Program MAUs over the past few years:
| Year | Mini Program Monthly Active Users |
|---|---|
| Q1 2024 | 945 million |
| 2023 | 923 million |
| 2022 | 921 million |
| 2021 | 921 million |
| 2020 | 832 million |
Source: Statista
WeChat Mini Program Statistics
As of June 2024, daily services dominated the WeChat Mini Programs ecosystem, accounting for 32% of top app traffic, reflecting users’ strong reliance on WeChat for everyday needs like transport, utility payments, and food delivery.
Financial management mini-programs captured 13% of the traffic, highlighting the growing use of WeChat for personal finance, investments, and digital banking.
Tool-based mini-programs, such as note apps, calculators, and file converters, followed with 10%. Meanwhile, mobile shopping held a 9% share of WeChat usage.
Lastly, business-related mini-programs made up 6% of the traffic, indicating modest but steady use of WeChat for enterprise tools, workplace communication, and productivity apps.
Source: Statista
WeChat Pay Vs Alipay
In 2020, Alipay held a slightly dominant position in the Chinese mobile payment market with a 55.39% market share, while WeChat Pay followed closely at 38.47%.
2019 saw similar figures with Alipay at 54.61% and WeChat Pay at 38.99%, indicating a relatively stable rivalry.
Back in 2018, Alipay had a 54.30% hold, barely shifting from 2017’s 54.26%. During those same years, WeChat Pay was gradually climbing, from 38.15% in 2017 to 39.20% in 2018.
In 2016, Alipay’s share dropped sharply to 55.00%, while WeChat Pay surged to 37.00%, a clear sign of growing competition.
Let’s look at WeChat & Alipay’s market share over the years:
| Year | WeChat Pay Market Share | Alipay Market Share |
|---|---|---|
| 2020 | 38.47% | 55.39% |
| 2019 | 38.99% | 54.61% |
| 2018 | 39.20% | 54.30% |
| 2017 | 38.15% | 55.26% |
| 2016 | 37% | 55% |
| 2015 | 20.60% | 68.40% |
| 2014 | 10.60% | 82.30% |
Source: ResearchGate
WeChat Traffic Statistics
In April 2025, WeChat.com received around 4.15 million visits, showing a 13.76% decrease from March, which had 4.81 million visits. This drop continues a downward trend from February, when traffic peaked at 5.36 million visits.
On average, visitors spent 4 minutes and 37 seconds on the site, viewed around 2.37 pages per visit, and the bounce rate stood at 53.68%, meaning just over half the users left after viewing only one page.
About 69.66% of WeChat users use mobile devices to access the platform, while 30.34% use desktops in 2025.
Source: Semrush
WeChat Traffic By Country
Most visits to WeChat.com come from Hong Kong, making up about 11.9% of traffic, with visitors almost evenly split between desktop (45.13%) and mobile (54.87%).
The United States accounts for nearly 10% of visitors, where about 59.72% use mobile and 40.28% use desktop.
China contributes about 5.5% of visits, but almost all of these visitors, nearly 100%, use desktops, with very few on mobile.
Here is the breakdown of WeChat’s traffic by country and device:
| Country | Total Traffic Share | Desktop | Mobile |
|---|---|---|---|
| Hong Kong | 11.99% | 45.13% | 54.87% |
| United States | 9.66% | 40.28% | 59.72% |
| Malaysia | 5.91% | 15.8% | 84.2% |
| China | 5.5% | 99.91% | 0.09% |
| Taiwan | 4.64% | 24.01% | 75.99% |
WeChat Revenue Statistics
In 2023, WeChat brought in approximately $16.38 billion in revenue, maintaining a strong presence despite a slight dip that reflected the $16.44 billion it earned in 2022.
The platform reached its peak in 2021, generating an impressive $17.49 billion, due to an increase in digital transactions, advertising, and the explosive adoption of Mini Programs during the pandemic.
In 2020, WeChat’s revenue jumped to $16.15 billion, while back in 2019, the platform saw a more modest but solid return of $12.28 billion.
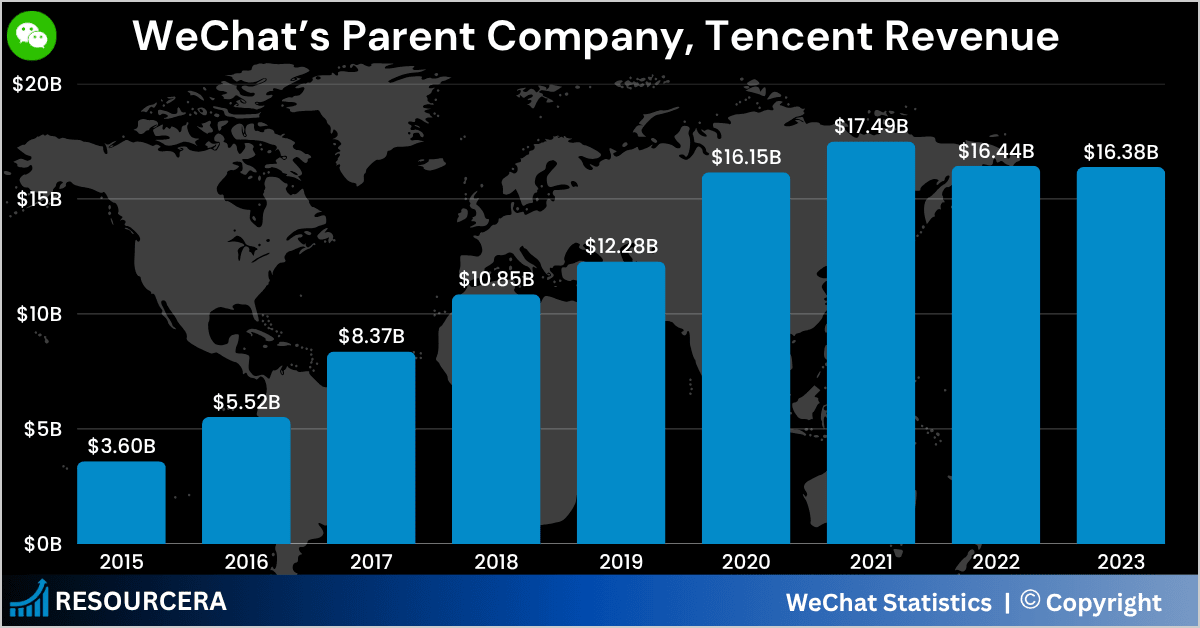
Here is a table showing the growth of WeChat’s revenue:
| Revenue | |
|---|---|
| Year | Revenue |
| 2015 | $3.6 billion |
| 2016 | $5.52 billion |
| 2017 | $8.37 billion |
| 2018 | $10.85 billion |
| 2019 | $12.28 billion |
| 2020 | $16.15 billion |
| 2021 | $17.49 billion |
| 2022 | $16.44 billion |
| 2023 | $16.38 billion |
Source: Business Of Apps
WeChat In-App Purchases Revenue
As of May 2024, WeChat had already pulled in $30.33 million from in-app purchases alone.
In 2023, the platform achieved its highest-ever IAP revenue at $71.39 million, marking a 6.3% increase over 2022’s already impressive $67.15 million.
Back in 2021, WeChat IAP revenue hit $50.32 million, a huge step up from the previous year’s $3.85 million in-app purchases revenue.
Here is a breakdown of WeChat’s in-app purchase revenue over the past few years:
| Year | WeChat In-App Purchases Revenue |
|---|---|
| 2024 | 30.3 million |
| 2023 | 71.39 million |
| 2022 | 67.15 million |
| 2021 | 50.32 million |
| 2020 | 3.85 million |
| 2019 | 1.13 million |
Source: Statista
WeChat’s Parent Company, Tencent’s Revenue
In 2023, Tencent bounced back with a 2.1% increase in revenue, earning $84.1 billion and successfully reversing its first annual revenue dip from the previous year.
In 2022, the company faced its first-ever revenue drop, falling by 5.1% to $82.4 billion from $86.8 billion in 2021.
2021 was a record-breaking year, with Tencent reaching revenue of $86.8 billion, up by 24.4% compared to $69.8 billion in 2020.
In 2020, Tencent earned $69.8 billion, growing by 28% from $54.5 billion the year before, as the pandemic boosted digital services.
Here is a table with Tencent’s revenue over the years:
| Year | Tencent’s Revenue |
|---|---|
| 2015 | $3.6 billion |
| 2016 | $5.52 billion |
| 2017 | $8.37 billion |
| 2018 | $10.85 billion |
| 2019 | $12.28 billion |
| 2020 | $16.15 billion |
| 2021 | $17.49 billion |
| 2022 | $16.44 billion |
| 2023 | $16.38 billion |
Source: Macrotrends
Related Reads List:
