

Google Search was first launched in 1998. Since then, it has consistently dominated the search engine industry. As of 2026, it continues to lead the global market with an 89.82% market share, maintaining its position as the world’s most used search platform.
Today, Google processes more than 5 trillion searches globally, translating to around 16.4 billion searches daily. Currently, over 5.06 billion people use Google Search, a 679% increase from 630 million users in 2006.
With the introduction of AI Overviews and AI Mode in its search results, Google has revolutionized how people search online. Nowadays, Google Search results depend on user intent. Let’s understand how Google Search has evolved over the years and how it will change in the future.
Key Google Search Statistics (Editor’s Pick)
- Google processes over 5 trillion global searches every year, that’s 5.9 million searches every minute.
- Google is used by 5.06 billion people globally, that’s 84.3% of all internet users.
- Google handles over 16.4 billion search queries every day worldwide.
- Google holds 89.82% of the global search market in 2026.
- Israel records the highest Google Search market share at 98.30%.
Google Search Users Over Time
There are 5.06 billion Google search users globally as of 2026, which is up from 4.95 billion in 2025. Google search users have grown by 29.74% since the start of the decade.
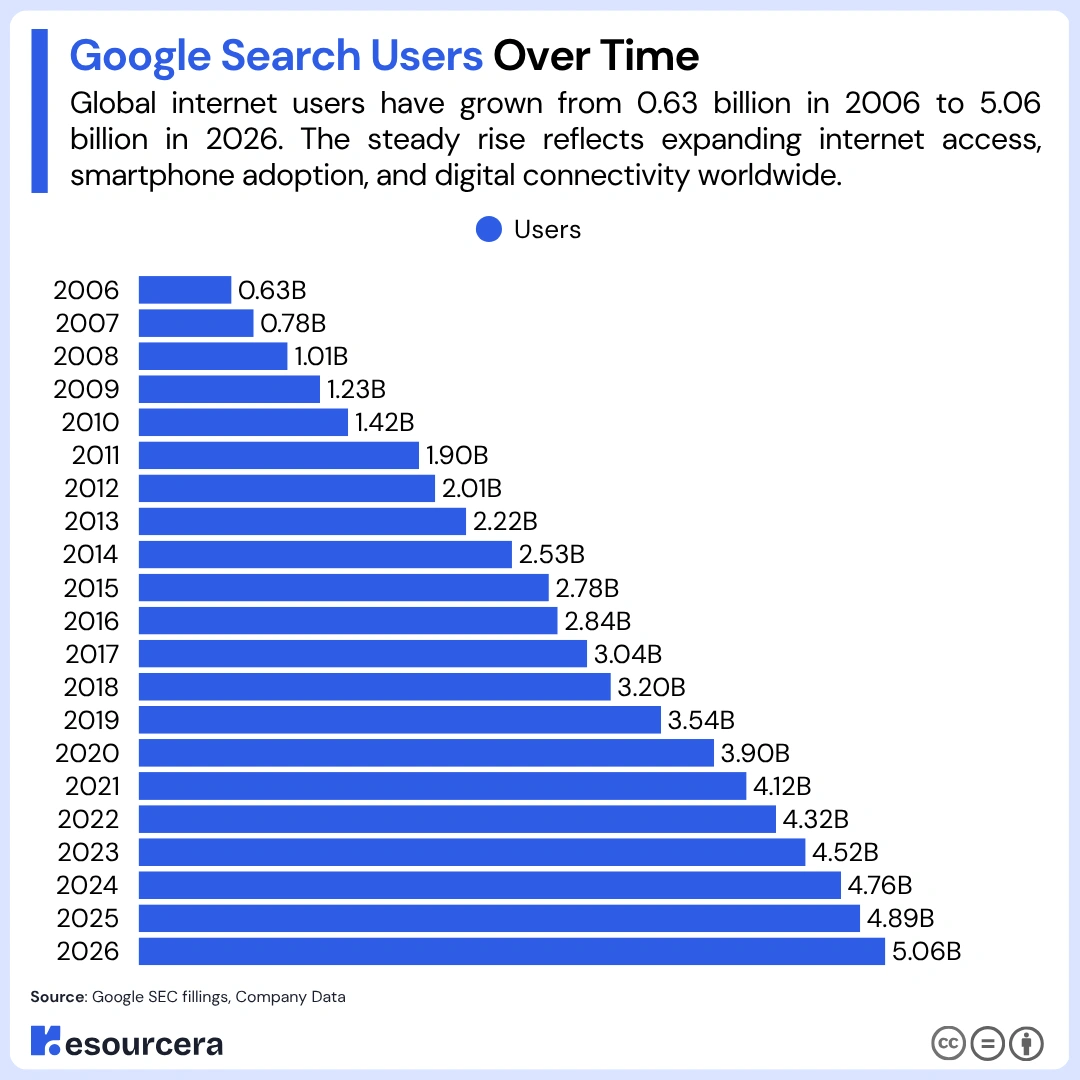
Here is a table showing the complete Google search user growth over the years:
| Year | Users |
|---|---|
| 2006 | 0.63 billion |
| 2007 | 0.78 billion |
| 2008 | 1.01 billion |
| 2009 | 1.23 billion |
| 2010 | 1.42 billion |
| 2011 | 1.90 billion |
| 2012 | 2.01 billion |
| 2013 | 2.22 billion |
| 2014 | 2.53 billion |
| 2015 | 2.78 billion |
| 2016 | 2.84 billion |
| 2017 | 3.04 billion |
| 2018 | 3.20 billion |
| 2019 | 3.54 billion |
| 2020 | 3.90 billion |
| 2021 | 4.12 billion |
| 2022 | 4.32 billion |
| 2023 | 4.52 billion |
| 2024 | 4.76 billion |
| 2025 | 4.89 billion |
| 2026 | 5.06 billion |
Source: Google SEC fillings, Company Data, News Outlets.
Google Search Usage Growth Rate Over the Years
In 2025, Google crossed over 5 trillion searches globally. Total Google searches are projected to surpass the 6 trillion mark by the end of 2026, reflecting the rise of internet access, smartphone usage, and AI-driven discovery habits.
Google’s annual search volume has increased dramatically over the past 2 decades. It started around 1 billion searches in 1999 and reached 14 billion in 2000. By 2009, it surpassed 365 billion and reached 1.2 trillion between 2012 and 2015.
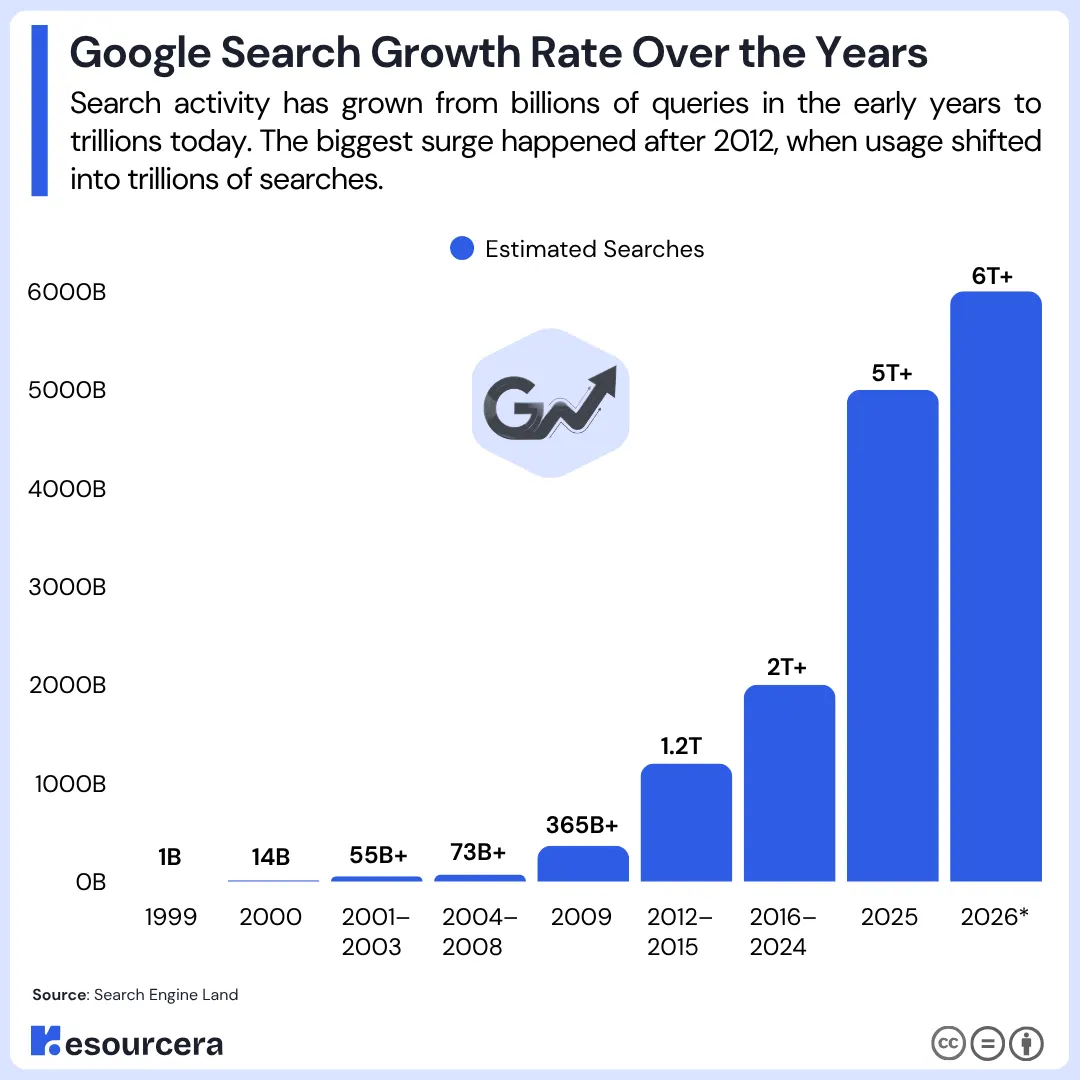
Here is a detailed overview of Google’s search growth rate over the years from 1999 to 2026:
| Time Period | Estimated Searches |
|---|---|
| 1999 | 1 billion |
| 2000 | 14 billion |
| 2001 to 2003 | 55 billion+ |
| 2004 to 2008 | 73 billion |
| 2009 | 365 billion+ |
| 2012 to 2015 | 1.2 trillion |
| 2016 to 2024 | 2 trillion+ |
| 2025 | 5 trillion+ |
| 2026* | 6 trillion |
Source: Search Engine Land
Google Search Market Share Worldwide
As of 2026, Google hold a strong 89.82% share of the global search engine market. From 2020 to 2025, Google consistently stayed above 89%, peaking at 92.58% in 2022.
Over the years, Google Search have seen small dips too, recording an average annual growth rate of -0.29% from 2020 to 2026; however, it remains the most-used search engine globally nonetheless.
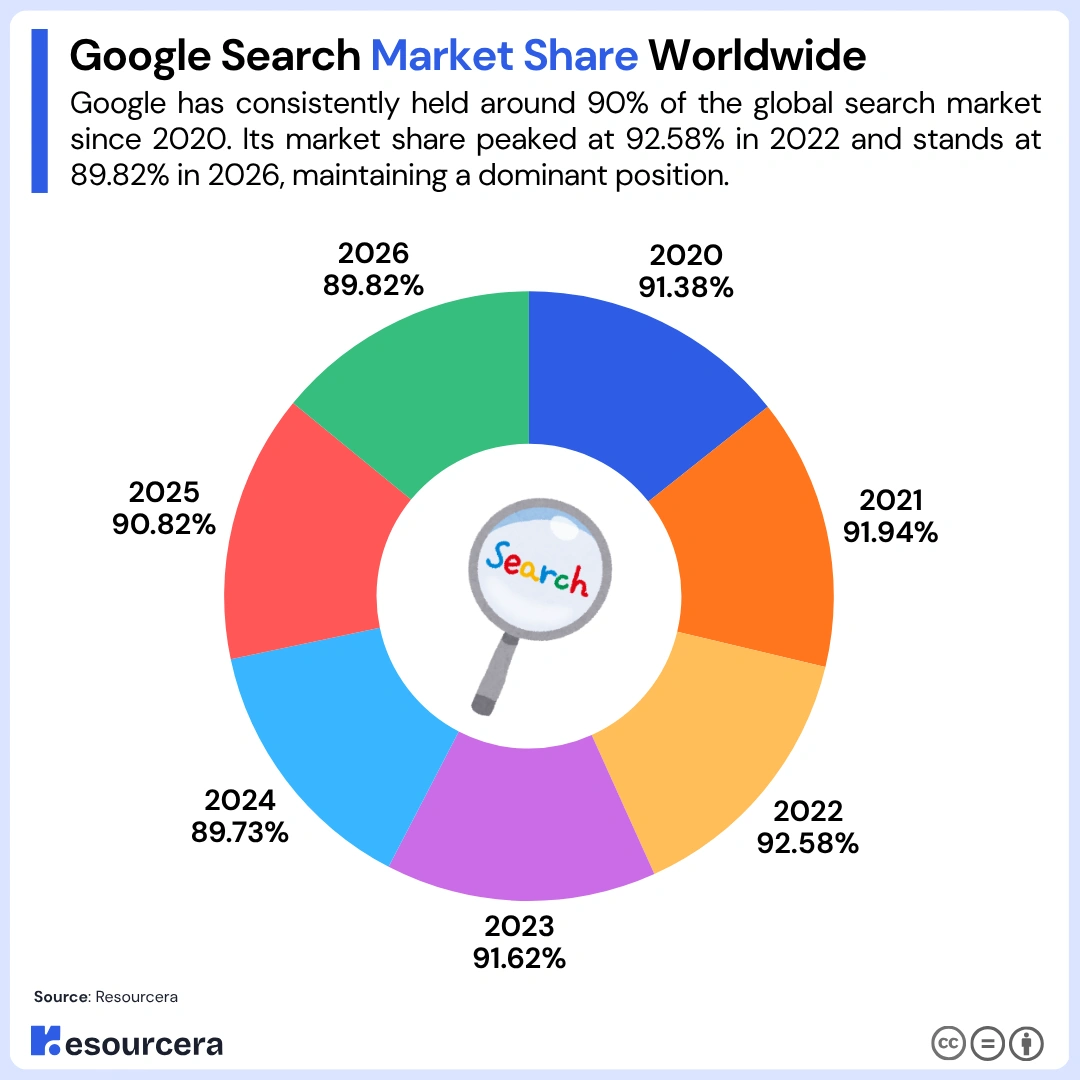
The table below shows a detailed overview of Google’s search market share globally:
| Time Period | Google Search Market Share (Worldwide) |
|---|---|
| 2020 | 91.38% |
| 2021 | 91.94% |
| 2022 | 92.58% |
| 2023 | 91.62% |
| 2024 | 89.73% |
| 2025 | 90.82% |
| 2026 | 89.82% |
Google Search Market Share In Different Countries
In 2026, Israel records the highest Google Search market share at 98.30%, closely followed by India at 97.38%. The UK (91.95%), Brazil (91.14%), New Zealand (91.04%), and Australia (90.70%) rank 3rd, 4th, 5th, and 6th, respectively.
In North America, Google hold 83.86% in the US and 86.70% in Canada. However, market share dropped sharply in Japan (64.45%), South Korea (42.75%), Russia (27.43%), and China (1.92%).
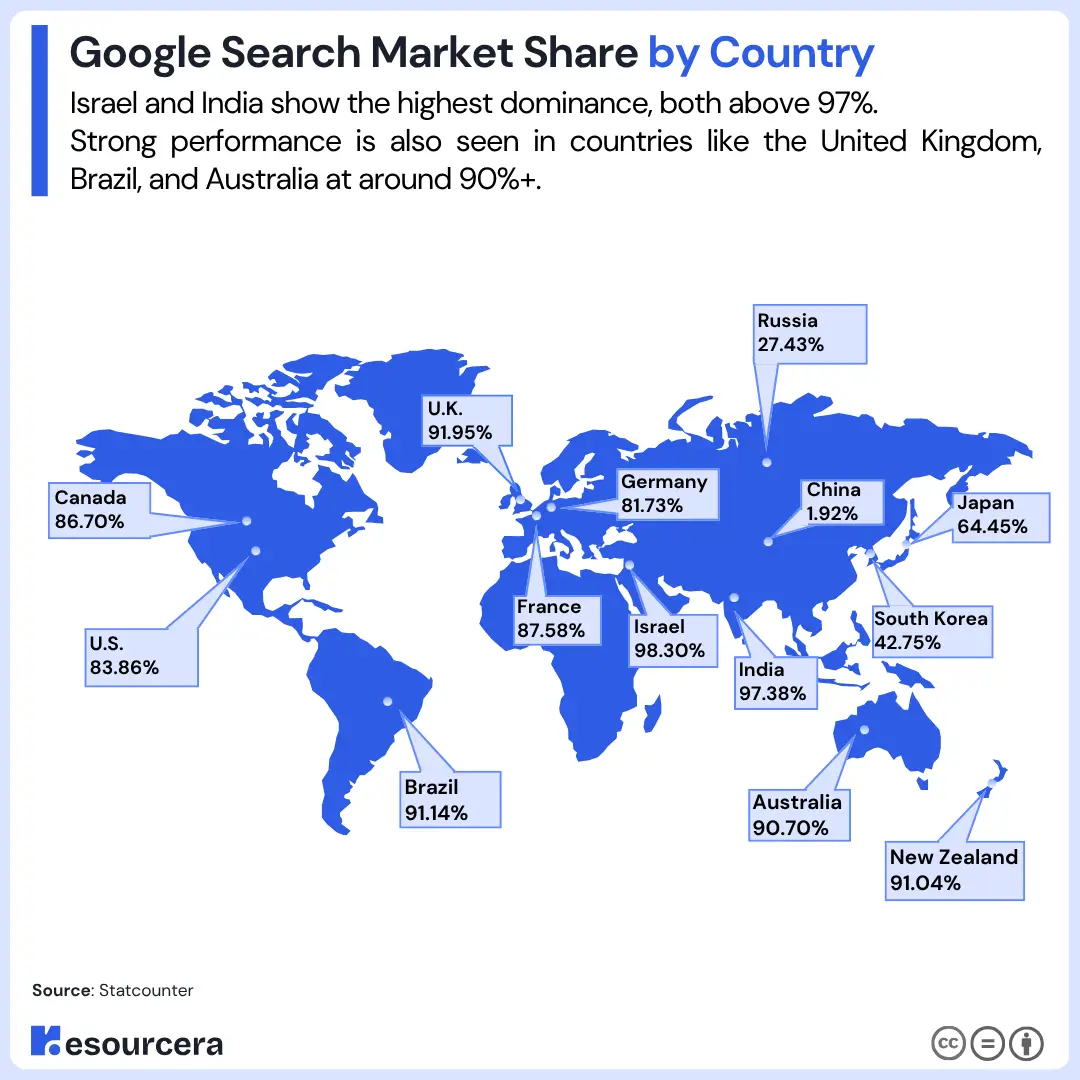
Here is the table to showcase the detailed overview of Google Search’s market share by country:
| Country | Google Search Market Share (2026) |
|---|---|
| Israel | 98.30% |
| India | 97.38% |
| United Kingdom | 91.95% |
| Brazil | 91.14% |
| New Zealand | 91.04% |
| Australia | 90.70% |
| France | 87.58% |
| Canada | 86.70% |
| United States of America | 83.86% |
| Germany | 81.73% |
| Japan | 64.45% |
| South Korea | 42.75% |
| Russia | 27.43% |
| China | 1.92% |
Google Search Market Share in the United States
In 2026, Google’s search market share in the United States stood at 83.86%, having declined from previous years. Between 2020 and 2025, Google consistently stayed within the 87% to 89% range, peaking at 88.70% in 2022.
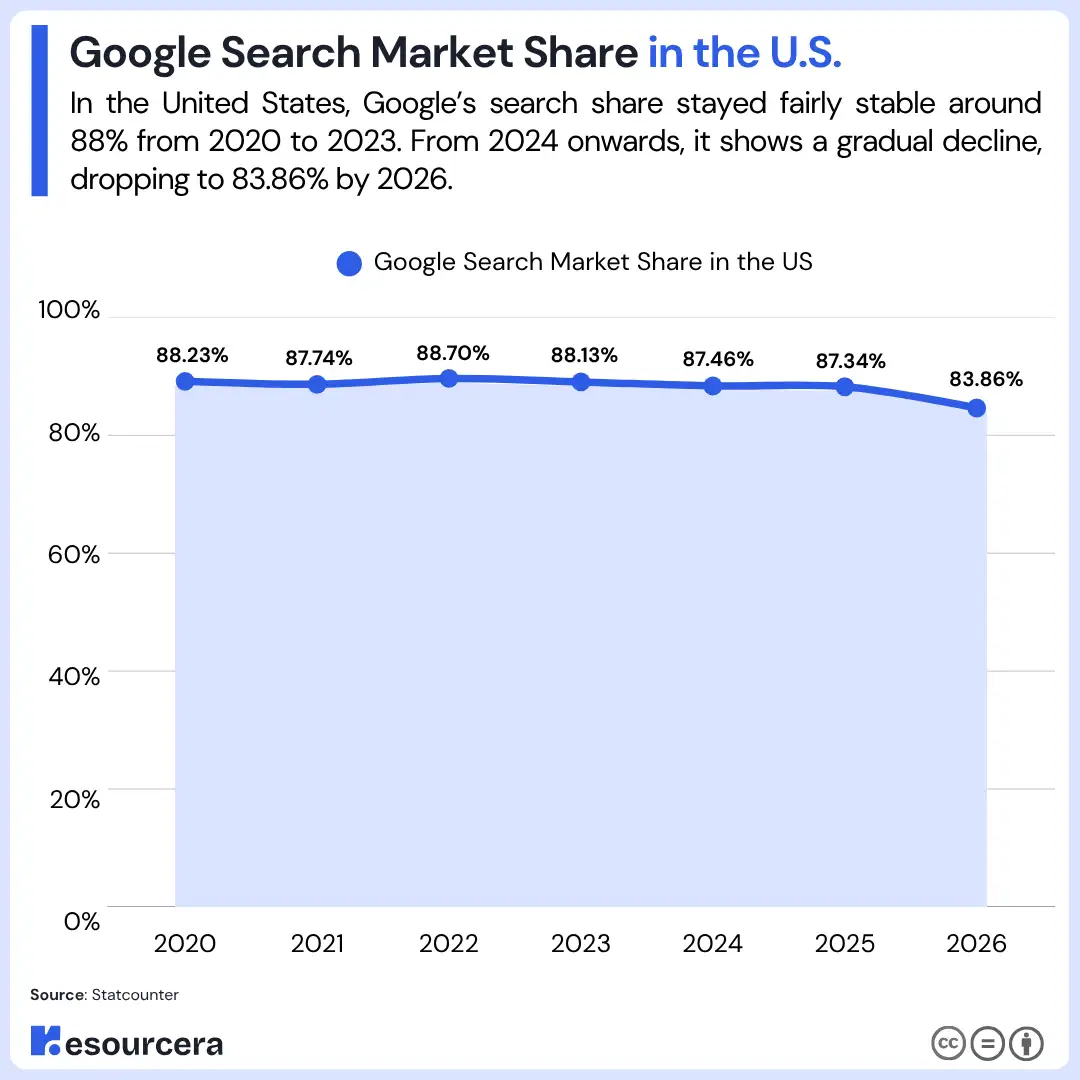
However, the decline in 2026 reflects the growing competition and changing search habits, even in one of Google’s strongest long-term markets.
| Year | Google Search Market Share in the US |
|---|---|
| 2020 | 88.23% |
| 2021 | 87.74% |
| 2022 | 88.70% |
| 2023 | 88.13% |
| 2024 | 87.46% |
| 2025 | 87.34% |
| 2026 | 83.86% |
Source: Statcounter
How Many Google Searches Per Day?
As of 2026, Google processes over 5 trillion searches annually, reflecting around 13.07 billion searches per day and 98.19 billion website visits a month. Google processes around 1,088% more searches per day than Bing searches.
Google officially released the figure in 2016 that it handled at least 2 trillion searches per year, showcasing a 150% increase in search volume since then till 2026.
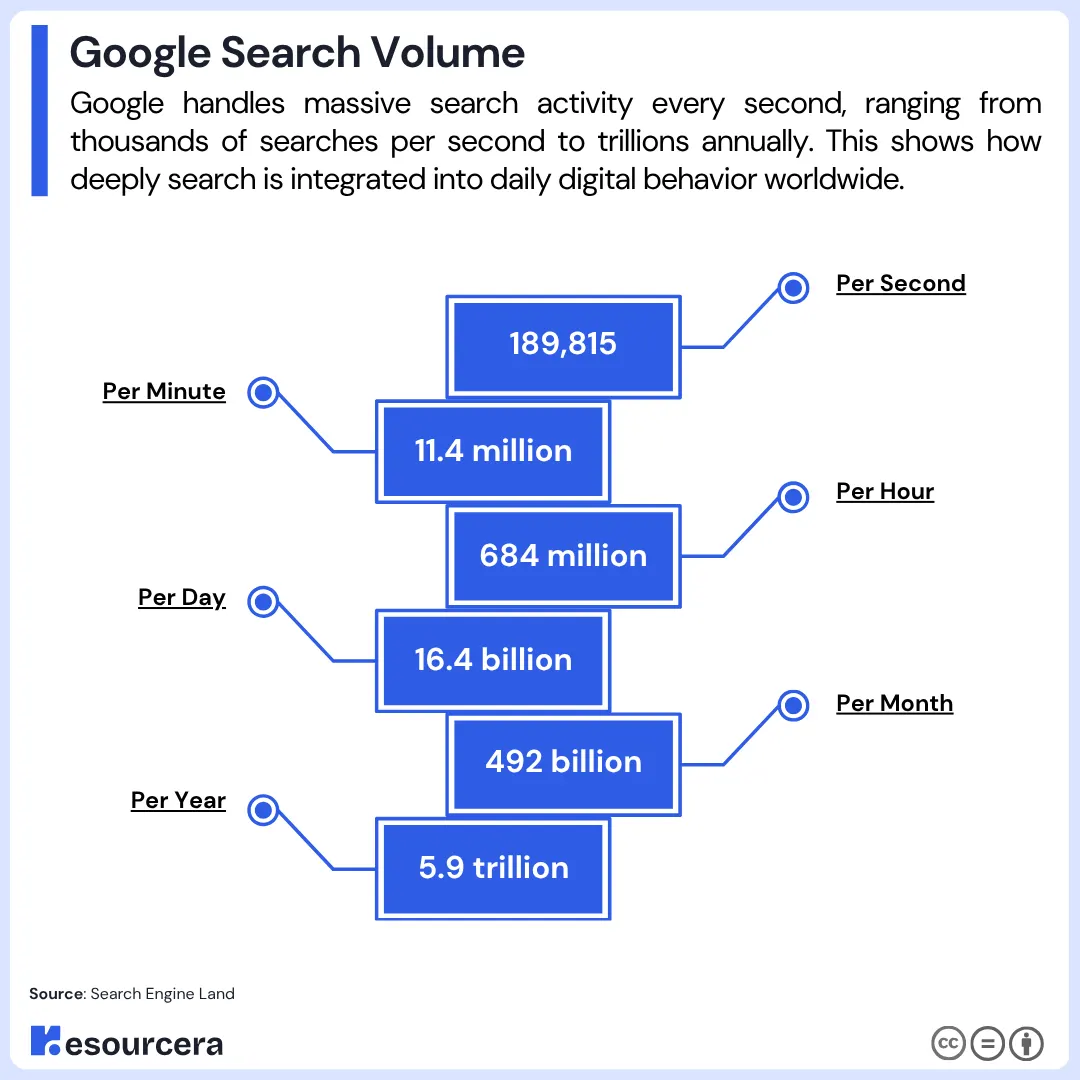
Here is a detailed table about the projected number of Google Searches per second, minute, day, and month.
| Time Frame | Estimated Google Searches |
|---|---|
| Per Year | 5 trillion |
| Per Month | 416.67 billion |
| Per Day | 13.70 billion |
| Per Hour | 570.78 million |
| Per Minute | 9.51 million |
In the United States, desktop users do about 126 unique Google searches per month. It is roughly 4.2 searches per person per day.
According to the data, 34% of American users performed over 101 searches per month, 36% conducted between 21 and 100 searches monthly, and 30% did 1 to 20 searches per month.
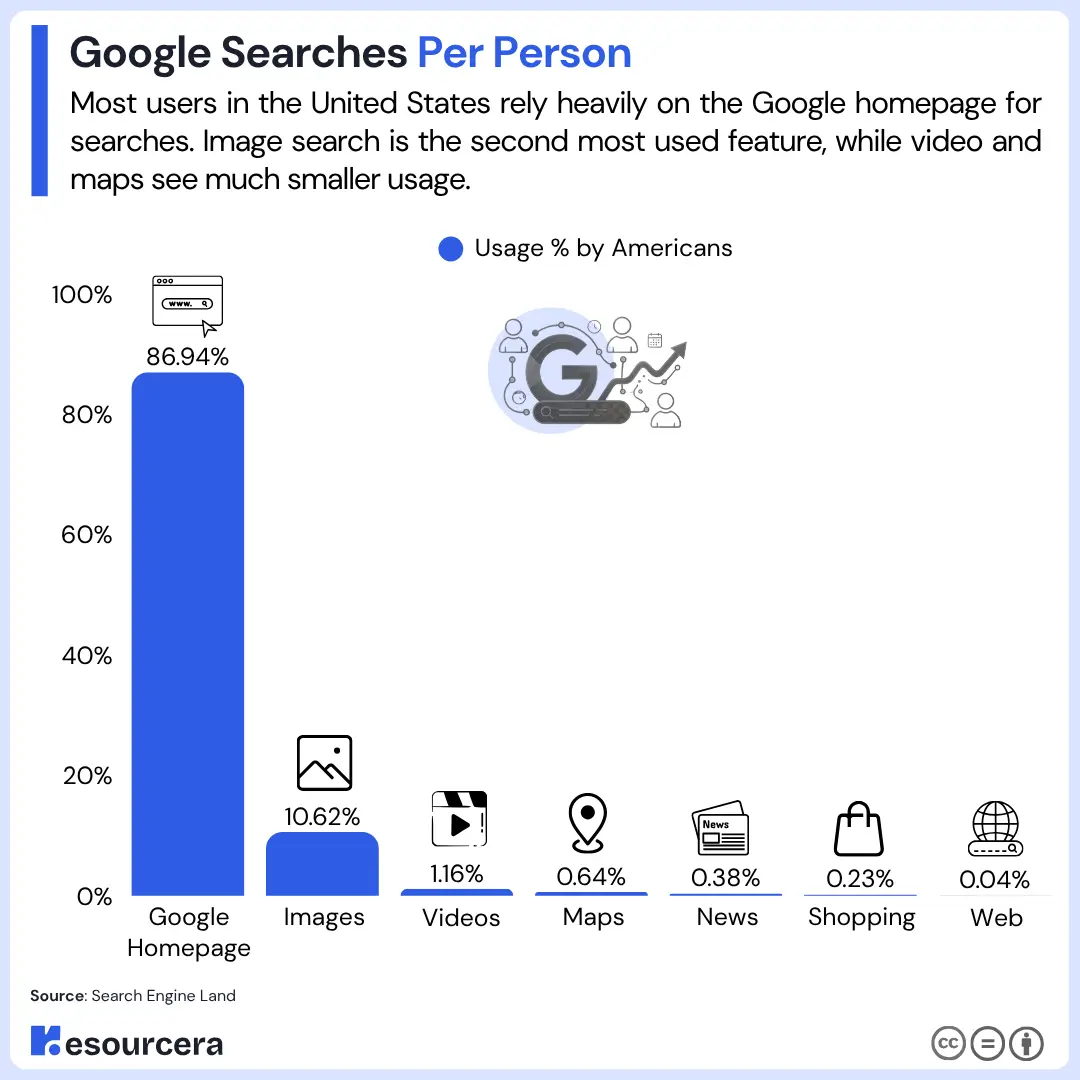
Here is a detailed overview of how Americans use Google’s search verticals:
| Google Search Vertical | Usage % by Americans |
|---|---|
| Google Search box | 86.94% |
| Images | 10.62% |
| Video | 1.16% |
| Maps | 0.64% |
| News | 0.38% |
| Shopping | 0.23% |
| Web | 0.04% |
Source: Search Engine Land
Desktop vs. Mobile Google Search Statistics
- Over 4 billion people worldwide use smartphones, and nearly 95% of them rely on Google as their primary search engine.
- For desktop users, Google remains the top choice, with 82.79% using it as their primary search engine.
- Around 63% of Google searches in the United States happen on mobile devices. This highlights strong mobile-first behavior.
- Nearly 40% of mobile searches use three to four words. This shows that users tend to keep mobile queries short, focused, and intent-driven.
Sources: Statcounter, MageCamp
Most Searched Keywords on Google Worldwide
“ChatGPT” is the most searched keyword worldwide on Google, with 768.3 million searches per month. It is followed by “WhatsApp Web” and “YouTube”, with 533.4 million and 390.8 million monthly searches, respectively.
“Chat GPT” and “Translate” rank fourth and fifth in the list, with 277.6 million and 254.3 million monthly searches, respectively.
Here is the table to show the most searched keywords on Google globally:
| Keyword | Search Volume |
|---|---|
| Chatgpt | 768.3 million |
| Whatsapp web | 533.4 million |
| Youtube | 390.8 million |
| Chat gpt | 277.6 million |
| Translate | 254.3 million |
| 207.2 million | |
| Amazon | 204.1 million |
| 192.3 million | |
| Gmail | 189.8 million |
| Canva | 185.0 million |
Most Searched Keywords on Google in the United States
In the United States, “YouTube” is the most searched keyword on Google, with 88.3 million searches per month. It is followed by “ChatGPT” and “Amazon” with around 81.24 million and 81.17 million monthly searches, respectively.
“Google” itself is the fourth most searched keyword on Google, with 73.23 million searches per month.
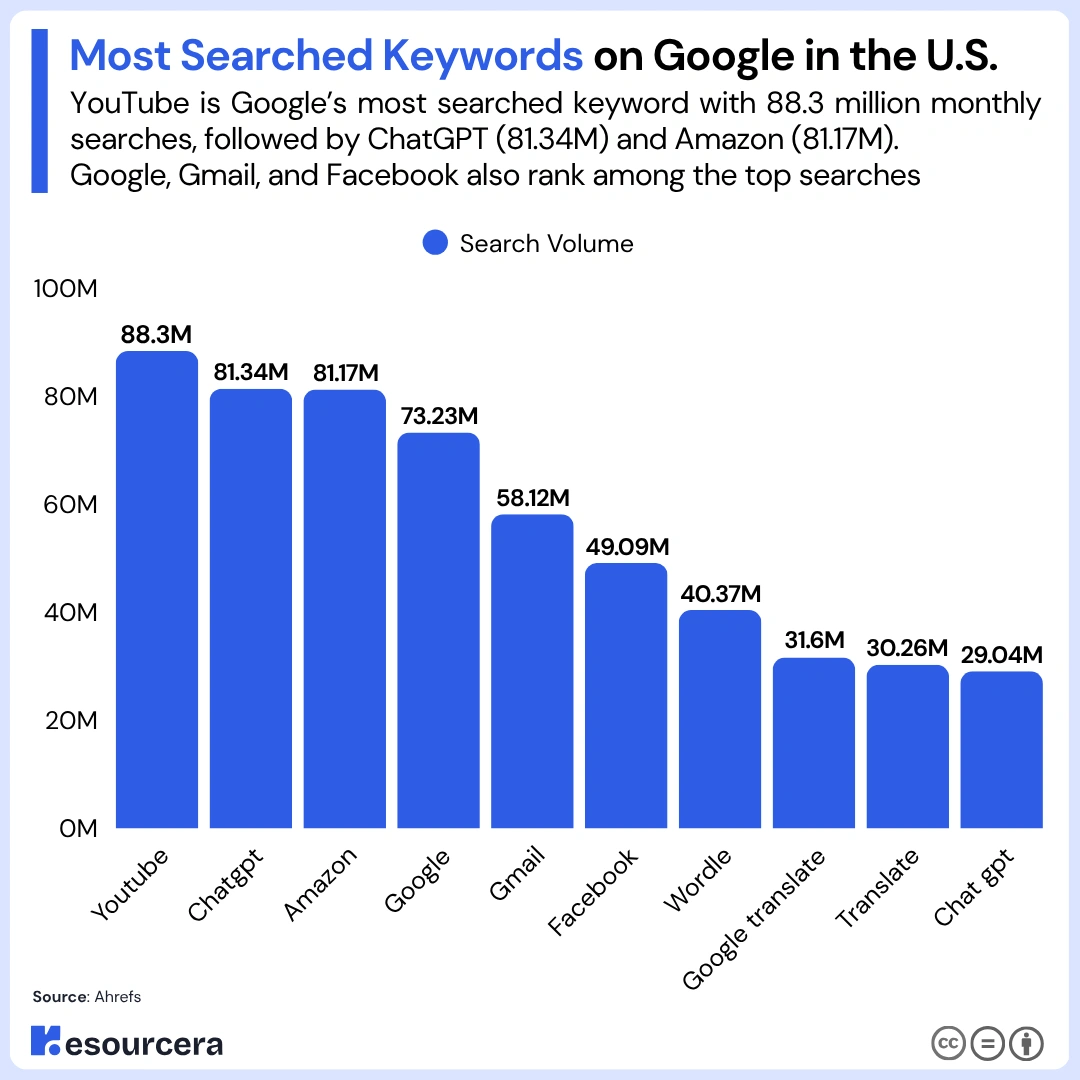
The table below showcases the most searched keywords on Google in the USA:
| Keyword | Search Volume |
|---|---|
| Youtube | 88.3 million |
| Chatgpt | 81.34 million |
| Amazon | 81.17 million |
| 73.23 million | |
| Gmail | 58.12 million |
| 49.09 million | |
| Wordle | 40.37 million |
| Google translate | 31.60 million |
| Translate | 30.26 million |
| Chat gpt | 29.04 million |
Source: Ahrefs 1, Most Searched things on Google
Google Lens Search Statistics
- People now use Google Lens for 12 billion visual searches per month. This marks a 4x jump in two years.
Interestingly, a growing share of these searches is now multimodal, which means users combine images with text to find exactly what they need.
- About 32.5% of Google Lens results come from pages whose title tags contain a keyword that matches the Lens search term.
This means that keyword-optimized title tags may help improve visual search rankings in Google Lens results.
- Nearly 1/3rd of all Google Lens image results are found within the top 25% portion of a webpage.
This stat figure shows that higher on-page placement drastically increases the chances of images being surfaced in Lens results.
- Around 7.2% of all visual search results come from Pinterest, and about 4.1% come from Amazon, making them the top-performing websites in Google Lens results.
Source: Backlinko
Voice Search Statistics on Google
- Voice-based queries account for roughly 27% of all Google searches conducted on mobile devices.
- Gen Z records the highest adoption of voice assistants, with 55.2% using them monthly.
- Voice searches that include the phrase “near me” account for 76% of local business-related queries.
- More than 60% of local search queries are made through voice search, reflecting a strong shift toward hands-free, conversational search behavior.
- Google Assistant handles more than 1 billion voice searches every month globally.
Sources: Think with Google, Imarticus, Search Engine Land, Bitbinders
AI-Focused Google Search Statistics
- AI Overviews now show up in over 55% of Google search results. Whereas it shows up in roughly 60% of searches in the United States.
- Around 58% of adults in the United States reported conducting at least one Google search that displayed an AI-generated summary in the results.
- Wikipedia, YouTube, and Reddit are the most-cited platforms in both AI summaries and traditional search results, accounting for about 15% of AI-generated links and 17% of regular search links.
- AI Overviews usually include 8 to 11 citations, with 9 sources being the most common (6.55%), followed by 8 sources (6.47%) and 10 sources (6.27%).
- AI Overviews tend to be concise, with about 33% of responses ranging between 150 and 200 words. It indicates that users now prefer short, digestible answers rather than long-form explanations.
Sources: Ahrefs 2, Pew Research Center
Consumer Behavior Google Search Statistics
- Multiple search data shows that a large share of users use search engines mainly for information. In particular, 60.5% of Millennials use search to learn, research, and find detailed answers. This highlights search engines as a primary source of knowledge for this generation.
- Transactional intent, where users are ready to buy or complete an action, now accounts for 26.4% of total searches, rising from 24.7% last year.
- Repeat search activity has grown by 5.1%, mainly due to users returning more frequently to familiar queries, trusted websites, or previously visited pages.
- In early 2026, about 13.1% of all Google searches were navigational queries. This means users were directly looking for a specific brand or website, such as “Facebook” or “YouTube”, rather than searching for general information or exploring new topics.
Sources: ScienceDirect, SEOptimer

