


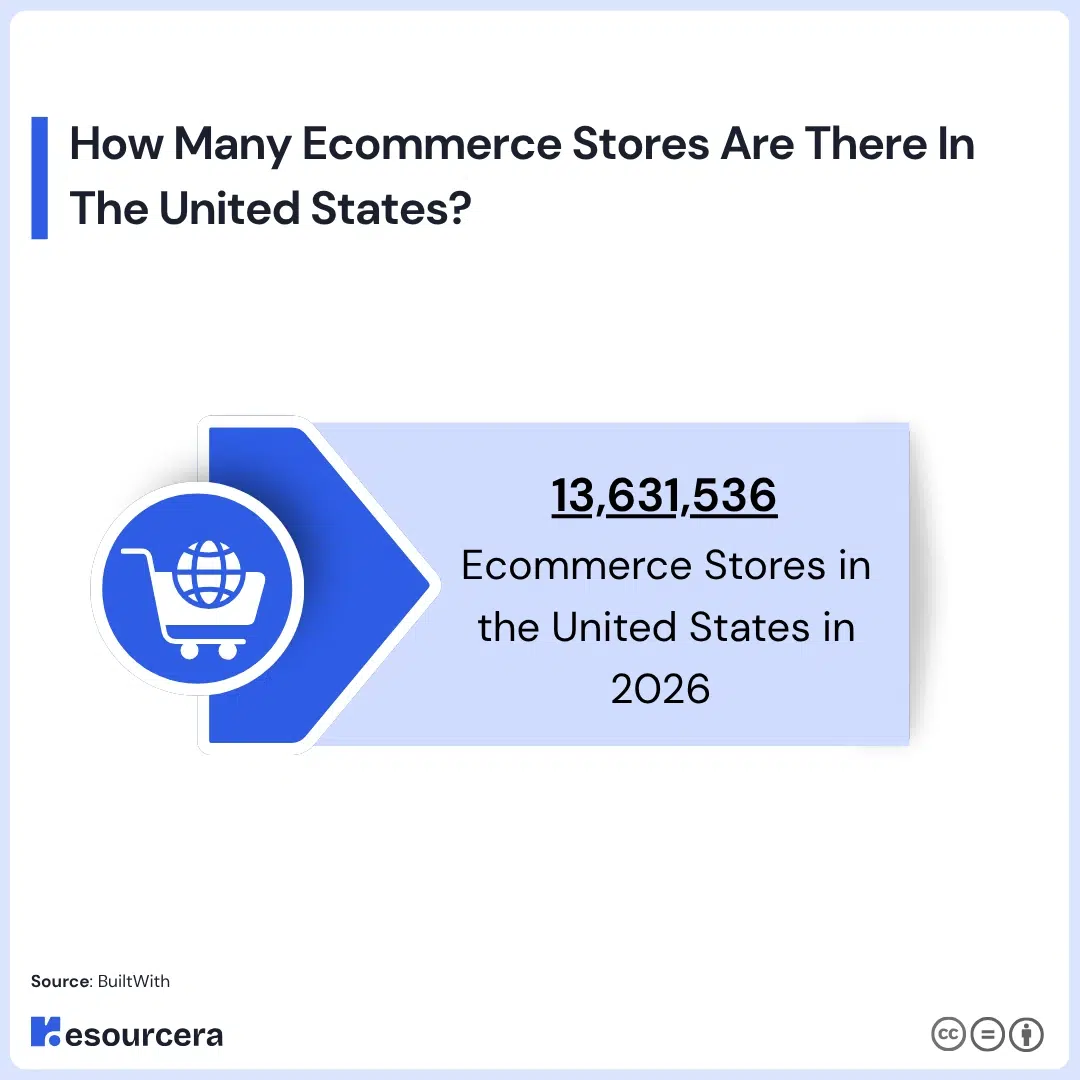
There are 13.63 million ecommerce stores in the United States in 2026. The Country accounts for 55.5% of the world’s 24.56 million ecommerce stores. No other country has even a 5% share.
The US store count has almost doubled since 2020, back then, the country had 7.32 million online stores.
This post covers the total store count, growth by year, platform market share, country comparisons, store revenue, returns, mobile share, AI adoption, and cart abandonment data.
Number of Ecommerce Stores in USA (Top Picks)
- There are 13,631,536 (13.63 million) ecommerce stores in the United States in 2026.
- 55.50% of the world’s 24.56 million ecommerce stores are based in the US.
- The US added 836,794 new stores in 2026, a 6.54% rise on 2025.
- Shopify powers 28.89% of US ecommerce stores, the largest share of any platform.
- The US has 13.3 times more ecommerce stores than the United Kingdom, the second-placed country.
- US ecommerce stores generated $1.23 trillion in sales in 2025.
- Amazon alone took 40.5% of US ecommerce sales in 2025.
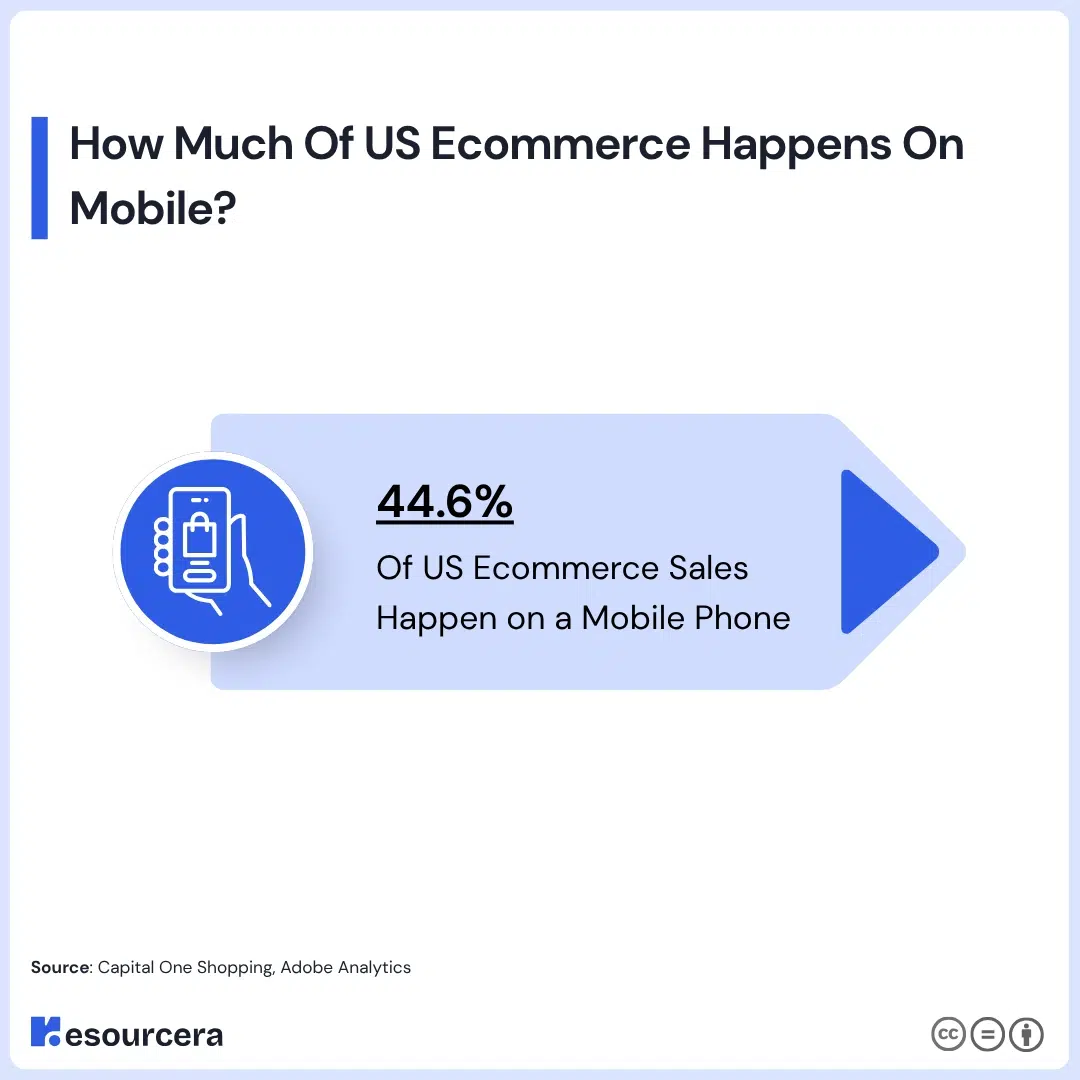
- 44.6% of US ecommerce sales happen on a mobile phone.
How Many Ecommerce Stores Are In The United States?
There are 13.63 ecommerce stores in the United States in 2026. That is 55.50% of the 24.56 million ecommerce stores in the world. The store count has grown 86.12% since 2020, when the US had 7.32 million stores.
Source: BuiltWith
US Ecommerce Store Growth By Year
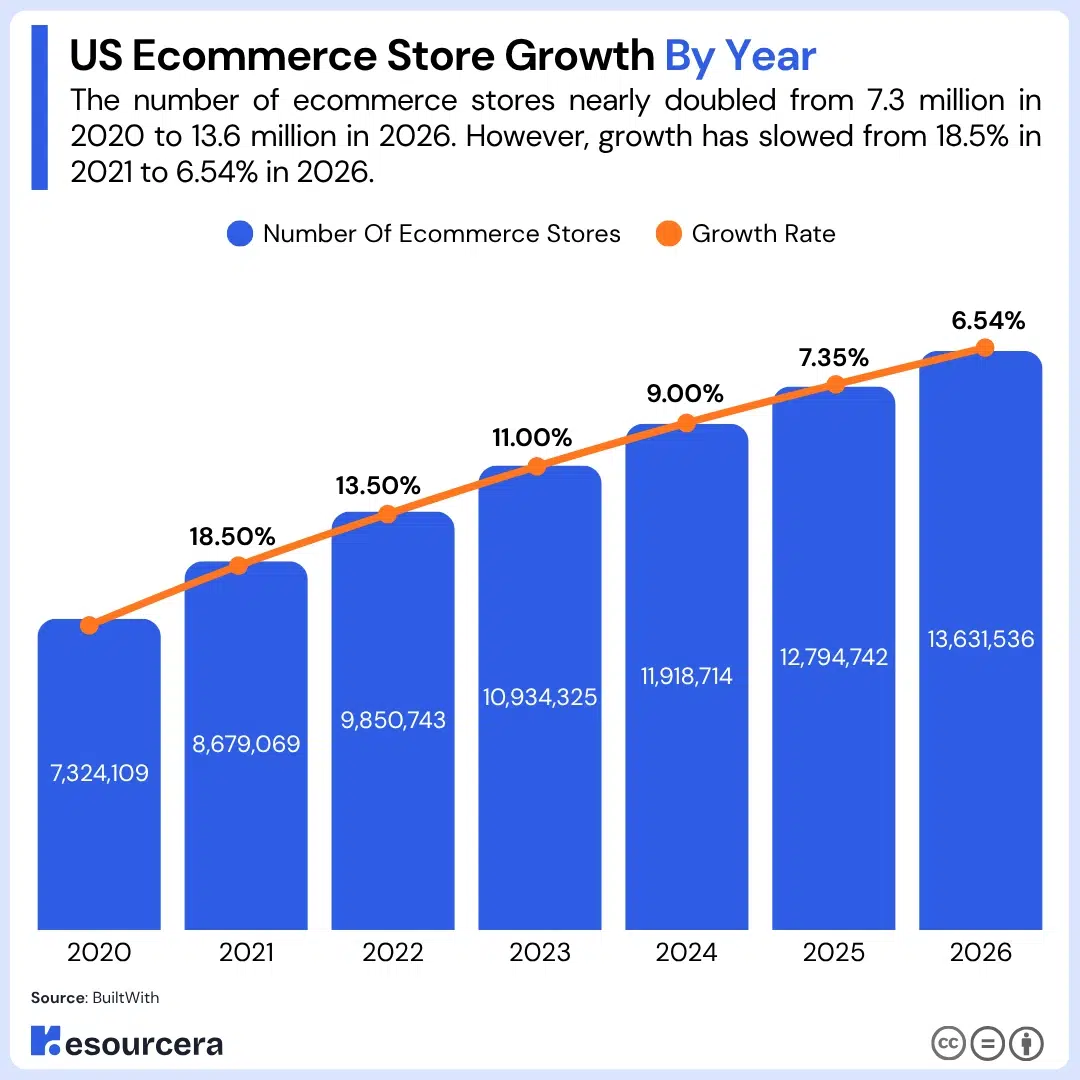
The US added 836,794 ecommerce stores in 2026, a 6.54% rise on 2025. The store count has grown every year since 2020, but the growth rate has slowed each year as the base has got bigger.
| Year | Number Of Ecommerce Stores | Growth Rate |
|---|---|---|
| 2020 | 7,324,109 | – |
| 2021 | 8,679,069 | 18.50% |
| 2022 | 9,850,743 | 13.50% |
| 2023 | 10,934,325 | 11.00% |
| 2024 | 11,918,714 | 9.00% |
| 2025 | 12,794,742 | 7.35% |
| 2026 | 13,631,536 | 6.54% |
2021 remains the fastest growth year in the series at 18.50%, driven by the post-pandemic boom in online selling.
Source: BuiltWith
Ecommerce Platform Market Share In The US
Shopify is the most used ecommerce platform in the United States with a 28.89% market share in 2026. Wix Stores ranks second at 20.93% and Squarespace Add to Cart ranks third at 15.87%.
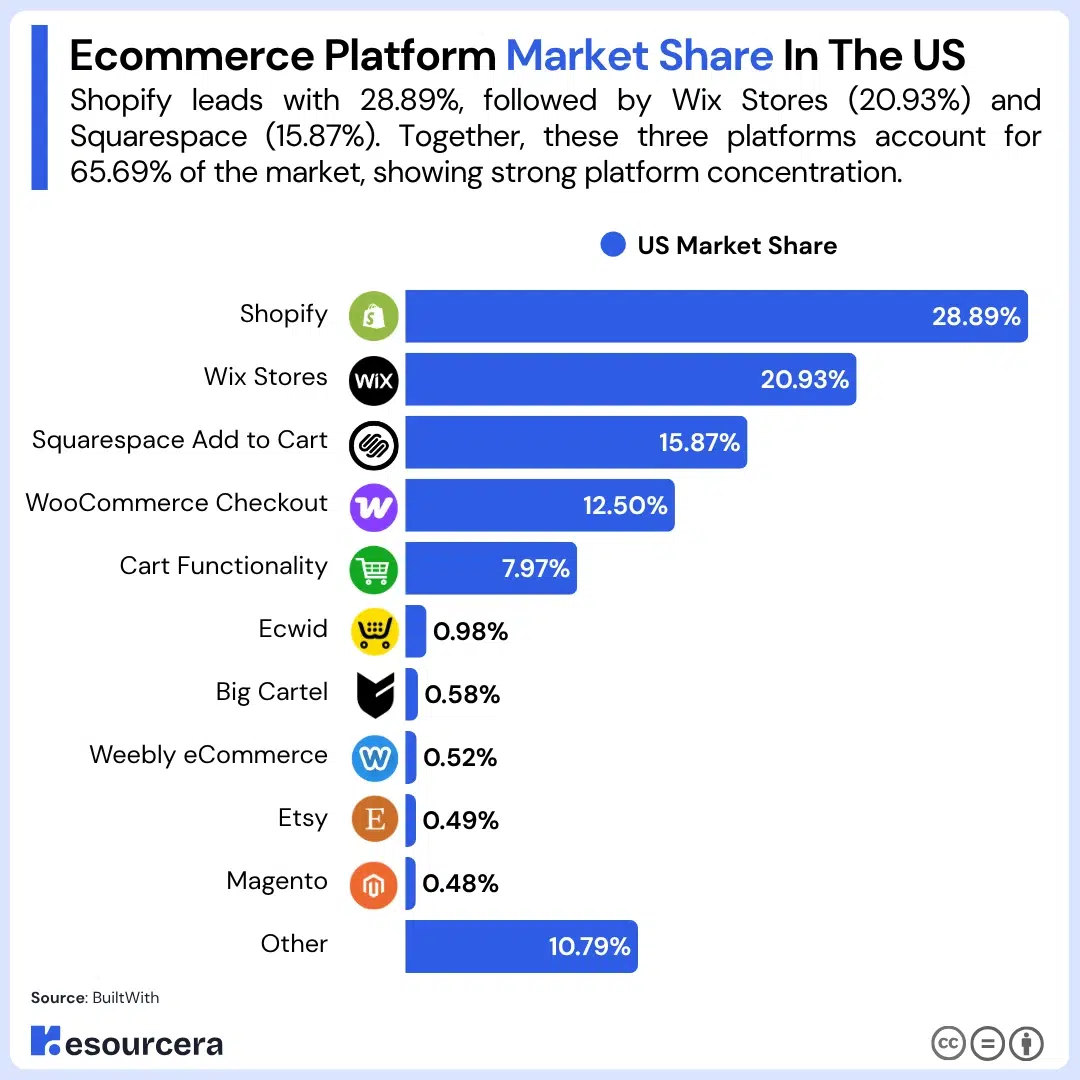
The top three platforms together power 65.69% of all US ecommerce stores.
| Ecommerce Platform | US Market Share |
|---|---|
| Shopify | 28.89% |
| Wix Stores | 20.93% |
| Squarespace Add to Cart | 15.87% |
| WooCommerce Checkout | 12.50% |
| Cart Functionality | 7.97% |
| Ecwid | 0.98% |
| Big Cartel | 0.58% |
| Weebly eCommerce | 0.52% |
| Etsy | 0.49% |
| Magento | 0.48% |
| Other | 10.79% |
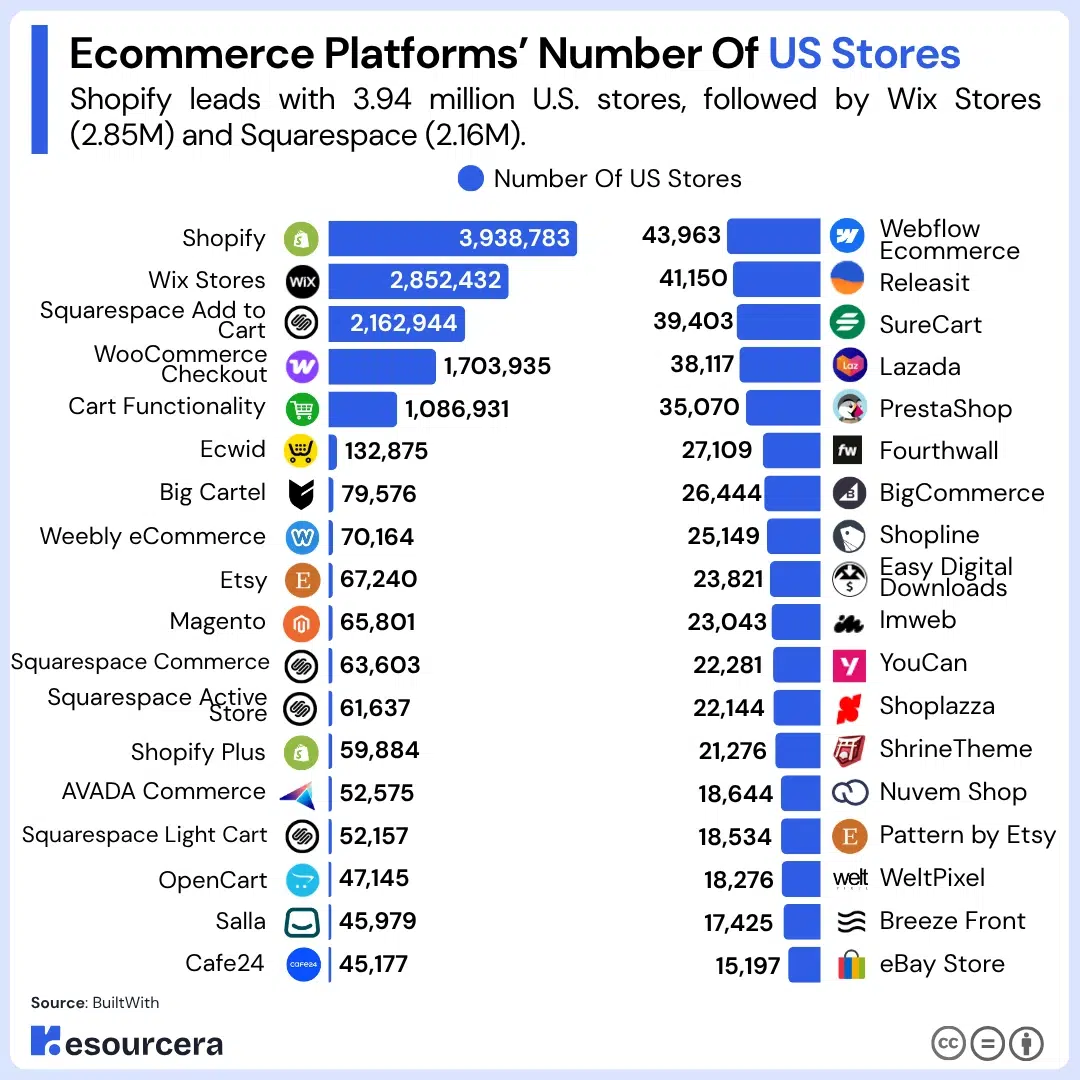
Shopify runs 3,938,783 stores in the US, more than one million ahead of second-placed Wix Stores.
| Ecommerce Platform | Number Of US Stores |
|---|---|
| Shopify | 3,938,783 |
| Wix Stores | 2,852,432 |
| Squarespace Add to Cart | 2,162,944 |
| WooCommerce Checkout | 1,703,935 |
| Cart Functionality | 1,086,931 |
| Ecwid | 132,875 |
| Big Cartel | 79,576 |
| Weebly eCommerce | 70,164 |
| Etsy | 67,240 |
| Magento | 65,801 |
| Squarespace Commerce | 63,603 |
| Squarespace Active Store | 61,637 |
| Shopify Plus | 59,884 |
| AVADA Commerce | 52,575 |
| Squarespace Light Cart | 52,157 |
| OpenCart | 47,145 |
| Salla | 45,979 |
| Cafe24 | 45,177 |
| Webflow Ecommerce | 43,963 |
| Releasit | 41,150 |
| SureCart | 39,403 |
| Lazada | 38,117 |
| PrestaShop | 35,070 |
| Fourthwall | 27,109 |
| BigCommerce | 26,444 |
| Shopline | 25,149 |
| Easy Digital Downloads | 23,821 |
| Imweb | 23,043 |
| YouCan | 22,281 |
| Shoplazza | 22,144 |
| ShrineTheme | 21,276 |
| Nuvem Shop | 18,644 |
| Pattern by Etsy | 18,534 |
| WeltPixel | 18,276 |
| Breeze Front | 17,425 |
| eBay Store | 15,197 |
Source: BuiltWith
Which Country Has The Most Ecommerce Stores?
The United States has the most ecommerce stores of any country, with 13.63 million stores in 2026. That is 13.3 times more than the United Kingdom, which ranks second with 1.02 million stores.
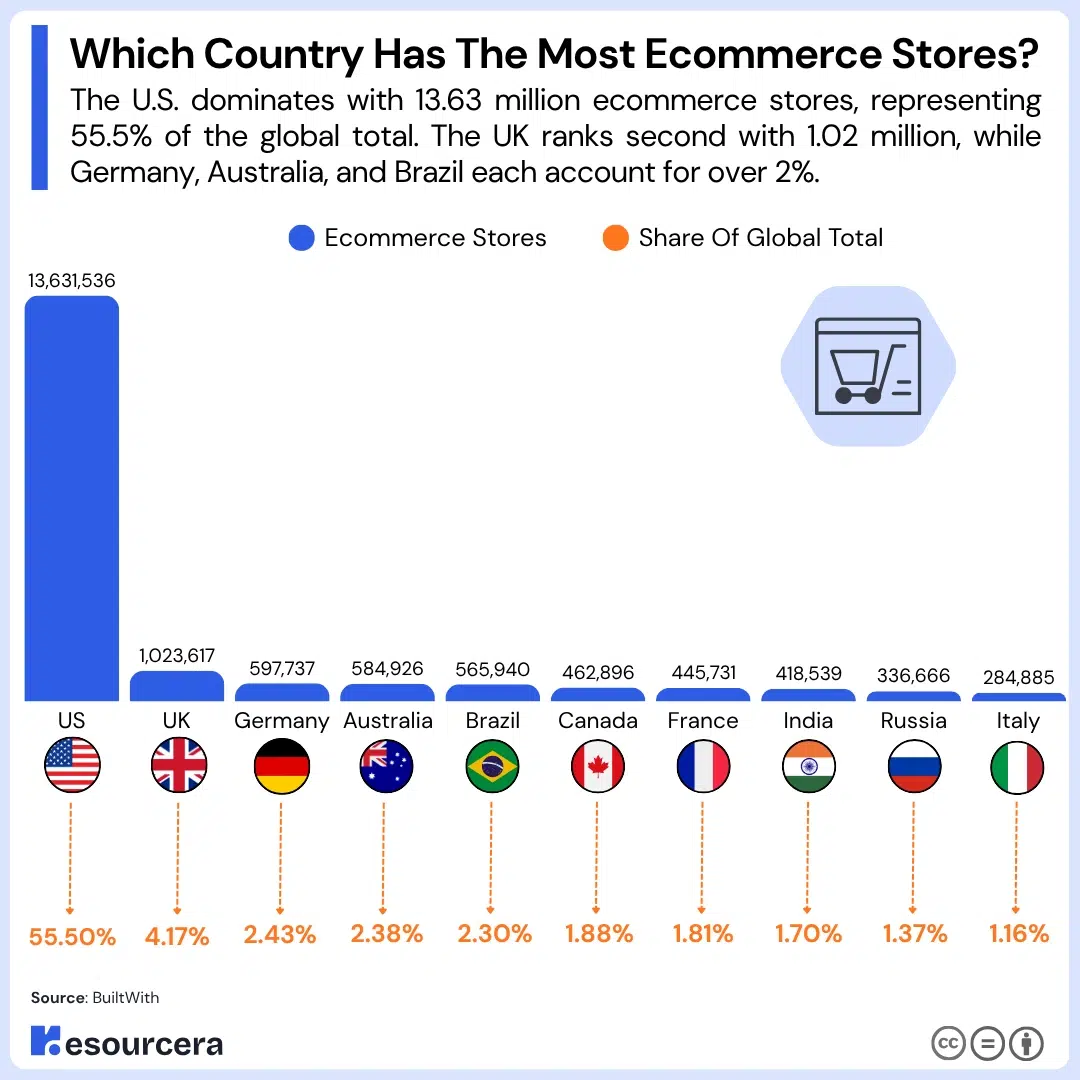
The US has 2.9 times more stores than the next nine countries put together.
| Country | Ecommerce Stores | Share Of Global Total |
|---|---|---|
| United States | 13,631,536 | 55.50% |
| United Kingdom | 1,023,617 | 4.17% |
| Germany | 597,737 | 2.43% |
| Australia | 584,926 | 2.38% |
| Brazil | 565,940 | 2.30% |
| Canada | 462,896 | 1.88% |
| France | 445,731 | 1.81% |
| India | 418,539 | 1.70% |
| Russia | 336,666 | 1.37% |
| Italy | 284,885 | 1.16% |
Source: BuiltWith
How Much Revenue Do US Ecommerce Stores Generate?
US ecommerce stores generated $1.23 trillion in sales in 2025, up 5.4% from $1.17 trillion in 2024. Sales reached $302.3 billion in the first quarter of 2026 alone, a 9.7% rise on the same quarter a year earlier.
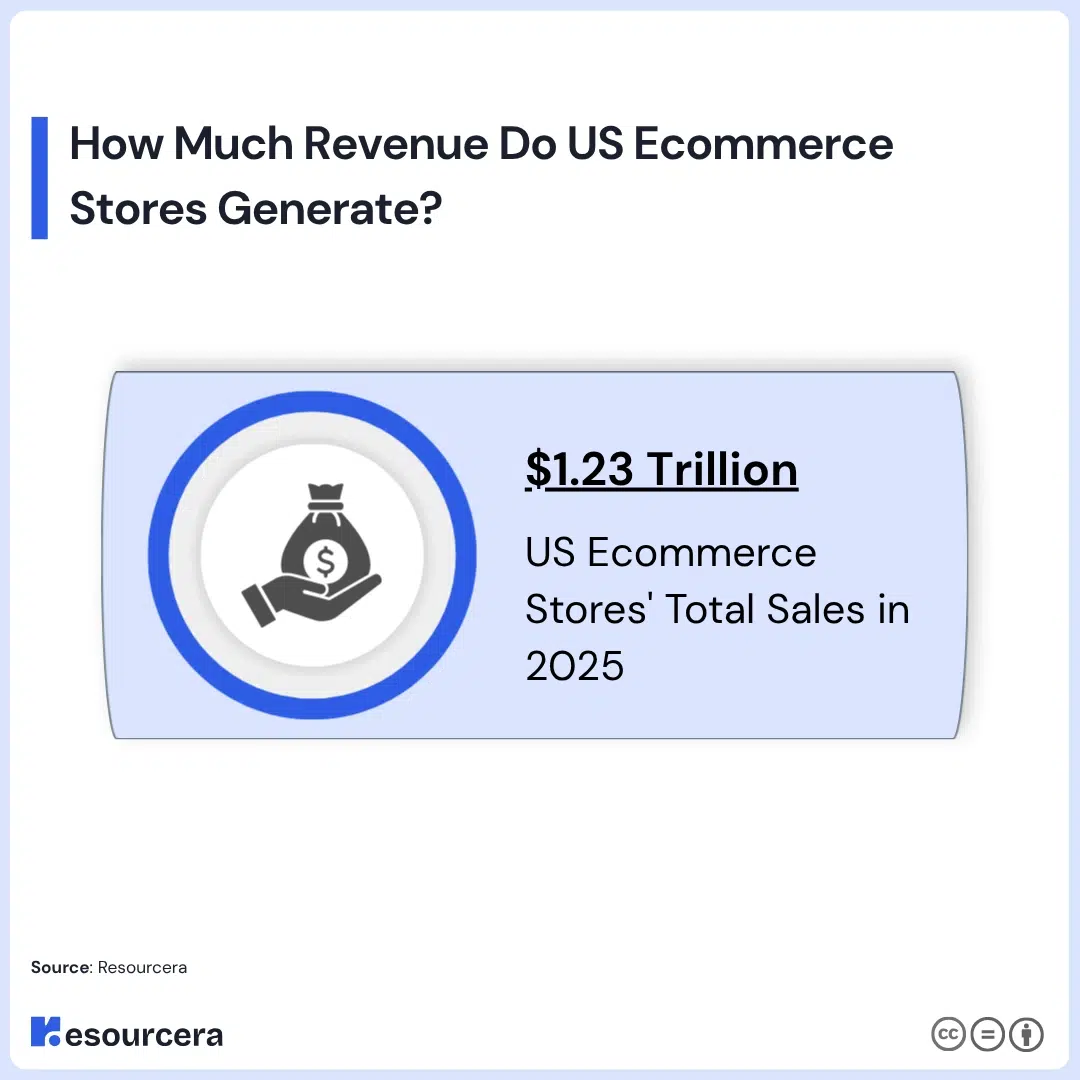
US online sales have grown 54.5% since 2020, when stores sold $798.5 billion. In 2025, sales worked out to an average of about $96,400 per store.
For the full quarterly and yearly breakdown, see our report on US ecommerce sales.
Source: Resourcera
How Concentrated Is The US Ecommerce Market?
Two companies now handle almost half of every dollar spent online in the US. Amazon took 40.5% of US ecommerce sales in 2025 and Shopify took 14%. Together, that is 49.7% of the $1.2 trillion US ecommerce market.
Amazon’s share is more than four times bigger than second-placed Walmart at 9.2%. Apple sits at 3.9% and eBay at around 3.0%. This means the roughly 13.6 million other US stores share the remaining half of the market.
Amazon also runs a third-party marketplace where independent sellers list products. Third-party sellers now drive 69% of Amazon’s total sales, an all-time high. About 100,000 sellers passed $1 million in yearly Amazon sales in 2025, up from around 60,000 in 2021.
Sources: Marketplace Pulse, eMarketer, Statista
How Much Do Shoppers Spend Per Order In The US?
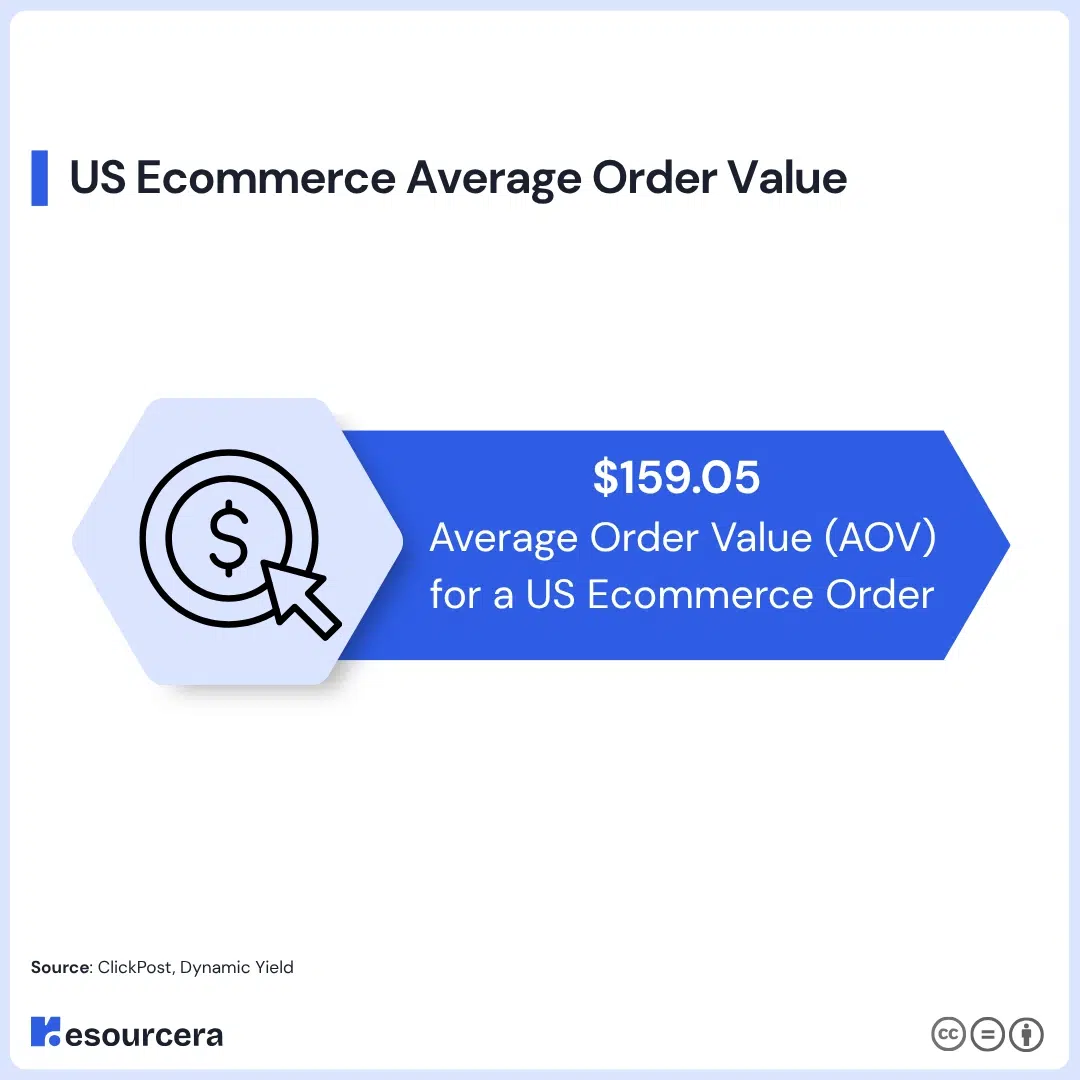
The average order value (AOV) for a US ecommerce order is around $159.05. This is one of the highest AOV figures in the world. The Americas region as a whole averaged $183 per order in October 2025, well ahead of Asia-Pacific at $135 and Europe at $128.
Desktop orders are larger than mobile orders. Global data shows desktop AOV at $192 and mobile AOV at $133. This means US stores that get more desktop traffic tend to see bigger baskets.
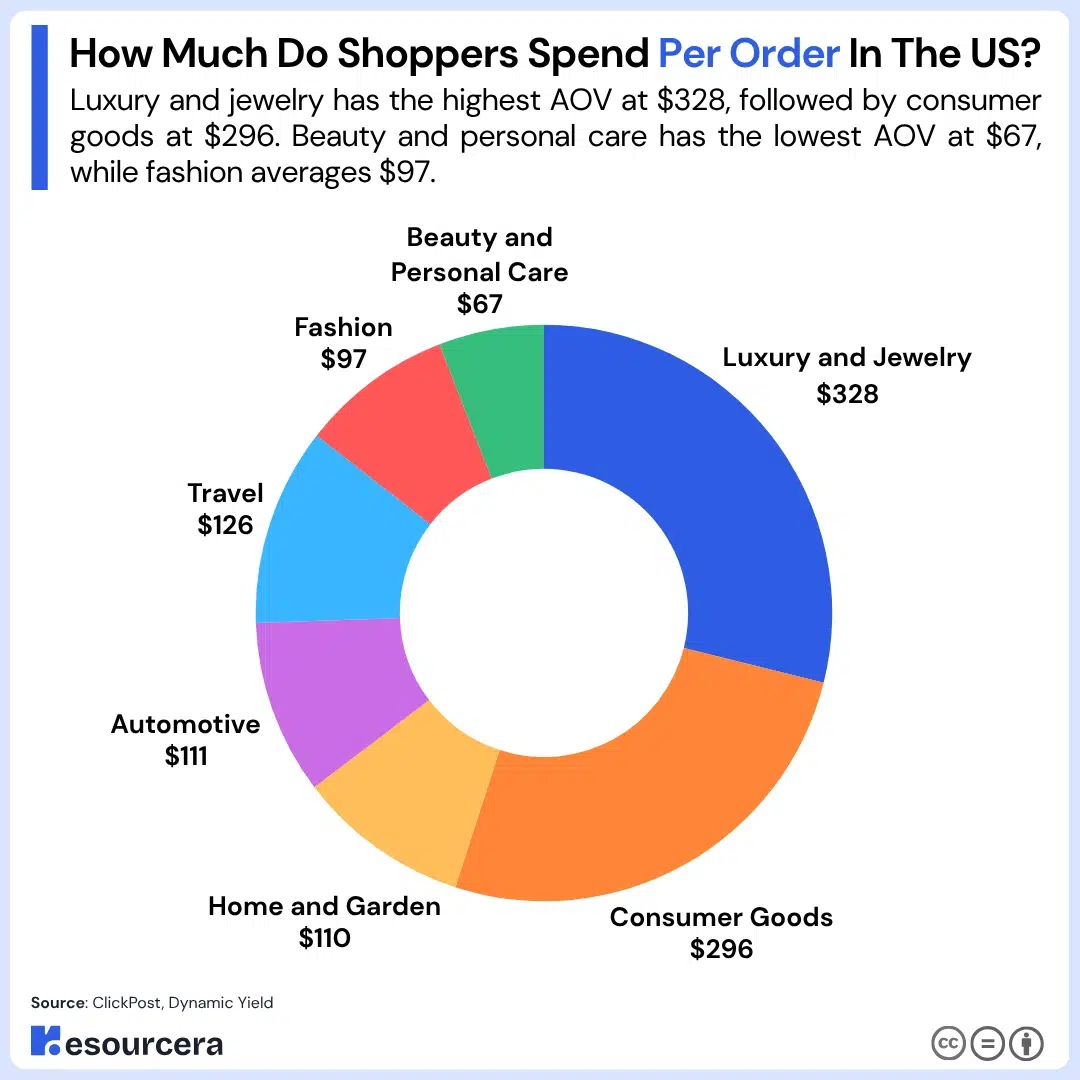
AOV also varies a lot by product category:
| Category | Average Order Value |
|---|---|
| Luxury and Jewelry | $328 |
| Consumer Goods | $296 |
| Home and Garden | $110 |
| Automotive | $111 |
| Travel | $126 |
| Fashion | $97 |
| Beauty and Personal Care | $67 |
Sources: ClickPost, Dynamic Yield, Ship To The Moon
How Much Of US Ecommerce Happens On Mobile?
44.6% of US ecommerce sales happen on a mobile phone. That works out to about $577.6 billion in US mobile shopping spend in 2025, up 2.41% on 2024.
Mobile share is even higher during peak shopping periods. On Thanksgiving Day 2025, mobile crossed 60% of US online sales for the first time. Cyber Monday 2025 saw mobile drive 57.5% of online sales, part of a record $14.25 billion single-day total.
Around 200 million US adults now shop on their phone. 92% of these mobile shoppers are under the age of 50. About 70% of mobile purchases happen inside a shopping app rather than a mobile browser.
Sources: Capital One Shopping, Adobe Analytics.
US Ecommerce Return Rates
Shoppers send back 19.3% of everything they buy online in the US, according to the National Retail Federation (NRF) and Happy Returns 2025 Retail Returns Landscape. That is far higher than the 8.72% return rate for in-store purchases.
Total US retail returns hit $849.9 billion in 2025, or 15.8% of all sales. Online returns alone are climbing every year, up from 17.6% in 2024 to 19.3% in 2025.
Clothing has the highest return rate. 26% of US shoppers returned clothing bought online in 2025. Shoes came next at 18% and accessories at 13%.
Return fraud costs stores billions. 9% of all returns in 2025 were fraudulent. To fight this, 85% of US retailers now use AI tools to spot fake return claims.
Free returns matter to shoppers. 82% of consumers say free returns are an important factor when they decide where to buy online, up from 76% in 2024.
Source: NRF and Happy Returns 2025 Retail Returns Landscape
AI Adoption Among US Ecommerce Stores
42% of Shopify merchants now use Shopify’s built-in AI tools, such as Sidekick for admin help and Magic for writing product content. This is one of the clearest signals of how fast AI has entered day-to-day store operations.
The volume of orders driven by AI is growing even faster. Orders sent to Shopify stores from AI search platforms like ChatGPT, Google Gemini, and Microsoft Copilot grew 15 times over between January and December 2025. In the first quarter of 2026, these AI-driven orders grew about 13 times year on year.
87% of retailers say AI has had a positive effect on their revenue. 94% say it has cut their operating costs.
Merchants using AI report clear business benefits over those who do not. Shopify’s November 2025 Merchant Survey found AI users are far more likely to validate business ideas through testing (11% versus 3%) and to run customer research (10% versus 3%).
Where merchants are not using AI yet, uncertainty is the main reason. 29% do not know what AI tools can do. 29% do not know where to start. 26% do not know which tool to pick.
Sources: Shopify Q4 2025 earnings call, Shopify Merchant Survey 2025.
Black Friday And Cyber Monday On US Stores
Shopify merchants worldwide sold $14.6 billion during Black Friday Cyber Monday (BFCM) 2025, a 27% rise on the year before. More than 81 million shoppers bought from a Shopify store during the four-day weekend. At the peak moment, Shopify merchants sold $5.1 million per minute.
Source: Shopify News
Cart Abandonment Rate For Ecommerce Stores In The USA
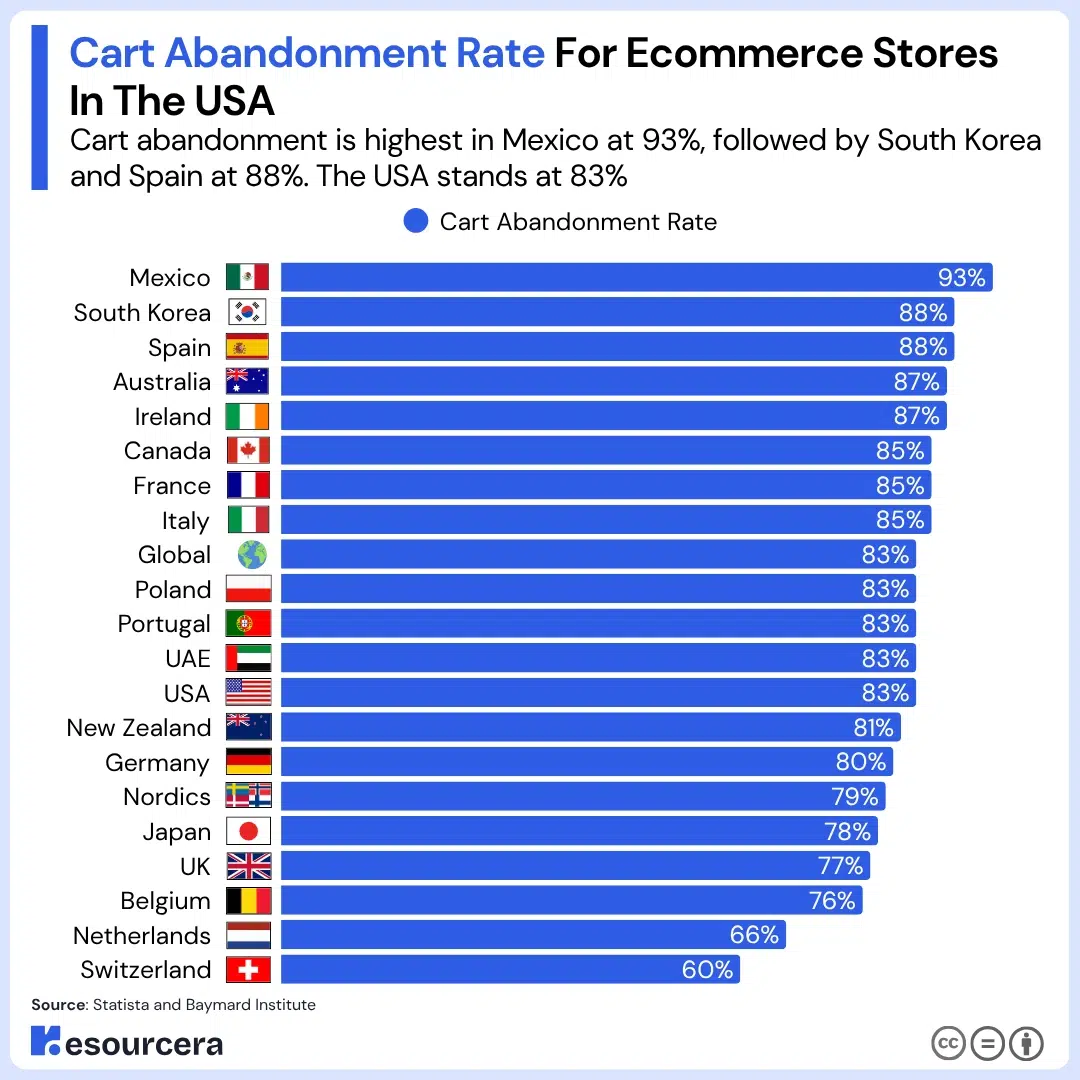
Ecommerce stores in the USA have a cart abandonment rate of 83% in 2026. That means 83 out of every 100 online shoppers who add an item to their cart leave without completing the purchase.
That is the same as the global average cart abandonment rate of 83%.
Shoppers in Canada, France, Italy, Australia, Ireland, Spain and South Korea all abandon more often while the UK, Germany, Japan, Belgium and the Netherlands all abandon their shopping carts less than the United States.
Here is a table showing the cart abandonment rate across countries:
| Country / Region | Cart Abandonment Rate |
|---|---|
| Mexico | 93% |
| South Korea | 88% |
| Spain | 88% |
| Australia | 87% |
| Ireland | 87% |
| Canada | 85% |
| France | 85% |
| Italy | 85% |
| Global | 83% |
| Poland | 83% |
| Portugal | 83% |
| UAE | 83% |
| USA | 83% |
| New Zealand | 81% |
| Germany | 80% |
| Nordics | 79% |
| Japan | 78% |
| UK | 77% |
| Belgium | 76% |
| Netherlands | 66% |
| Switzerland | 60% |
Sources: Statista.
Future Lookout For US Ecommerce Stores
The US store count has grown every year since 2020 and passed 13.6 million in 2026. The country holds more than half of the world’s ecommerce stores, and its lead over the rest of the top ten remains wide.
Store sales are at a record too, with $1.23 trillion in 2025 and $302.3 billion in the first quarter of 2026. Two shifts are worth watching from here. First, AI is starting to route orders to stores in a way that did not exist a year ago, with AI-driven orders on Shopify up 15 times in 2025. Second, mobile share has crossed 60% on peak days, so the phone screen is now the main storefront for many US shoppers.
We will update this page as new store count data is released.
Related Reads: E-commerce Stores in Germany

