


US ecommerce sales reached $630.8 billion in the first half of 2026, up by 10.9% from the same period a year ago. The first quarter contributed $301.2 billion, while the second quarter sales reached $329.5 billion. Both quarters crossed the $300 billion mark, something that had never happened outside a holiday quarter before 2026.
Q2 2026 sales grew 12.4% YoY, marking the fastest growth in five years and the first double-digit increase since the pandemic boom of 2021. It was also the biggest non-holiday quarter on record.
The core U.S. retail ecommerce sales figures in this post come from the US Census Bureau. So, what does this report add? We compare quarter-over-quarter and year-over-year growth, including detailed quarterly and annual growth tables, and share additional insights into the U.S. ecommerce market.
Every number on this page comes from one consistent Census release, so all the figures match each other. We update this page every quarter, as soon as the Census Bureau releases new data, and every figure the Bureau revises is listed in the revision log at the end.
Top Insights on US Ecommerce Sales Growth
- The US ecommerce sales now total $630.8 billion as of the first half of 2026, up by 10.9% from $568.9 billion a year ago.
- US ecommerce sales reached $329.5 billion in Q2 2026, growing 12.4% year over year. That is the first double-digit growth quarter since Q2 2021.
- On a seasonally adjusted basis, US ecommerce sales stand at $340.2 billion in Q2 2026, up 12.2% year over year and 3.8% from Q1 2026.
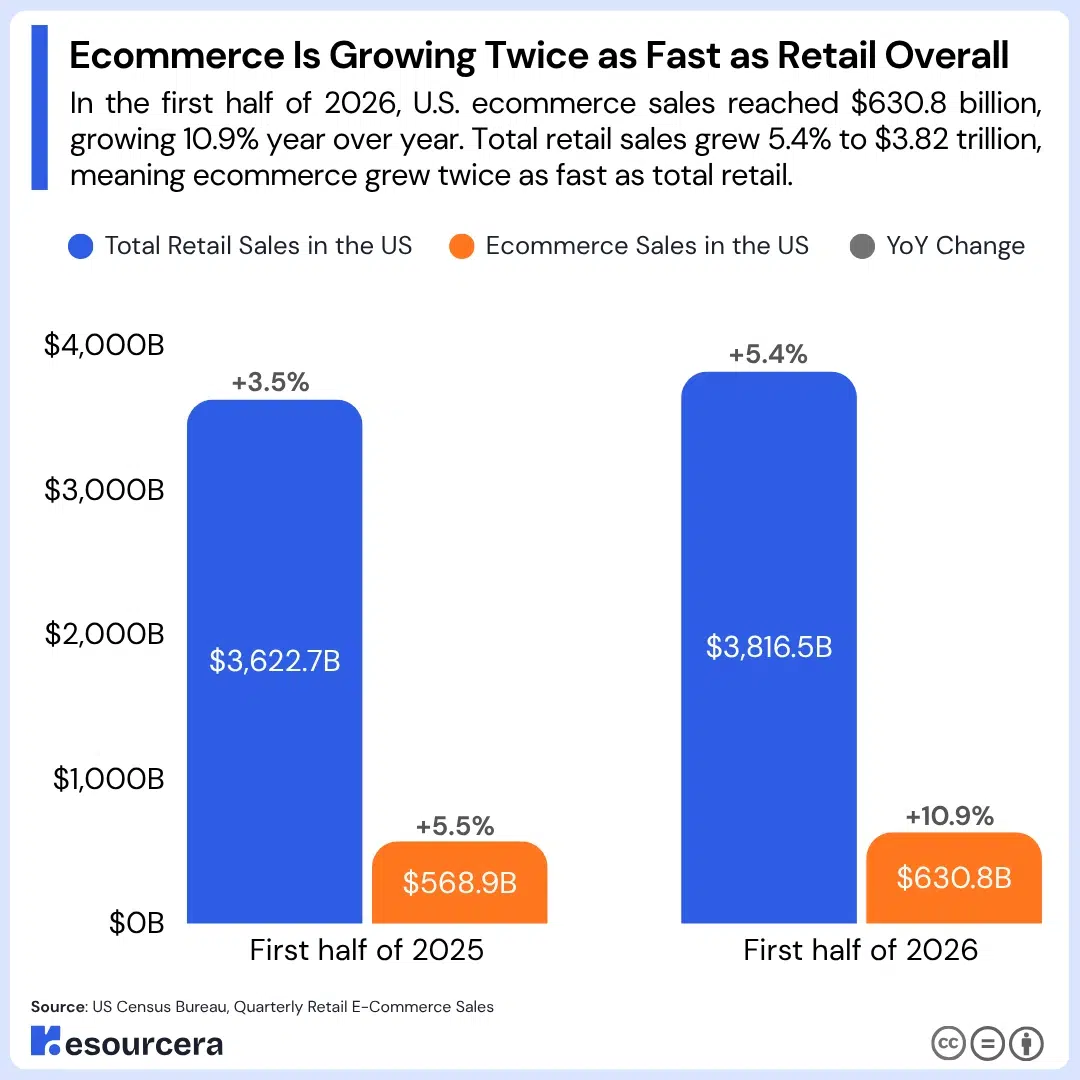
- Ecommerce sales in US grew about twice as fast as total retail sales in the first half of 2026, increasing by 10.9% year over year compared with a 5.4% increase in total retail sales.
- Total ecommerce sales for the year 2025 stood at $1.23 trillion, which is up by 5.4% from 2024.
- Ecommerce now accounts for 16.4% of total US retail sales, up from just 0.9% in 2000. In Q2 2026, the share stood at 16.4% (not adjusted) and 17.1% (seasonally adjusted).
- It is projected that ecommerce sales in 2026 will hit $1.35 trillion.
- Q4 2025 remains the biggest quarter ever for online shopping at $365.2 billion, thanks to the holiday season. Every year, the fourth quarter alone brings in close to 30% of the year’s ecommerce sales in the US.
US Ecommerce Sales in the First Half of 2026
US ecommerce sales reached $630.8 billion in the first six months of 2026, which is 10.9% higher than the $568.9 billion spent during the same period a year ago. The sales stood at $301.2 billion in Q1 and $329.5 billion in Q2 2026.
| Metric | Ecommerce Sales, H1 2026 | Growth (YoY) | Share of Total Retail |
|---|---|---|---|
| Not adjusted (actual sales) | $630.8 billion | +10.9% | 16.5% |
| Seasonally adjusted | $668.1 billion | +11.2% | 17.1% |
Source: US Census Bureau, Quarterly Retail E-Commerce Sales, release CB26-133 (18 August 2026). Q2 2026 preliminary, Q1 2026 revised. Earlier quarters as revised in that release. Sales in $ billions, rounded from $ millions. H1 = Q1 + Q2 in $ millions, rounded at display.
The not-adjusted number is what shoppers actually spent. The adjusted number smooths out seasonal patterns, like the post-holiday slowdown that hits every first quarter, so you can compare one quarter to the next fairly.
US Ecommerce Sales in Q2 2026
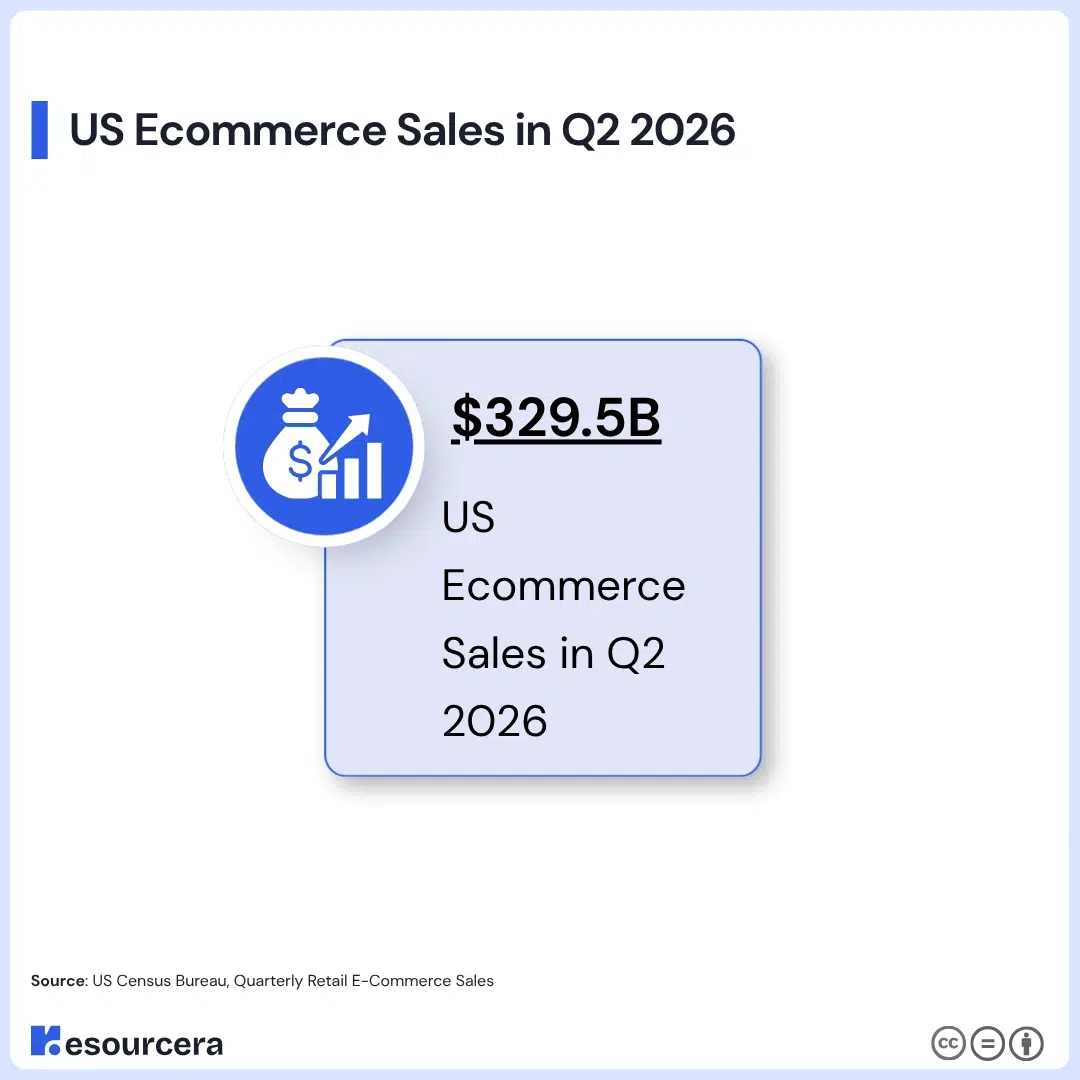
Ecommerce sales in the US reached $329.5 billion in the second quarter of 2026, up by 12.4% from $293.1 billion in Q2 2025. That is $36.4 billion more than a year earlier, the largest year-over-year jump for any quarter since 2021.
| Q2 2026 | Ecommerce Sales | Growth (YoY) | Growth (QoQ) | Share of Total Retail |
|---|---|---|---|---|
| Not adjusted (actual sales) | $329.5 billion | +12.4% | +9.4% | 16.4% |
| Seasonally adjusted | $340.2 billion | +12.2% | +3.8% | 17.1% |
Source: US Census Bureau, Quarterly Retail E-Commerce Sales, release CB26-133 (18 August 2026). Q2 2026 preliminary, Q1 2026 revised. Earlier quarters as revised in that release. Sales in $ billions, rounded from $ millions.
On the adjusted basis, sales grew 3.8% from Q1 2026, the fastest quarter-over-quarter growth since Q1 2023. And it followed a 3.1% rise in Q1. Two back-to-back quarters above 3% had not happened since the pandemic period.
Note: The Q2 2026 figure is preliminary and will be revised in the November release; the revision log below shows how large these revisions typically are.
Ecommerce Is Growing Twice as Fast as Retail Overall
| Period | Total Retail Sales in the United States | YoY Change | Ecommerce Sales in the United States | YoY Change |
|---|---|---|---|---|
| First half of 2025 | $3,622.7 billion | +3.5% | $568.9 billion | +5.5% |
| First half of 2026 | $3,816.5 billion | +5.4% | $630.8 billion | +10.9% |
Source: US Census Bureau, Quarterly Retail E-Commerce Sales, release CB26-133 (18 August 2026). Q2 2026 preliminary, Q1 2026 revised. Earlier quarters as revised in that release. Sales in $ billions, rounded from $ millions. Not adjusted.
Total US retail sales grew by 5.4% year over year in the first half of 2026. On the other hand, ecommerce-only sales grew 10.9% over the same period. This clearly highlights that online sales grew about twice as faster than total retail sales. In Q2 alone, the gap was, 12.4% for ecommerce against 6.6% for total retail.
That gap matters. Through 2025, ecommerce was still outgrowing total retail, but only by a couple of percentage points each quarter. In 2026, the gap has widened to five or six points, the largest since 2023, and it is the reason the online share of retail keeps climbing.
US Ecommerce Sales by Year (2000 to 2026)
In 2000, Americans spent $27.2 billion online, which was less than 1% of retail. In 2025, they spent $1.23 trillion, more than 45 times as much.
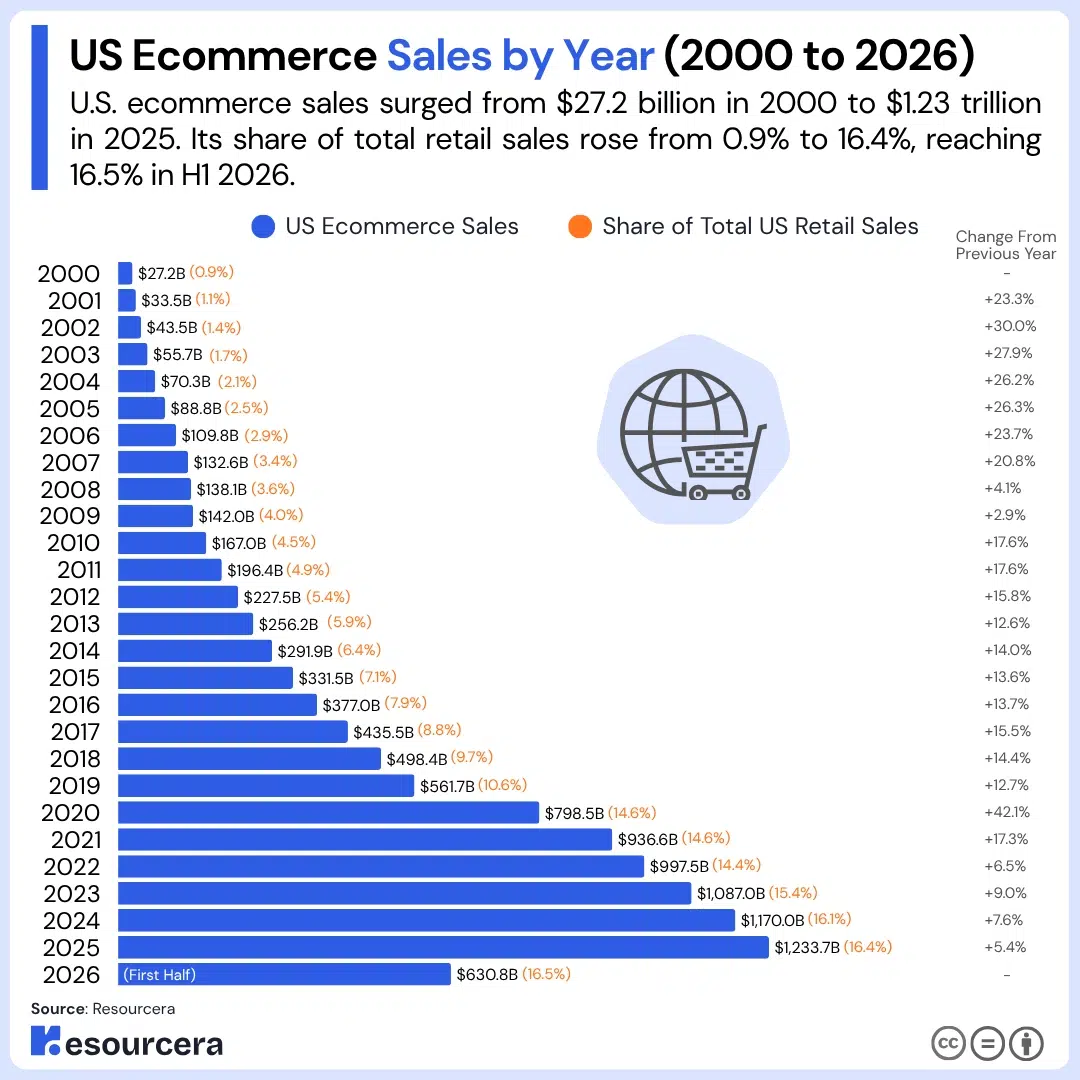
Now, as of the first half of 2026, ecommerce sales account for 16.5% of the total retail sales in the country.
| Year | US Ecommerce Sales | Change From Previous Year | Share of Total US Retail Sales |
|---|---|---|---|
| 2000 | $27.2 billion | N/A | 0.9% |
| 2001 | $33.5 billion | +23.3% | 1.1% |
| 2002 | $43.5 billion | +30.0% | 1.4% |
| 2003 | $55.7 billion | +27.9% | 1.7% |
| 2004 | $70.3 billion | +26.2% | 2.1% |
| 2005 | $88.8 billion | +26.3% | 2.5% |
| 2006 | $109.8 billion | +23.7% | 2.9% |
| 2007 | $132.6 billion | +20.8% | 3.4% |
| 2008 | $138.1 billion | +4.1% | 3.6% |
| 2009 | $142.0 billion | +2.9% | 4.0% |
| 2010 | $167.0 billion | +17.6% | 4.5% |
| 2011 | $196.4 billion | +17.6% | 4.9% |
| 2012 | $227.5 billion | +15.8% | 5.4% |
| 2013 | $256.2 billion | +12.6% | 5.9% |
| 2014 | $291.9 billion | +14.0% | 6.4% |
| 2015 | $331.5 billion | +13.6% | 7.1% |
| 2016 | $377.0 billion | +13.7% | 7.9% |
| 2017 | $435.5 billion | +15.5% | 8.8% |
| 2018 | $498.4 billion | +14.4% | 9.7% |
| 2019 | $561.7 billion | +12.7% | 10.6% |
| 2020 | $798.5 billion | +42.1% | 14.6% |
| 2021 | $936.6 billion | +17.3% | 14.6% |
| 2022 | $997.5 billion | +6.5% | 14.4% |
| 2023 | $1,087.0 billion | +9.0% | 15.4% |
| 2024 | $1,170.0 billion | +7.6% | 16.1% |
| 2025 | $1,233.7 billion | +5.4% | 16.4% |
| 2026 (First Half) | $630.8 billion | – | 16.5% |
Source: US Census Bureau, Quarterly Retail E-Commerce Sales, release CB26-133 (18 August 2026). Q2 2026 preliminary, Q1 2026 revised. Earlier quarters as revised in that release. Sales in $ billions, rounded from $ millions. Annual = sum of four not-adjusted quarters. The August 2026 release did not revise any annual figure from 2000 to 2025.
Much of this acceleration is also being supported by AI-powered personalization, product recommendations, dynamic pricing, and automation. Check out our latest AI in ecommerce statistics to see how retailers are using AI to drive online sales growth.
Resourcera’s observations from the above data
- 2020 was different from every other year. Online sales grew by 42.1% as the COVID-19 pandemic led more people to shop online, far faster than in a typical year.
- Sales crossed $1 trillion for the first time in 2023. 2022 came close at $997.5 billion, but 2023 was the first full year above the trillion-dollar line.
- The 5% to 9% annual growth of the past few years looks slow next to the double-digit years before the pandemic. But the base is far bigger now. The $63.7 billion added in 2025 alone is more than the entire US ecommerce market of 2003.
- Sales have more than doubled since before the pandemic. 2025 sales were 2.2 times the 2019 total.
- If the second half of 2026 simply repeats the 10.9% growth of the first half, 2026 will finish close to $1.37 trillion. The $1.35 trillion projection below assumes some cooling.
Not Adjusted Quarterly US Ecommerce Sales (2018 to 2026)
On a not adjusted basis, The US ecommerce sales reached $329.5 billion in Q2 2026, the highest figure ever recorded outside a holiday quarter. Q1 2026, now revised to $301.2 billion, marked the first time a first-quarter total crossed the $300 billion mark.
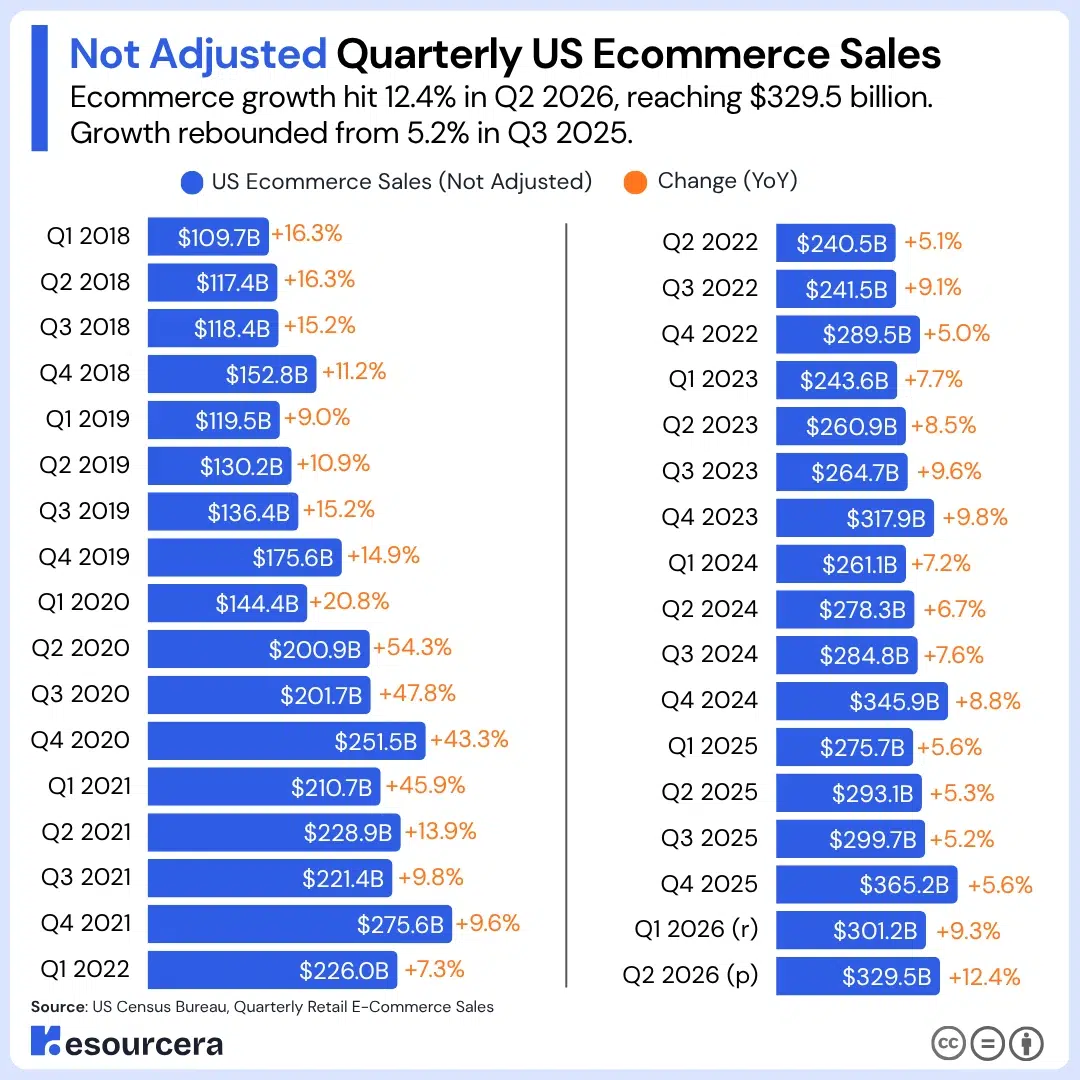
The highest quarterly ecommerce sales on record still belong to Q4 2025, when online sales reached $365.2 billion and ecommerce accounted for 18.3% of all US retail sales, the highest share ever recorded, thanks to the holiday season.
| Quarter | US Ecommerce Sales (Not Adjusted) | Change (YoY) | Share of Total US Retail Sales |
|---|---|---|---|
| Q1 2018 | $109.7 billion | +16.3% | 9.2% |
| Q2 2018 | $117.4 billion | +16.3% | 9.0% |
| Q3 2018 | $118.4 billion | +15.2% | 9.2% |
| Q4 2018 | $152.8 billion | +11.2% | 11.2% |
| Q1 2019 | $119.5 billion | +9.0% | 9.9% |
| Q2 2019 | $130.2 billion | +10.9% | 9.7% |
| Q3 2019 | $136.4 billion | +15.2% | 10.2% |
| Q4 2019 | $175.6 billion | +14.9% | 12.4% |
| Q1 2020 | $144.4 billion | +20.8% | 11.7% |
| Q2 2020 | $200.9 billion | +54.3% | 15.5% |
| Q3 2020 | $201.7 billion | +47.8% | 14.2% |
| Q4 2020 | $251.5 billion | +43.3% | 16.6% |
| Q1 2021 | $210.7 billion | +45.9% | 14.7% |
| Q2 2021 | $228.9 billion | +13.9% | 13.9% |
| Q3 2021 | $221.4 billion | +9.8% | 13.8% |
| Q4 2021 | $275.6 billion | +9.6% | 16.0% |
| Q1 2022 | $226.0 billion | +7.3% | 14.2% |
| Q2 2022 | $240.5 billion | +5.1% | 13.5% |
| Q3 2022 | $241.5 billion | +9.1% | 13.8% |
| Q4 2022 | $289.5 billion | +5.0% | 16.0% |
| Q1 2023 | $243.6 billion | +7.7% | 14.8% |
| Q2 2023 | $260.9 billion | +8.5% | 14.6% |
| Q3 2023 | $264.7 billion | +9.6% | 14.8% |
| Q4 2023 | $317.9 billion | +9.8% | 17.1% |
| Q1 2024 | $261.1 billion | +7.2% | 15.5% |
| Q2 2024 | $278.3 billion | +6.7% | 15.3% |
| Q3 2024 | $284.8 billion | +7.6% | 15.6% |
| Q4 2024 | $345.9 billion | +8.8% | 17.8% |
| Q1 2025 | $275.7 billion | +5.6% | 15.9% |
| Q2 2025 | $293.1 billion | +5.3% | 15.5% |
| Q3 2025 | $299.7 billion | +5.2% | 15.8% |
| Q4 2025 | $365.2 billion | +5.6% | 18.3% |
| Q1 2026 (r) | $301.2 billion | +9.3% | 16.7% |
| Q2 2026 (p) | $329.5 billion | +12.4% | 16.4% |
Source: US Census Bureau, Quarterly Retail E-Commerce Sales, release CB26-133 (18 August 2026). Q2 2026 preliminary, Q1 2026 revised. Earlier quarters as revised in that release. Sales in $ billions, rounded from $ millions. (p) preliminary, (r) revised, as labelled by the Census Bureau.
Seasonally Adjusted US Ecommerce Quarterly Sales (2020 to 2026)
Seasonally adjusted figures are the same sales data with the calendar effects removed. The Census Bureau smooths out predictable seasonal swings, like the Q4 holiday surge, differences in the number of trading days, and moving holidays such as Easter. Prices are not adjusted, so inflation is still part of the numbers.
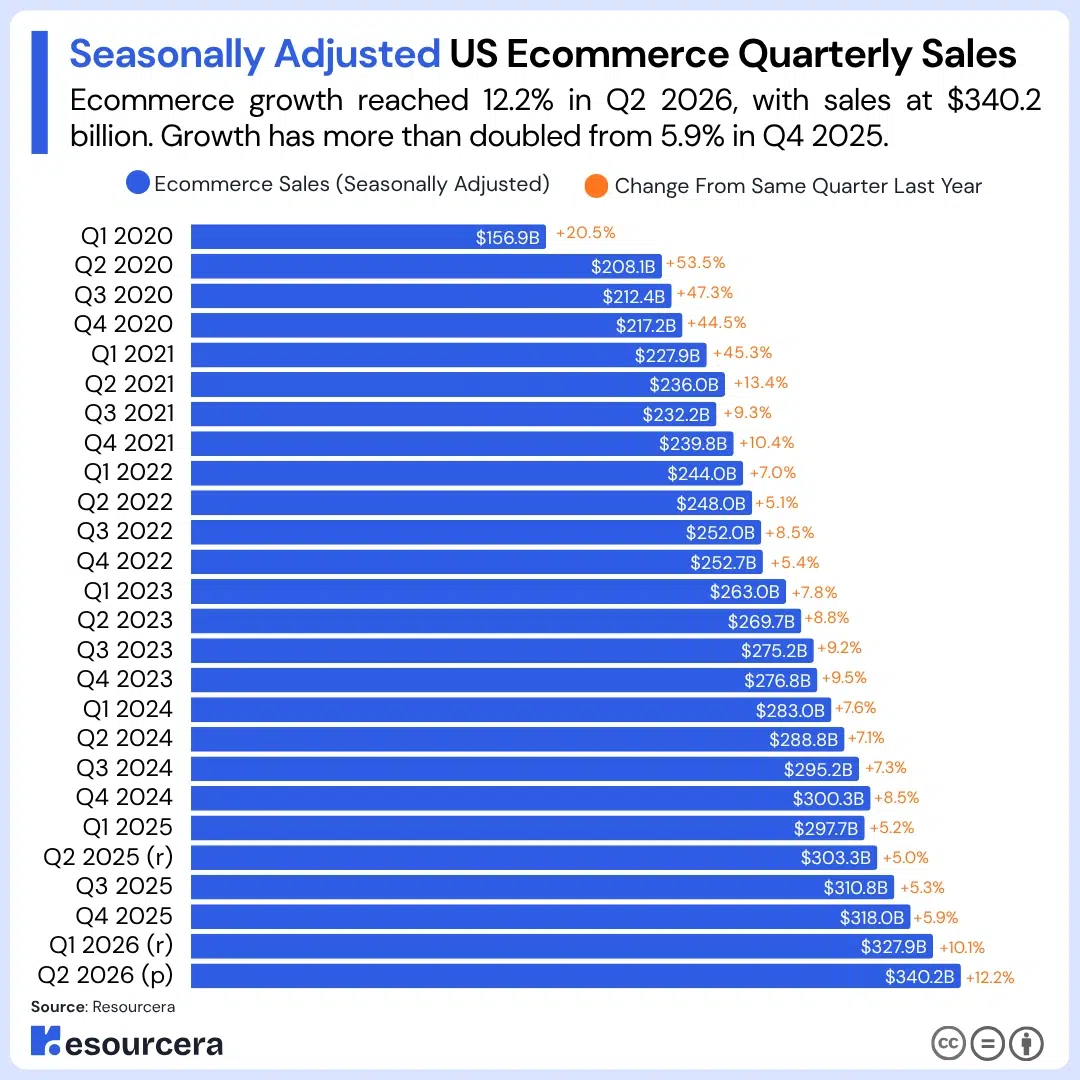
So why use the adjusted series at all? Comparison. It is the only fair way to check whether the market grew from one quarter to the next, because it strips out the holiday spike that would otherwise make every Q4 look like a boom and every Q1 look like a crash. One thing to know is that the adjustment factors are re-estimated from time to time, so the Bureau occasionally revises older adjusted quarters even when the actual sales do not change. Q2 2025 was revised in the August 2026 release.
| Quarter | Ecommerce Sales (Seasonally Adjusted) | Change From Same Quarter Last Year | Change From Prior Quarter | Share of Total Retail |
|---|---|---|---|---|
| Q1 2020 | $156.9 billion | +20.5% | +4.4% | 11.9% |
| Q2 2020 | $208.1 billion | +53.5% | +32.6% | 16.3% |
| Q3 2020 | $212.4 billion | +47.3% | +2.0% | 14.9% |
| Q4 2020 | $217.2 billion | +44.5% | +2.3% | 15.0% |
| Q1 2021 | $227.9 billion | +45.3% | +5.0% | 14.9% |
| Q2 2021 | $236.0 billion | +13.4% | +3.5% | 14.6% |
| Q3 2021 | $232.2 billion | +9.3% | -1.6% | 14.5% |
| Q4 2021 | $239.8 billion | +10.4% | +3.3% | 14.6% |
| Q1 2022 | $244.0 billion | +7.0% | +1.7% | 14.4% |
| Q2 2022 | $248.0 billion | +5.1% | +1.6% | 14.2% |
| Q3 2022 | $252.0 billion | +8.5% | +1.6% | 14.5% |
| Q4 2022 | $252.7 billion | +5.4% | +0.3% | 14.6% |
| Q1 2023 | $263.0 billion | +7.8% | +4.1% | 15.0% |
| Q2 2023 | $269.7 billion | +8.8% | +2.6% | 15.3% |
| Q3 2023 | $275.2 billion | +9.2% | +2.0% | 15.4% |
| Q4 2023 | $276.8 billion | +9.5% | +0.6% | 15.5% |
| Q1 2024 | $283.0 billion | +7.6% | +2.3% | 15.9% |
| Q2 2024 | $288.8 billion | +7.1% | +2.0% | 16.1% |
| Q3 2024 | $295.2 billion | +7.3% | +2.2% | 16.2% |
| Q4 2024 | $300.3 billion | +8.5% | +1.7% | 16.2% |
| Q1 2025 | $297.7 billion | +5.2% | -0.9% | 16.0% |
| Q2 2025 (r) | $303.3 billion | +5.0% | +1.9% | 16.3% |
| Q3 2025 | $310.8 billion | +5.3% | +2.5% | 16.4% |
| Q4 2025 | $318.0 billion | +5.9% | +2.3% | 16.7% |
| Q1 2026 (r) | $327.9 billion | +10.1% | +3.1% | 17.0% |
| Q2 2026 (p) | $340.2 billion | +12.2% | +3.8% | 17.1% |
Source: US Census Bureau, Quarterly Retail E-Commerce Sales, release CB26-133 (18 August 2026). Q2 2026 preliminary, Q1 2026 revised. Earlier quarters as revised in that release. Sales in $ billions, rounded from $ millions.
The adjusted series tells a quieter but clearer story. Once the pandemic surge of 2020 and 2021 settled, online sales fell into a steady rhythm of roughly 2% growth per quarter. In the last five years, there have been only two quarterly declines, a 1.6% dip in Q3 2021 as physical stores reopened and a 0.9% dip in Q1 2025. Both were recovered within a quarter.
2026 stands out on this measure. Q1 rose 3.1% from Q4 2025, and Q2 rose a further 3.8%, the two fastest quarter-over-quarter gains since Q1 2023. In other words, the pickup in the year-over-year numbers is real momentum, not just a base effect from a weak 2025.
The Holiday Quarter Does the Heavy Lifting
The fourth quarter, which includes Black Friday, Cyber Monday, and the December holiday season, consistently generates nearly 30% of all annual US ecommerce sales.
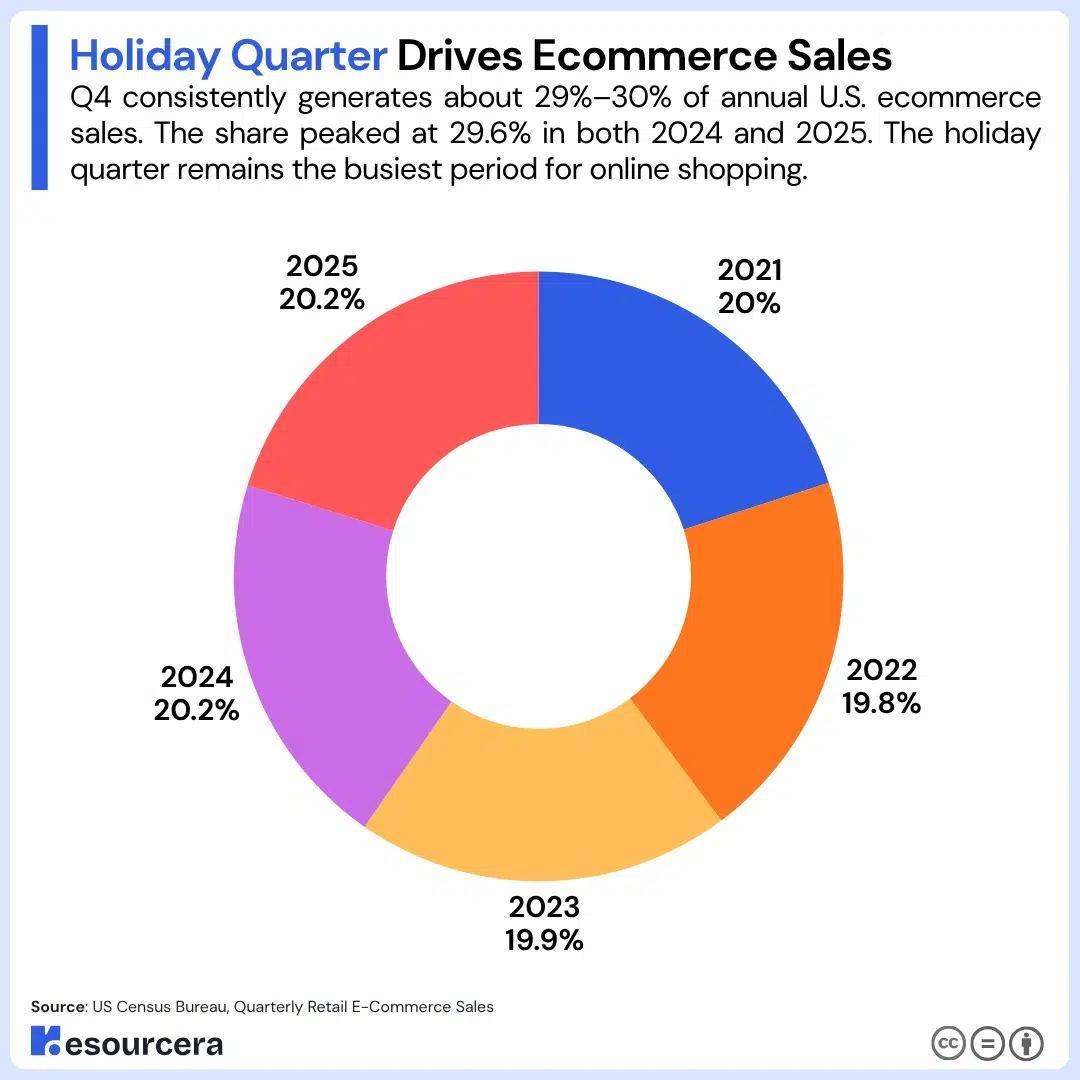
This means that close to one out of every three dollars Americans spend online each year is spent during the final three months of the year. The holiday shopping season remains the busiest and most important period for ecommerce retailers.
| Year | Share of Annual US Ecommerce Sales Generated in Q4 of That Year |
|---|---|
| 2021 | 29.4% |
| 2022 | 29.0% |
| 2023 | 29.2% |
| 2024 | 29.6% |
| 2025 | 29.6% |
Source: US Census Bureau, Quarterly Retail E-Commerce Sales, release CB26-133 (18 August 2026). Q2 2026 preliminary, Q1 2026 revised. Earlier quarters as revised in that release. Sales in $ billions, rounded from $ millions. Q4 share = Q4 not-adjusted sales divided by annual not-adjusted sales.
Some Interesting Findings From US Ecommerce Sales Data Over the Years
Some numbers tell the story of US ecommerce better than any paragraph could. Every stat below is computed from the Census Bureau data covered in this post.
Q2 2026 delivered the first double-digit growth quarter in five years
The last time online sales grew at least 10% year over year was Q2 2021, at the tail end of the pandemic boom, when they rose 13.9%. For the next 19 quarters, growth stayed between 5% and 10%, with Q4 2023 (9.8%) and Q1 2026 (9.3%) coming the closest. Q2 2026 finally broke the pattern at 12.4%.
Online sales have fallen year over year in only three quarters in 26 years
Across more than a quarter century of data, ecommerce sales dropped below the prior year just three times: Q4 2008, Q1 2009, and Q2 2009, during the depths of the financial crisis. The worst of those was a 6.3% decline. Nothing since then, not even the reopening of physical stores after the pandemic, has pushed online sales into an annual decline.
Ecommerce has outgrown total retail for 14 straight quarters
The last time total retail sales grew faster than online sales was Q4 2022, when stores were still riding the post-pandemic return to in-person shopping. From Q1 2023 through Q2 2026, ecommerce has beaten total retail growth in every single quarter, which is why its share of retail keeps setting records.
It took 19 years for US ecommerce sales to reach $500 billion, then only 4 years to pass $1 trillion
Annual online sales crossed $500 billion for the first time in 2019, nearly two decades after the Census Bureau started measuring in 1999. The second half trillion took just four years, with sales passing $1 trillion in 2023. Scale compounds.
Q2 2020 saw the biggest quarterly jump on record: +54.3%
When the pandemic hit, online sales exploded. Q2 2020 grew 54.3% over the previous year, the largest jump since the early 2000s when the market was a fraction of its current size. In dollar terms, shoppers spent about $71 billion more online that quarter than a year earlier.
Q4 2025 was the first quarter where online took more than 18% of retail spending
The 2025 holiday quarter set two records at once, the highest quarterly sales ever at $365.2 billion, and the highest ecommerce share of retail ever at 18.3%. No previous quarter had crossed the 18% line.
US online sales have more than doubled since 2019
Annual ecommerce sales went from $561.7 billion in 2019 to $1.23 trillion in 2025. That is a 2.2x increase in six years. Total retail grew over the same stretch too, but nowhere near as fast, which is why the online share of retail climbed from 10.6% to 16.4%.
The holiday quarter delivers close to 30% of the year’s online sales, every year
For five straight years, from 2021 through 2025, the fourth quarter has accounted for between 29.0% and 29.6% of annual ecommerce sales. The number barely moves. Whatever else changes in the market, Americans still do their biggest online spending between October and December.
Source: Census.gov
Why Some Reports Show a Higher Ecommerce Share
You may see other sources claim that ecommerce makes up 20% or more of US retail. The gap comes down to definitions, not a disagreement about the actual sales.
The Census Bureau’s share, 16.4% in Q2 2026, divides online sales by all retail sales, including categories where almost nobody buys online, like gasoline and car dealership sales. Some analysts strip those categories out before calculating the share, since they want to measure how much of “shoppable” retail happens online. Remove cars and gas from the total retail figure, and the share climbs several points.
Neither approach is wrong. They just answer slightly different questions. This post sticks with the official Census figures throughout, so every number here comes from one consistent source.
Separately, some market research firms publish larger dollar figures for the “US ecommerce market” because they include things the Census retail data does not, such as travel bookings and event tickets. That is why you might see a bigger trillion-dollar number elsewhere for the same year.
What Counts as Ecommerce in This Report
A sale counts as ecommerce when the buyer places the order, or negotiates the price and terms, over the internet, a mobile device, email, or another online system. Payment does not have to happen online. So a buy-online-pickup-in-store order counts, and so does an order placed through an app. Since the April 2025 benchmark, the estimates cover businesses with paid employees only.
Two versions of the data are published each quarter:
Not adjusted: the raw sales that actually happened. Best for annual totals, half-year comparisons, and for seeing real seasonal patterns like the Q4 spike. This is the headline series on this page.
Seasonally adjusted: sales with seasonal swings, holidays, and trading-day differences smoothed out. Best for comparing one quarter to the next.
How to Read the Numbers on This Page
Every figure on this page comes from a single Census Bureau release, named in the note under each table. That matters because the Bureau revises its estimates:
The newest quarter is always a preliminary estimate, marked (p). In the following release, it is replaced by a revised estimate, marked (r). In August 2026, for example, Q1 2026 not-adjusted sales moved from $302.3 billion to $301.2 billion.
Once a year, usually with the first-quarter release in May, the Bureau benchmarks the whole series to its annual survey and re-estimates the seasonal factors. Several years of figures can shift by small amounts.
Growth rates, shares, and half-year totals on this page are calculated from the Bureau’s figures in millions of dollars and rounded only for display. If you recompute them from the rounded billions in the tables, you may be off by 0.1 of a point. That is rounding, not a data difference.
If a number you saved from an earlier visit no longer matches, check the revision log below. We keep a copy of every release we have published from.
When Is This Data Updated
We update this post about seven weeks after each quarter ends, in mid-February, mid-May, mid-August, and mid-November. The Q2 2026 figures in this report are from the Census Bureau release of August 18, 2026.
The next release, covering Q3 2026 and revising Q2 2026, is expected in mid-November 2026. You can bookmark this page to stay updated every time new data comes out.
What to Expect for the Rest of 2026 and Beyond
Ecommerce grew 10.9% in the first half of 2026. If the second half grows anywhere between the 5% pace of 2025 and the near-11% pace of the first half, full-year sales would land between $1.33 trillion and $1.37 trillion, with $1.35 trillion a reasonable middle figure. The market is projected to keep growing at a CAGR of 8.99% to 2030 and reach $1.90 trillion.
| Year | Projected US Ecommerce Sales |
|---|---|
| 2026 | $1.35 trillion |
| 2027* | $1.47 trillion |
| 2028* | $1.60 trillion |
| 2029* | $1.75 trillion |
| 2030* | $1.90 trillion |
Related Read: Total Number of Ecommerce Stores in the USA
Revision Log for Reference
These are the figures the Census Bureau revised between the release we previously published from (May 18, 2026) and the current release (August 18, 2026). All other figures on this page stayed the same.
| Series | Quarter | Metric | Previously published | Now | Reason |
|---|---|---|---|---|---|
| Not adjusted | Q1 2026 | Ecommerce sales | $302.3 billion | $301.2 billion | Preliminary to revised |
| Not adjusted | Q1 2026 | Ecommerce growth (YoY) | +9.7% | +9.3% | Follows from revised sales |
| Not adjusted | Q1 2026 | Share of total retail | 16.8% | 16.7% | Follows from revised sales |
| Seasonally adjusted | Q1 2026 | Ecommerce sales | $326.7 billion | $327.9 billion | Preliminary to revised |
| Seasonally adjusted | Q1 2026 | Ecommerce growth (YoY) | +9.8% | +10.1% | Follows from revised sales |
| Seasonally adjusted | Q1 2026 | Growth from Q4 2025 | +2.7% | +3.1% | Follows from revised sales |
| Seasonally adjusted | Q1 2026 | Share of total retail | 16.9% | 17.0% | Follows from revised sales |
| Seasonally adjusted | Q2 2025 | Ecommerce sales | $304.5 billion | $303.3 billion | Seasonal factor revision |
| Seasonally adjusted | Q2 2025 | Ecommerce growth (YoY) | +5.4% | +5.0% | Follows from revised sales |
Previous figures: Census release of May 18, 2026. Current figures: Census release CB26-133, August 18, 2026.

