
Global corporate AI investment reached $581.69 billion in 2025, more than double the year before. Generative AI absorbed $170.87 billion of the private funding within that total, close to half of every private dollar going into artificial intelligence.
Adoption has moved just as fast. 88% of organizations now use AI in at least one business function and 79% use generative AI specifically. Only 39% report any profit impact, and most of those put it under 5% of earnings.
That is the shape of generative AI in 2026. Near-universal use, record spending, and returns that are real but still narrow.
This article covers the market size and forecasts through 2032. It breaks down adoption by country, generation, and industry. It also looks at investment and revenue, productivity results, the effect on jobs, and where trust and risk stand today.
Read on to get full insights on Generative AI Statistics.
Key Highlights of Generative AI Statistics (2026)
- The global generative AI market is worth $394.66 billion in 2026 and is projected to reach $804.33 billion by 2032.
- Generative AI reached 53% population-level adoption within three years of launch, faster than the personal computer or the internet.
- 88% of organizations use AI in at least one business function, up from 78% a year earlier.
- 79% of organizations use generative AI specifically, up from 71% the year before.
- Global private investment in generative AI hit $170.87 billion in 2025, more than triple the previous year.
- The United States accounted for $163.64 billion of that total, or 95.8% of global generative AI private funding.
- Only 39% of organizations report any profit impact from AI, and most say it is under 5% of earnings.
- 62% of organizations are experimenting with AI agents, but just 23% are scaling one anywhere in the business.
- One-third of organizations expect AI to shrink their workforce over the coming year.
- Employment for software developers aged 22 to 25 has fallen close to 20% from its 2022 peak.
- US consumers gained an estimated $172 billion in value from generative AI in the past year, up from $112 billion.
- ChatGPT holds 40.52% of all generative AI app downloads and draws 5.6 billion monthly web visits.
Generative AI Market Size and Growth
The global generative AI market is valued at $394.66 billion in 2026 and is forecast to reach $804.33 billion by 2032. That works out to a compound annual growth rate of 12.60%, meaning the market roughly doubles in six years.
The growth rate looks modest next to the triple-digit numbers reported in 2023 and 2024. The base has changed, not the momentum. With the market measured in hundreds of billions, the same dollar gains now produce far smaller percentages.
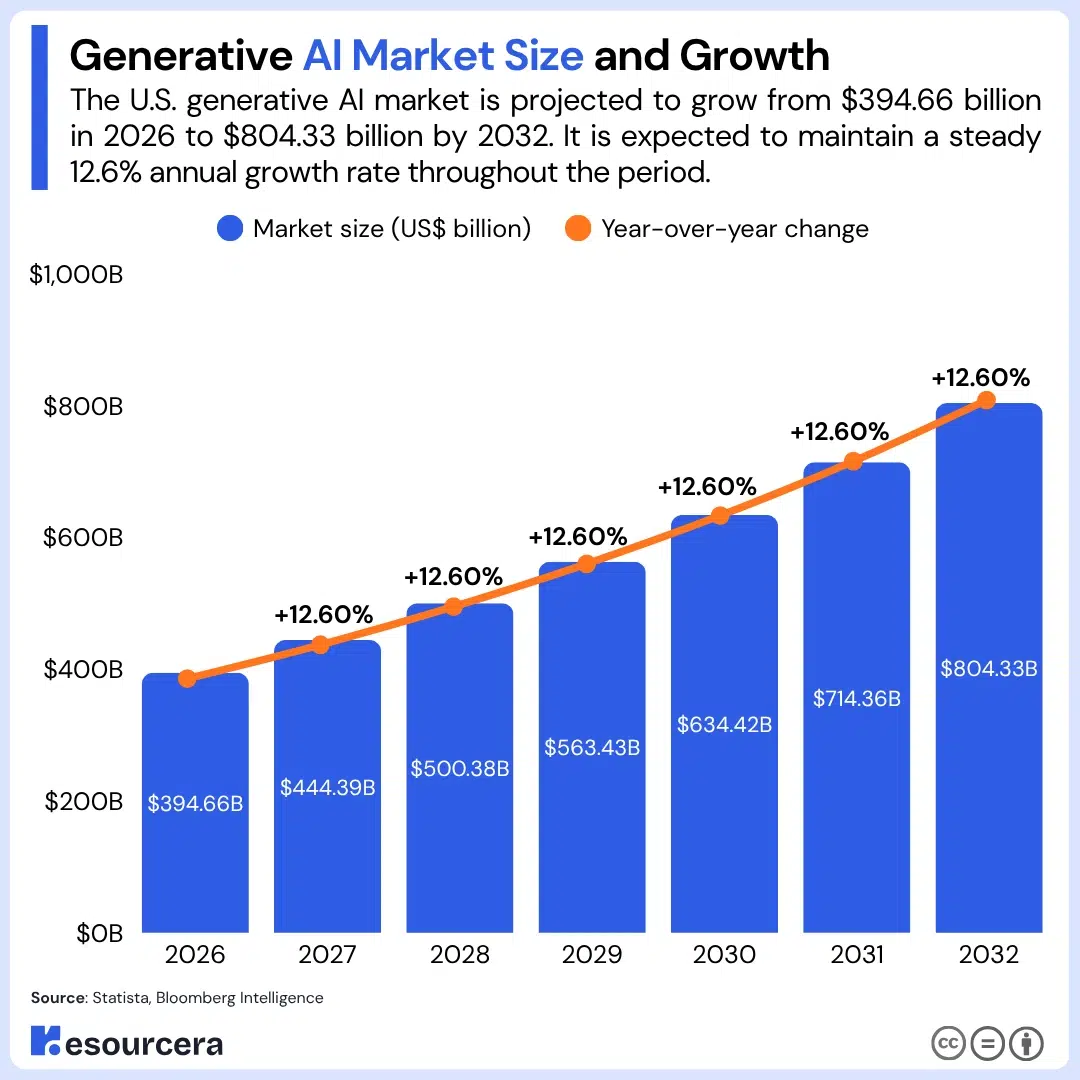
The table below shows the projected size of the global generative AI market for every year from 2026 through 2032.
| Year | Market size (US$ billion) | Year-over-year change |
|---|---|---|
| 2026 | 394.66 | Baseline |
| 2027 | 444.39 | +12.60% |
| 2028 | 500.38 | +12.60% |
| 2029 | 563.43 | +12.60% |
| 2030 | 634.42 | +12.60% |
| 2031 | 714.36 | +12.60% |
| 2032 | 804.33 | +12.60% |
Across the full period, the market grows 2.04 times and adds $409.67 billion, more than the entire market is worth today.
Generative AI within the wider AI market
Generative AI is the fastest-growing segment of artificial intelligence but not the largest by total value. Machine learning still accounts for more dollars.
The broader global AI market was valued at roughly $255 billion in 2025 and is expected to pass $1.2 trillion by 2030. Against that, generative AI represents a growing share of a much larger base.
Enterprise spending gives another read on scale. Global spending on generative AI was projected to reach around $644 billion in 2025, a 76.4% increase over the previous year.
Spending counts what buyers put into hardware, services, and software in a single year, while market size measures the value of the generative AI segment itself.
(Sources: Statista, Bloomberg Intelligence, The Insight Partners, Mordor Intelligence, Gartner)
Generative AI Adoption Among Users Worldwide
Generative AI reached roughly 53% population-level adoption within three years of its mass-market launch. No consumer technology has spread that quickly, including the personal computer, the internet, and the smartphone.
The global user base is still expanding. Total users of AI tools are projected to grow by 826.2 million between 2025 and 2031, reaching roughly 1.2 billion people.
Generative AI adoption rate by country
Adoption tracks closely with income per person, though several countries sit far above what their income alone would predict.
The table below ranks the top 30 economies by adoption rate in the second half of 2025, with the first-half figure, the change, and the movement in rank.
| Country | H1 2025 | H2 2025 | Change |
|---|---|---|---|
| United Arab Emirates | 59.40% | 64.00% | +4.60 pp |
| Singapore | 58.60% | 60.90% | +2.30 pp |
| Norway | 45.30% | 46.40% | +1.10 pp |
| Ireland | 41.70% | 44.60% | +2.90 pp |
| France | 40.90% | 44.00% | +3.10 pp |
| Spain | 39.70% | 41.80% | +2.10 pp |
| New Zealand | 37.60% | 40.50% | +2.90 pp |
| United Kingdom | 36.40% | 38.90% | +2.50 pp |
| Netherlands | 36.30% | 38.90% | +2.60 pp |
| Qatar | 35.70% | 38.30% | +2.60 pp |
| Australia | 34.50% | 36.90% | +2.40 pp |
| Israel | 33.90% | 36.10% | +2.20 pp |
| Belgium | 33.50% | 36.00% | +2.50 pp |
| Canada | 33.50% | 35.00% | +1.50 pp |
| Switzerland | 32.40% | 34.80% | +2.40 pp |
| Sweden | 31.20% | 33.30% | +2.10 pp |
| Austria | 29.10% | 31.40% | +2.30 pp |
| South Korea | 25.90% | 30.70% | +4.80 pp |
| Hungary | 27.90% | 29.80% | +1.90 pp |
| Denmark | 26.60% | 28.70% | +2.10 pp |
| Germany | 26.50% | 28.60% | +2.10 pp |
| Poland | 26.40% | 28.50% | +2.10 pp |
| Taiwan | 26.40% | 28.40% | +2.00 pp |
| United States | 26.30% | 28.30% | +2.10 pp |
| Czech Republic | 26.00% | 27.80% | +1.80 pp |
| Italy | 25.80% | 27.80% | +2.00 pp |
| Finland | 25.60% | 27.30% | +1.70 pp |
| Bulgaria | 25.40% | 27.30% | +1.90 pp |
| Jordan | 25.40% | 27.00% | +1.60 pp |
| Costa Rica | 25.10% | 26.50% | +1.40 pp |
South Korea posted the largest gain at 4.80 percentage points and climbed seven places, the biggest rank movement in the group. The United Arab Emirates and Singapore lead outright, both far above what their income levels would predict.
Every one of the top 30 economies gained ground in six months. The average gain was 2.4 percentage points, and no country went backward.
Where the United States ranks
The United States sits 24th out of the top 30 economies with an adoption rate of 28.3%. That is 35.7 percentage points behind the United Arab Emirates, which has 2.26 times the US adoption rate.
The ranking runs against the country’s position in every other AI measure. The United States leads the world in AI investment, model development, and company formation by wide margins, yet fewer than three in ten people use the technology.
Most high-income economies cluster between 25% and 45%. The European average sits around 27% and the North American average around 22%. The United States and Denmark both fall below what their income levels would suggest.
Generative AI users by generation
WORMillennials and Gen Z together make up 65% of all generative AI users. 70% of Gen Z report having used the technology, and among Gen Z professionals, 80% use AI for more than half their daily tasks.
The split at the other end of the age range is just as sharp. 50% of Boomers do not use generative AI at all, and 68% of all non-users come from Gen X or the Boomer generation.
Why non-users stay away
40% of non-users say they are not familiar enough with the technology and 32% say it is not useful to them. Neither reason is permanent, which is why the non-user group is likely to keep shrinking.
The table below shows what would move non-users onto generative AI tools.
| Reason for using it more | Share of non-users |
|---|---|
| Better understanding of the technology | 70% |
| Greater confidence that it is safe | 64% |
| Built into tools they already use | 45% |
Seven in ten name a knowledge gap rather than a product problem. That points to onboarding and education as the main lever, not new features.
What people use generative AI for
Computer and mathematical tasks accounted for close to 40% of all platform usage through 2025, the largest single category by a wide margin. Educational instruction and library tasks grew fastest, rising from 9% early in the year to roughly 14% by late 2025.
Among US adults, 53% have used generative models. Of those users, 81% use it for personal tasks, 30% for work, and 17% for school, and 41% of regular users engage with it every single day.
The style of interaction has shifted too. Automation-style conversations, where the user hands over a task to be completed independently, rose from 41% at the start of 2025 to 49% by August, overtaking augmentation-style use for the first time.
By November, augmentation had moved back ahead at 52%. The swing shows automation-oriented use growing without settling into a stable pattern.
Most used generative AI tools
ChatGPT holds 40.52% of all generative AI app downloads, 4.2 times the share of Google Gemini. The table below ranks the ten most downloaded generative AI apps over the past year by share of total downloads.
| Rank | Tool | Share of downloads |
|---|---|---|
| 1 | ChatGPT | 40.52% |
| 2 | DeepSeek (DeepSeek publisher) | 17.59% |
| 3 | Google Gemini | 9.60% |
| 4 | Doubao | 8.89% |
| 5 | DeepSeek (Hangzhou Deep Search) | 7.76% |
| 6 | PixVerse | 6.19% |
| 7 | Talkie | 4.68% |
| 8 | Nova | 4.35% |
| 9 | Microsoft Copilot | 2.83% |
| 10 | Character AI | 2.81% |
Counted together, the two DeepSeek publisher entries take 25.35% of downloads, which puts the gap with ChatGPT at 15.17 percentage points rather than the 22.93 the headline ranking suggests. The top three tools account for 67.71% of all downloads.
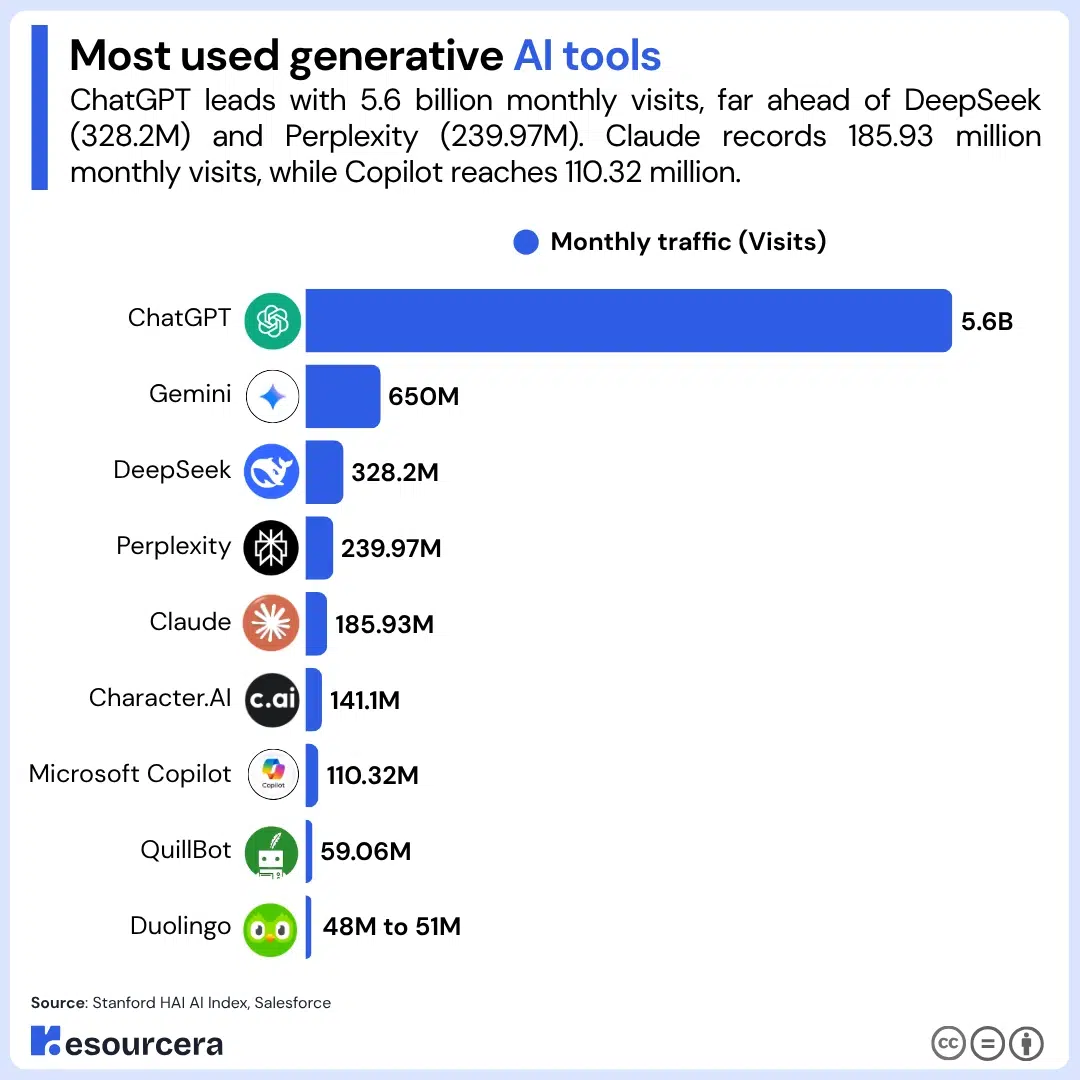
Web traffic produces a different order. The table below shows monthly traffic for the leading generative AI platforms as of November 2025.
| Platform | Monthly traffic |
|---|---|
| ChatGPT | 5.6 billion visits |
| Gemini | 650 million users |
| DeepSeek | 328.2 million visits |
| Perplexity | 239.97 million visits |
| Claude | 185.93 million visits |
| Character.AI | 141.1 million visits |
| Microsoft Copilot | 110.32 million visits |
| QuillBot | 59.06 million visits |
| Duolingo | 48 to 51 million visits |
ChatGPT draws 17 times the web traffic of DeepSeek despite holding only 1.6 times its download share. Downloads reflect where new users arrive. Traffic reflects where they stay.
(Sources: Stanford HAI AI Index, Salesforce, Master of Code, Statista)
Generative AI Adoption in Business
79% of organizations use generative AI in at least one business function, up from 71% a year earlier. Broader AI use sits at 88%, up from 78%, so nearly nine in ten companies use some form of AI and four in five use generative AI specifically.
Depth is a different story. Roughly two-thirds of organizations have not begun scaling AI across the enterprise, and only about a third report reaching the scaling phase at all.
Generative AI adoption grew 8 percentage points in a year, an 11.3% relative increase. More than two-thirds of organizations now use AI in more than one function, and half use it in three or more.
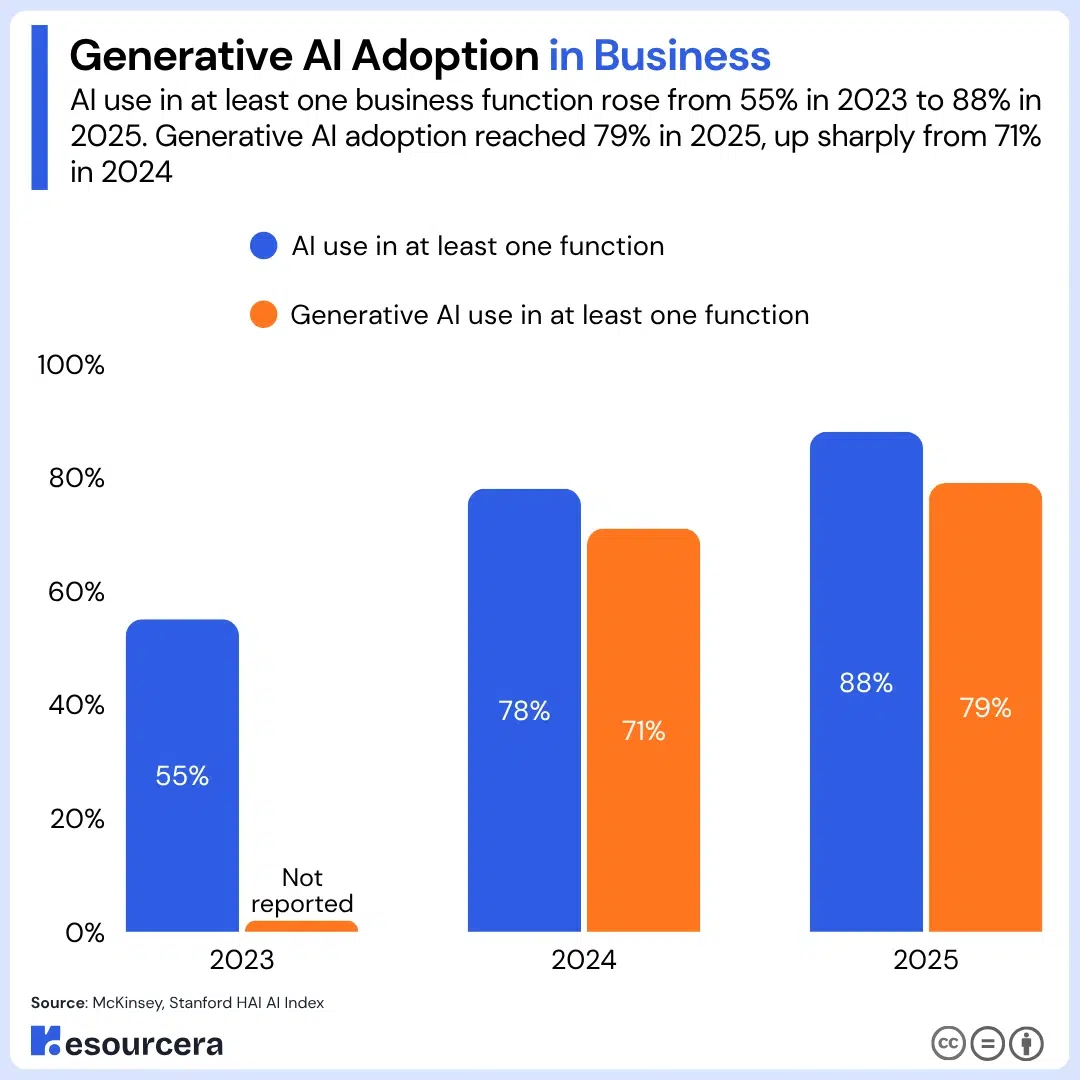
The table below tracks AI and generative AI adoption across all three years of available data.
| Year | AI use in at least one function | Generative AI use in at least one function |
|---|---|---|
| 2023 | 55% | Not reported |
| 2024 | 78% | 71% |
| 2025 | 88% | 79% |
The curve has been steep and is now flattening. With adoption at 88%, there is limited room left for the headline number to grow.
AI adoption by region
Every region gained ground, but the leaders and the fastest movers are different groups. Greater China posted the largest single-year gain at 13 percentage points, followed by Europe and developing markets at 11 each.
The table below shows AI adoption across all reported regions for each of the past three years.
| Region | 2023 | 2024 | 2025 |
|---|---|---|---|
| Europe | 57% | 80% | 91% |
| North America | 61% | 82% | 90% |
| Greater China | 48% | 75% | 88% |
| Developing markets | 49% | 77% | 88% |
| Asia-Pacific | 58% | 72% | 82% |
| All geographies | 55% | 78% | 88% |
Europe overtook North America for the first time. North America grew the least in percentage-point terms, mainly because it started from the highest 2023 base.
Gen AI Adoption by industry and business function
The highest generative AI usage sits in knowledge management within business, legal, and professional services at 58%, and in software engineering and IT within the technology sector at 58% and 56%. Marketing and sales in consumer goods and retail follows at 51%.
Functions built around processing information, writing software, handling customers, and managing internal knowledge report much higher adoption than strategy, corporate finance, risk, and compliance. Financial services is the exception, reporting high usage in risk and compliance because those functions sit at the core of the business.
Media and telecommunications, insurance, and technology report the most AI use overall. Technology had already passed 90% in the prior year, making it the only sector without a meaningful increase.
Company size predicts how far AI gets
Company size is the strongest single predictor of AI deployment stage, ahead of sector.
The table below shows the share of companies at each stage across all five revenue bands.
| Company revenue | Not using | Experimenting | Piloting | Scaling | Fully scaled |
|---|---|---|---|---|---|
| Under $100M | 9% | 39% | 22% | 25% | 5% |
| $100M to $499M | 8% | 33% | 32% | 23% | 4% |
| $500M to $999M | 5% | 31% | 32% | 29% | 3% |
| $1B to $4.9B | 6% | 22% | 31% | 32% | 9% |
| $5B and above | 3% | 17% | 31% | 39% | 10% |
49% of companies above $5 billion in revenue have reached scaling or full scale, against 30% of those under $100 million. The share not using AI at all falls from 9% to 3% across the same range.
AI agents remain early
62% of organizations are at least experimenting with AI agents, but only 23% are scaling an agentic system anywhere in the business. That leaves a 39 percentage point gap between trying agents and running them.
Scaled agent use sits in the single digits for nearly every business function. In no individual function do more than 10% of organizations report scaling agents. Even in IT and knowledge management, the two most active areas, about two-thirds or more report no agent use at all.
Technology companies are the exception. Within the sector, scaled agent use reaches 24% in software engineering, 22% in IT, and 21% in service operations. Agent use is most common across technology, media and telecommunications, and healthcare.
40% of enterprise applications are expected to include task-specific AI agents by the end of 2026, up from under 5% a year earlier. At the same time, over 40% of agentic AI projects are expected to be cancelled by 2027 on cost and unclear business value.
How much budget goes to AI
92% of businesses plan to increase AI investment between 2025 and 2027. More than one-third of AI high performers commit over 20% of their digital budgets to AI technologies, and about three-quarters of them are scaling or have scaled AI, against one-third of everyone else.
Among senior leaders, those putting at least 5% of budget into AI report higher returns than those spending less.
(Sources: McKinsey, Stanford HAI AI Index, Gartner, Master of Code)
Generative AI Investment and Funding
Global private investment in generative AI reached $170.87 billion in 2025, growing more than 200% in a single year. That represents 49.6% of all private AI investment worldwide, meaning generative AI now absorbs roughly half of every private dollar going into artificial intelligence.
Total global corporate AI investment hit $581.69 billion in 2025, up 129.9% from the prior year. Private investment made up $344.66 billion of that, or 59.3%.
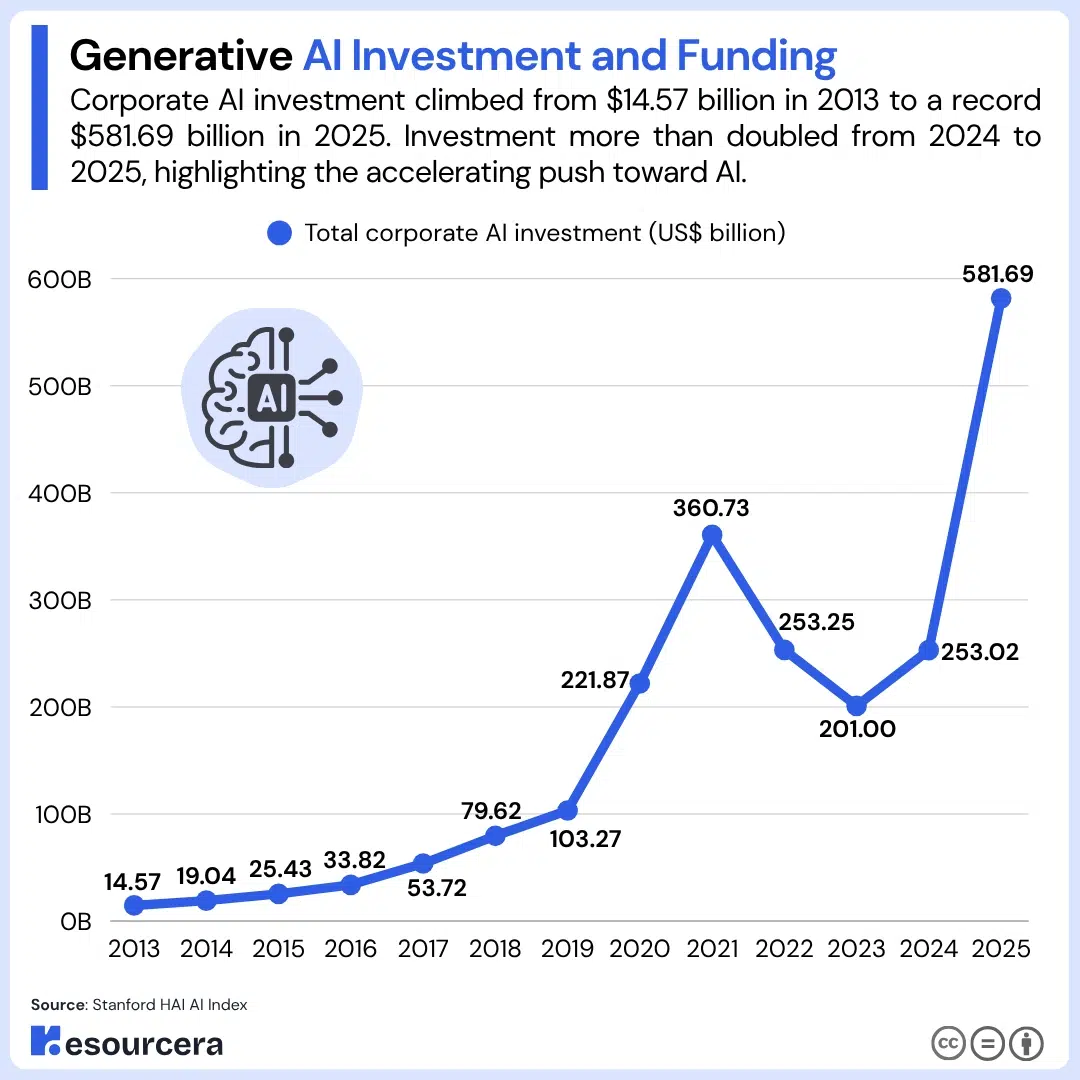
The table below covers total corporate AI investment across the full thirteen-year record, including mergers and acquisitions, minority stakes, private investment, and public offerings.
| Year | Total corporate AI investment (US$ billion) | Year-over-year change |
|---|---|---|
| 2013 | 14.57 | Baseline |
| 2014 | 19.04 | +30.7% |
| 2015 | 25.43 | +33.6% |
| 2016 | 33.82 | +33.0% |
| 2017 | 53.72 | +58.8% |
| 2018 | 79.62 | +48.2% |
| 2019 | 103.27 | +29.7% |
| 2020 | 221.87 | +114.8% |
| 2021 | 360.73 | +62.6% |
| 2022 | 253.25 | -29.8% |
| 2023 | 201.00 | -20.6% |
| 2024 | 253.02 | +25.9% |
| 2025 | 581.69 | +129.9% |
Investment rose roughly fortyfold across the period, a compound annual growth rate of 36.0%. The declines in 2022 and 2023 are the only two down years in the record, and 2025 alone added $328.67 billion in new investment, more than the entire 2023 total.
Generative AI investment by geography
Generative AI funding is more geographically concentrated than any other part of the AI economy. The table below shows private generative AI investment by region in 2025.
| Region | Generative AI private investment 2025 (US$ billion) | Share of global total |
|---|---|---|
| United States | 163.64 | 95.8% |
| Europe | 3.21 | 1.9% |
| China | 1.48 | 0.9% |
| Rest of the world | 2.54 | 1.5% |
The United States invested 110.6 times more in generative AI than China and 34.9 times the combined total of China and Europe. More than half of all US private AI investment went to generative AI specifically.
Across all AI categories, the United States drew $285.88 billion in private investment in 2025, or 82.9% of the global figure, against $12.41 billion for China and $5.90 billion for the United Kingdom.
US private AI investment grew 160.2% year over year, compared with 32.2% in China and 7.2% in Europe.
Company formation and deal size
3,499 AI companies were newly funded worldwide in 2025, a 70.8% increase, of which 311 were generative AI companies. The average private AI investment event rose 46% to $66.5 million.
The table below shows AI funding events by deal size across 2024 and 2025.
| Funding size | 2024 events | 2025 events | Change |
|---|---|---|---|
| Over $1 billion | 15 | 28 | +86.7% |
| $500 million to $1 billion | 20 | 30 | +50.0% |
| $100 million to $500 million | 146 | 286 | +95.9% |
| $50 million to $100 million | 197 | 373 | +89.3% |
| Under $50 million | 2,951 | 4,464 | +51.3% |
| Undisclosed | 209 | 324 | +55.0% |
| Total | 3,538 | 5,505 | +55.6% |
Deal counts grew in every size band, but billion-dollar funding events nearly doubled. Within the United States, California alone took $218 billion in 2025, over 75% of the national total, followed by Colorado at $19 billion, New York at $13 billion, and Florida at $6 billion. More than half of all US states received under $100 million.
Where the money is going
AI infrastructure, models, research, and governance attracted $143.22 billion in 2025, more than four times the next largest category. The table below shows private AI investment across all tracked focus areas in 2025.
| Focus area | 2025 private investment (US$ billion) |
|---|---|
| AI infrastructure, models, research, governance | 143.22 |
| Data management and processing | 31.58 |
| Internet of things | 14.63 |
| Medical and healthcare | 11.75 |
| Pharmaceutical | 10.58 |
| Cloud computing | 10.31 |
| Cybersecurity and data protection | 8.42 |
| AI agents | 8.02 |
| Autonomous vehicles | 7.94 |
| Robotics | 7.84 |
| Fintech | 6.52 |
| Defense | 5.30 |
| Biotech | 4.84 |
| Energy management | 4.64 |
| Semiconductors | 4.40 |
| Creative, music, video content | 4.19 |
| Retail | 4.10 |
| Legal tech | 3.79 |
| Entertainment | 3.66 |
| Quantum computing | 3.11 |
| Accounting and finance | 2.59 |
| Marketing and digital ads | 2.51 |
| HR tech | 2.19 |
| Ed tech | 1.44 |
| Drones | 1.42 |
Capital is chasing the cost of running AI at scale rather than the software layer sitting above it. AI agents, despite dominating the hiring and product conversation, took just $8.02 billion, about one-eighteenth of the infrastructure total.
(Source: Stanford HAI AI Index)
Revenue of Leading Generative AI Companies
The two largest generative AI companies have reached $25 billion and $19 billion in annualized revenue in under four years. Everyone else in the field is an order of magnitude behind.
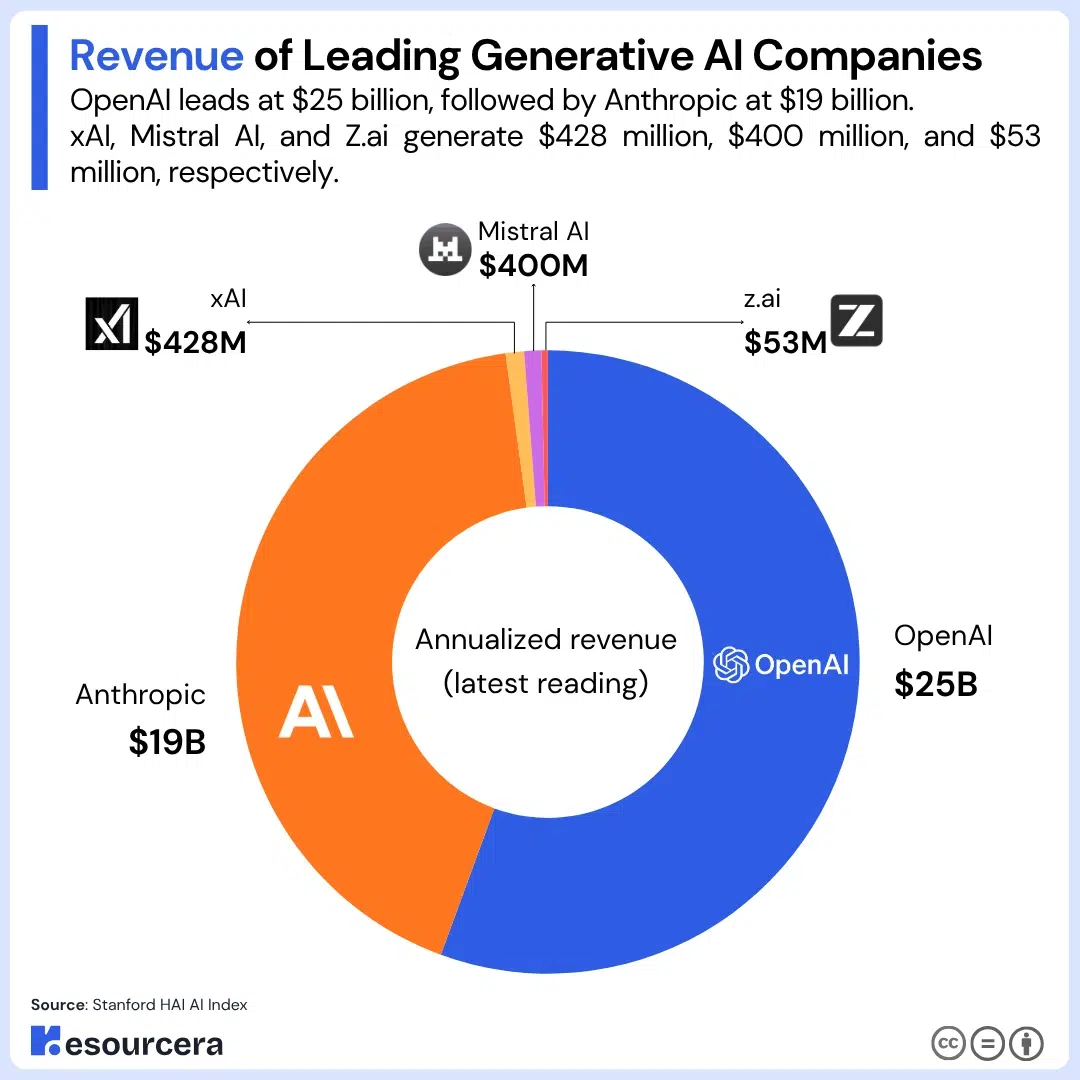
The table below shows annualized revenue for the leading generative AI companies at their latest reported reading.
| Company | Annualized revenue (latest reading) |
|---|---|
| OpenAI | $25 billion |
| Anthropic | $19 billion |
| xAI | $428 million |
| Mistral AI | $400 million |
| Z.ai | $53 million |
OpenAI and Anthropic together account for $44 billion, roughly 98% of the revenue represented in this group. The third-placed company earns 1.7% of what the leader does.
Placed against other high-growth companies in the years after crossing $1 billion in annual revenue, the early revenue growth at the top of this list outpaces Uber, Cheniere Energy, and Moderna over comparable periods. Compute costs have risen just as sharply, which is why revenue scale and profitability remain separate questions.
(Source: Stanford HAI AI Index)
Business Value, ROI, and Measured Returns
Only 39% of organizations attribute any level of profit impact to AI, and most of those say it accounts for less than 5% of earnings. Value shows up clearly at the level of individual use cases but has not yet reached the bottom line at enterprise scale.
Companies consistently report better innovation, satisfaction, and differentiation before they report better margins.
The table below shows the share of organizations reporting improvement in each measure over the past year.
| Organizational measure | Share reporting improvement |
|---|---|
| Innovation | 64% |
| Employee satisfaction | 45% |
| Customer satisfaction | 45% |
| Competitive differentiation | 45% |
| Cost | 38% |
| Profitability | 36% |
| Organic revenue growth | 33% |
| Attraction and retention of talent | 33% |
| Change in market share | 25% |
Innovation leads the list by 19 percentage points. No more than 7% of organizations say AI worsened any cost metric, and for most measures the share reporting improvement is roughly matched by the share reporting no effect at all.
Cost savings and revenue gains land in different parts of the business. Cost reductions are reported most often in software engineering and manufacturing, both at 56%, followed by IT.
Revenue increases cluster elsewhere. 67% of organizations report revenue gains from AI in marketing and sales, 65% in strategy and corporate finance, and 62% in product or service development. This split has held across multiple years.
Reported returns
74% of organizations report ROI on at least one generative AI use case, with another 30% to 35% expecting returns within twelve months.
Use cases showing returns in the 26% to 34% range include customer service, productivity, sales and marketing, digital commerce, back-office processes, and manufacturing.
Businesses adopting generative AI report average cost savings of 15.7% and a productivity increase of 24.69%. Among companies with AI in production, 86% report revenue growth of 6% or more, and 84% move a use case from concept to launch within six months.
(Sources: McKinsey, Stanford HAI AI Index, Gartner, Google Cloud)
Generative AI and Workforce Productivity
Productivity gains range from 14% in customer support to 200% in content production, with the largest results in structured work where output is easy to measure. In work requiring deeper reasoning or judgment, the same tools produce little benefit and in one case made experienced developers slower.
The pattern is consistent. Generative AI helps most where tasks are repeatable, well-defined, and monitored for quality, and it helps the least experienced workers most.
The table below shows measured productivity changes by occupation and application.
| Occupation | AI application | Change in productivity |
|---|---|---|
| Authors and content producers | LLMs for content | +200% output volume |
| Accountants | AI-based accounting | +55% weekly client support throughput |
| Marketing teams | Multimodal ad creation | +50% output per worker |
| Software developers | GitHub Copilot | +26% completed pull requests |
| Customer support agents | Conversational assistant | +14% to 15% issues resolved per hour |
| Software engineers | Learning new libraries | 0%, statistically insignificant |
| Developers | Open-source tools | -19% speed, developers became slower |
The negative result deserves attention. Experienced open-source developers became 19% slower using AI assistance while believing it was helping them, a gap between perceived and actual performance that does not appear in any of the positive results.
There is a longer-term concern as well. Software engineers who leaned heavily on AI to learn showed no measurable speed improvement and faced learning penalties, meaning heavy reliance may slow skill development over time.
US productivity growth reached 2.7% in 2025, nearly double the 1.4% average of the previous decade. Whether that reflects AI or an unrelated cycle is not yet settled.
(Sources: Stanford HAI AI Index, Goldman Sachs)
Generative AI and Jobs
One-third of organizations expect AI to reduce their workforce over the coming year, though large-scale job losses have not yet appeared in overall employment data. The visible effects today sit in hiring pipelines and among the youngest workers rather than in mass layoffs.
Employment for software developers aged 22 to 25 has fallen close to 20% from its 2022 peak, while headcount for older age groups in the same occupation has continued to grow.
Expected workforce change
32% of organizations expect a workforce reduction of 3% or more in the next year, 43% expect little or no change, and 13% expect an increase of that size. Larger organizations are more likely to expect reductions, at 35% for those above $1 billion in revenue against 30% below.
Across business functions, a median of 17% of organizations reported workforce declines from AI in the past year, but a median of 30% expect declines in the coming year.
The expected decrease outpaces the observed one in nearly every function, with the widest gaps in service operations, supply chain and inventory management, marketing and sales, and software engineering.
Hiring has not stopped. Most organizations added AI roles over the past year, and larger companies hired more. Software engineers and data engineers are the most in-demand roles.
The effect on young workers
Among workers aged 22 to 25, employment in the most AI-exposed occupations has fallen roughly 16% relative to the least exposed. The gap began widening in mid-2024 and has grown steadily since.
Between 2022 and early 2025, unemployment rose across all occupation groups regardless of AI exposure.
The rate for the most exposed workers rose 0.30 percentage points, while for the least exposed workers it rose 0.94 percentage points, three times as much.
Across 844 occupational tasks, 46.1% of workers actively want AI to take over the task, particularly where automation would free time for higher-value work or reduce repetition. The tasks with the highest automation desire account for only 1.3% of actual usage.
Generative AI skills in job postings
Demand for generative AI skills more than doubled in a year. The table below shows US job postings for every tracked generative AI skill across 2024 and 2025.
| Skill | 2024 postings | 2025 postings | Change |
|---|---|---|---|
| Generative artificial intelligence | 65,557 | 138,188 | +111% |
| Large language modeling | 19,045 | 38,526 | +102% |
| Prompt engineering | 6,152 | 22,227 | +261% |
| Retrieval augmented generation | 2,885 | 12,609 | +337% |
| Text to speech | 1,047 | 1,900 | +81% |
| Generative adversarial networks | 1,272 | 1,571 | +24% |
| Multimodal models | 616 | 1,459 | +137% |
| Variational autoencoders | 625 | 717 | +15% |
| Context engineering | 9 | 703 | +7,711% |
| Stable Diffusion | 628 | 699 | +11% |
Context engineering went from 9 postings to 703 in twelve months, the fastest growth of any skill tracked. Prompt engineering and retrieval augmented generation both grew far faster than the category average, while older image-generation and adversarial-network skills barely moved.
AI agent skills in job postings
The shift from chat tools to autonomous systems shows up sharply in hiring language.
The table below shows US job postings for every tracked AI agent skill across 2024 and 2025.
| Skill | 2024 postings | 2025 postings | Change |
|---|---|---|---|
| Agentic AI | 151 | 16,541 | +10,854% |
| AI agents | 1,310 | 15,217 | +1,062% |
| ChatGPT | 5,535 | 14,376 | +160% |
| Conversational AI | 5,430 | 6,976 | +28% |
| Microsoft Copilot | 1,416 | 6,395 | +352% |
| Multi-agent systems | 1,635 | 5,461 | +234% |
| Chatbot | 2,316 | 4,596 | +98% |
| LangGraph | 194 | 4,294 | +2,113% |
| Microsoft Copilot Studio | 549 | 3,366 | +513% |
| Agentic systems | 192 | 2,850 | +1,384% |
Agentic AI went from 151 postings to 16,541 and became the single most requested agent skill. The share of AI postings mentioning ChatGPT, chatbot, or conversational AI all declined even as raw counts rose, showing employers moving from general familiarity with chat tools toward the skills needed to build and coordinate task-oriented systems.
AI job postings by sector
AI hiring expanded across every sector of the US economy, including several with historically low adoption. The table below shows each sector’s share of AI job postings in 2025.
| Sector | 2025 share of postings |
|---|---|
| Information | 13.22% |
| Professional, scientific, and technical services | 6.49% |
| Finance and insurance | 5.33% |
| Manufacturing | 4.66% |
| Management of companies and enterprises | 3.28% |
| Utilities | 2.89% |
| Educational services | 2.42% |
| Real estate and rental and leasing | 2.08% |
| Wholesale trade | 1.93% |
| Mining, quarrying, and oil and gas extraction | 1.87% |
| Public administration | 1.69% |
| Retail trade | 1.67% |
| Agriculture, forestry, fishing and hunting | 1.32% |
| Transportation and warehousing | 1.26% |
| Waste management and administrative support services | 0.46% |
Management of companies posted the fastest relative growth at 102.28%. Information remains far ahead in absolute terms at more than double the next sector.
(Sources: Stanford HAI AI Index, McKinsey, World Economic Forum)
What Generative AI Is Worth to the People Using It
US consumers gained an estimated $172 billion in value from generative AI over the past year, up 53.6% from $112 billion. Most generative AI tools are free or nearly free, which makes their economic value invisible in revenue statistics.
The measure is consumer surplus, the amount users say they would need to be paid to give up all generative AI tools for one month.
The table below shows how that value has changed in a single year.
| Measure | 2025 | 2026 | Change |
|---|---|---|---|
| Total consumer surplus | $112 billion | $172 billion | +53.6% |
| US adults using generative AI | 95 million | 115 million | +21.1% |
| Average monthly value per user | $98 | $125 | +27.6% |
| Median monthly value per user | $3.40 | $11.40 | +235.3% |
The median line is the most revealing. Average value grew 27.6% while median value grew 235.3%, meaning gains are spreading down from a small group of heavy users into the broader population rather than concentrating further at the top.
At $125 a month, the average user places roughly $1,500 a year of value on tools that most of them pay nothing for.
(Sources: Stanford HAI AI Index, Adobe, Master of Code)
Generative AI Adoption by Industry
Adoption ranges from 23% in corporate legal departments to 78% in ecommerce, a spread of 55 percentage points. Industries with high volumes of repetitive documentation, customer contact, or design iteration have moved fastest.
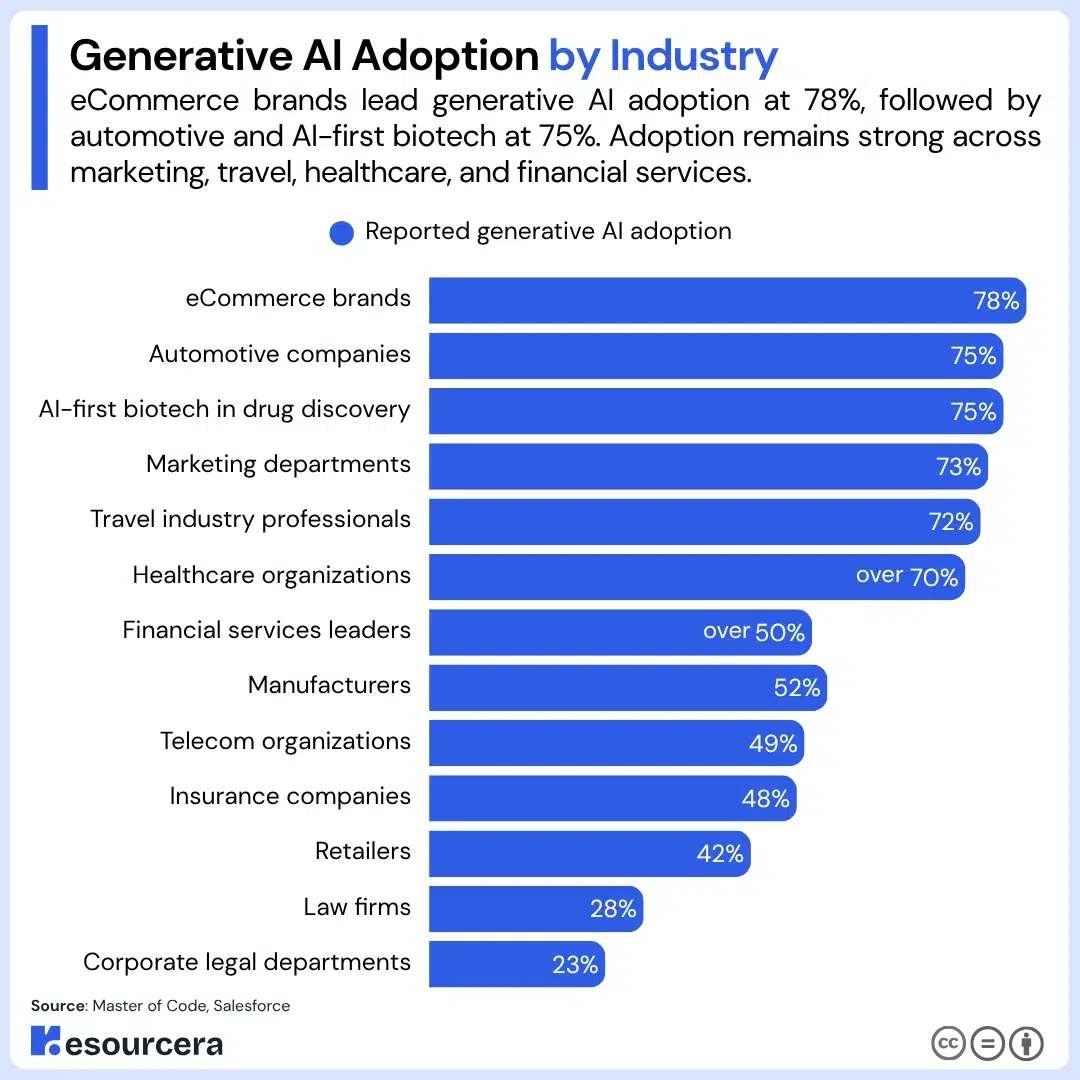
The table below compares reported generative AI adoption across every industry covered in this article. Definitions vary by sector, so these are best read as relative positions rather than a single like-for-like ranking.
| Industry | Reported generative AI adoption |
|---|---|
| eCommerce brands | 78% |
| Automotive companies | 75% |
| AI-first biotech in drug discovery | 75% |
| Marketing departments | 73% |
| Travel industry professionals | 72% |
| Healthcare organizations | Over 70% |
| Financial services leaders | Over 50% |
| Manufacturers | 52% |
| Telecom organizations | 49% |
| Insurance companies | 48% |
| Retailers | 42% |
| Law firms | 28% |
| Corporate legal departments | 23% |
Healthcare and pharma
Over 70% of healthcare organizations have implemented or are pursuing generative AI capabilities, but only about 20% have deployed it in production globally. The gap between intent and production is wider here than in almost any other sector.
72% of healthcare executives trust AI to automate administrative processes so clinicians can spend more time with patients.
The table below shows the leading near-term and long-term applications in healthcare.
| Application | Priority level | Share of organizations |
|---|---|---|
| Risk stratification | Long term | 44% |
| Clinical decision support | Long term | 41% |
| Charge capture and reconciliation | Near term | 39% |
| Structuring and analyzing patient data | Near term | 37% |
| Diagnostics and treatment recommendations | Long term | 37% |
| Workflow optimization | Near term | 36% |
The main barriers are lack of resources and lack of expertise, both at 46%, followed by regulation at 33%.
In pharma, 75% of AI-first biotech companies use generative AI substantially in drug discovery. Reported gains include a 25% reduction in molecular design time, a 30% cut in medical document writing time, and up to 40% higher productivity in high-frequency tasks. Generative AI could unlock up to $1 trillion in improvements across healthcare overall.
Financial services and banking
More than 50% of financial services leaders report using generative AI, up from 40% the previous year. 77% of executives consider AI critical to their success, and 72% of CEOs cite AI funding as a top priority.
The table below ranks the leading generative AI use cases in financial services by share of organizations deploying them.
| Use case | Share of organizations |
|---|---|
| Improved virtual assistants | 80% |
| Financial document search | 78% |
| Personalized recommendations | 76% |
| Capital market analysis | 72% |
Two-thirds of C-level professionals expect revenue increases of 10% to 30% over three years. Generative AI could add $200 billion to $340 billion in banking revenue and raise front-office employee efficiency by 27% to 35%.
Adoption is uneven within the sector. 70% of banking decision-makers consider personalization key to customer service, but only 14% of consumers say their bank offers excellent tailored experiences.
Marketing and sales
73% of marketing departments already use generative AI, the highest functional adoption of any business area. 51% of individual marketers are using or experimenting with it, and another 22% plan to adopt soon.
The table below shows the most common generative AI applications in marketing and in sales.
| Application | Marketing | Sales |
|---|---|---|
| Basic content creation | 76% | 82% |
| Copywriting | 76% | Not reported |
| Creative thinking | 71% | Not reported |
| Analyzing market data | 63% | 74% |
| Generating images | 62% | Not reported |
| Automating personalized communications | Not reported | 71% |
Marketers expect generative AI to save five hours a week, which works out to over a month of working time per year. 71% expect it to remove busy work so they can focus on strategy.
About one-third of salespeople use or plan to use generative AI, though 61% believe it will help them serve customers better and sell more efficiently. Among those already using it, 84% say it increased sales at their organization.
53% of sellers do not know how to get the most value from the technology, 49% do not know how to use it safely, and 39% worry about losing their job if they do not learn it.
Customer service
Customer service has the lowest generative AI usage of the three commercial functions at 24%, with only 15% more planning to adopt. That is despite the strongest measured results of any function.
Among service professionals already using it, 9 out of 10 say AI helps them serve customers faster. Measured performance shows a 13.8% increase in successfully resolved chats per hour. Organizations with over three years of experience report a 25% reduction in cost per contact, rising to 30% for those applying generative AI to one or two specific use cases.
60% of service workers say they do not know how to get the most value from the technology, and 48% worry about job security if they do not learn it. 85% of CEOs expect direct customer communication to involve generative AI within two years.
Retail and ecommerce
42% of retailers currently use AI, with another 34% piloting or evaluating, and 92% are increasing investment. The table below shows the leading retail applications by share of retailers using them.
| Application | Share of retailers |
|---|---|
| Tailored suggestions | 66% |
| Trend analysis and inventory management | 64% |
| Automatic product description generation | 53% |
| Virtual try-ons | 28% |
| Faster design | 21% |
In ecommerce, 78% of brands have implemented or plan to implement AI, and 83% name improved chatbots as the top application. 70% of consumers say tools like ChatGPT are replacing traditional search for product recommendations, the single most consequential figure in this section for anyone running an ecommerce business.
Insurance
Insurance adoption nearly doubled in a year, from 29% to 48%. Reported benefits are improved staff efficiency at 61%, cost savings at 56%, and better customer service and growth at 48% each.
The main barriers are staff training at 47% and cost at 35%. Generative AI could raise support agent productivity 40% to 60% by cutting the 35% of time agents spend retrieving information.
Legal, automotive, telecom, and travel
Legal has the lowest adoption of any sector covered, at 28% of law firms and 23% of corporate legal departments. Even so, 73% of lawyers expect to integrate AI into their work, 87% of those using it report significantly improved daily processes, and 44% of current legal tasks could be automated.
Automotive sits at the opposite end, with 75% of companies running at least one generative AI use case and the remaining 25% planning to start within a year.
Development timelines for automobile parts have been cut 10% to 20%, and the technology is projected to generate $300 billion annually for the industry by 2035.
49% of telecom organizations are adopting or assessing generative AI, and 84% plan to offer generative AI-powered customer services. Customer chatbots are the most widely adopted application at 63%. Adoption of tested use cases sits at 19% and is expected to reach 48% within two years.
In travel and hospitality, 72% of professionals have experience customizing generative AI models though only 24% report hands-on usage.
Integration improves operational efficiency 20% to 40% and lifts revenue 5% to 20%. 81% of hospitality leaders see benefits, while 72% worry about privacy and 49% fear losing the human touch.
(Sources: Master of Code, Salesforce, McKinsey, Capgemini, Statista)
Risks, Trust, and Barriers to Adoption
51% of organizations using AI report at least one negative consequence, and inaccuracy is the most common by a clear margin. Nearly one-third of all organizations report problems stemming specifically from AI getting things wrong.
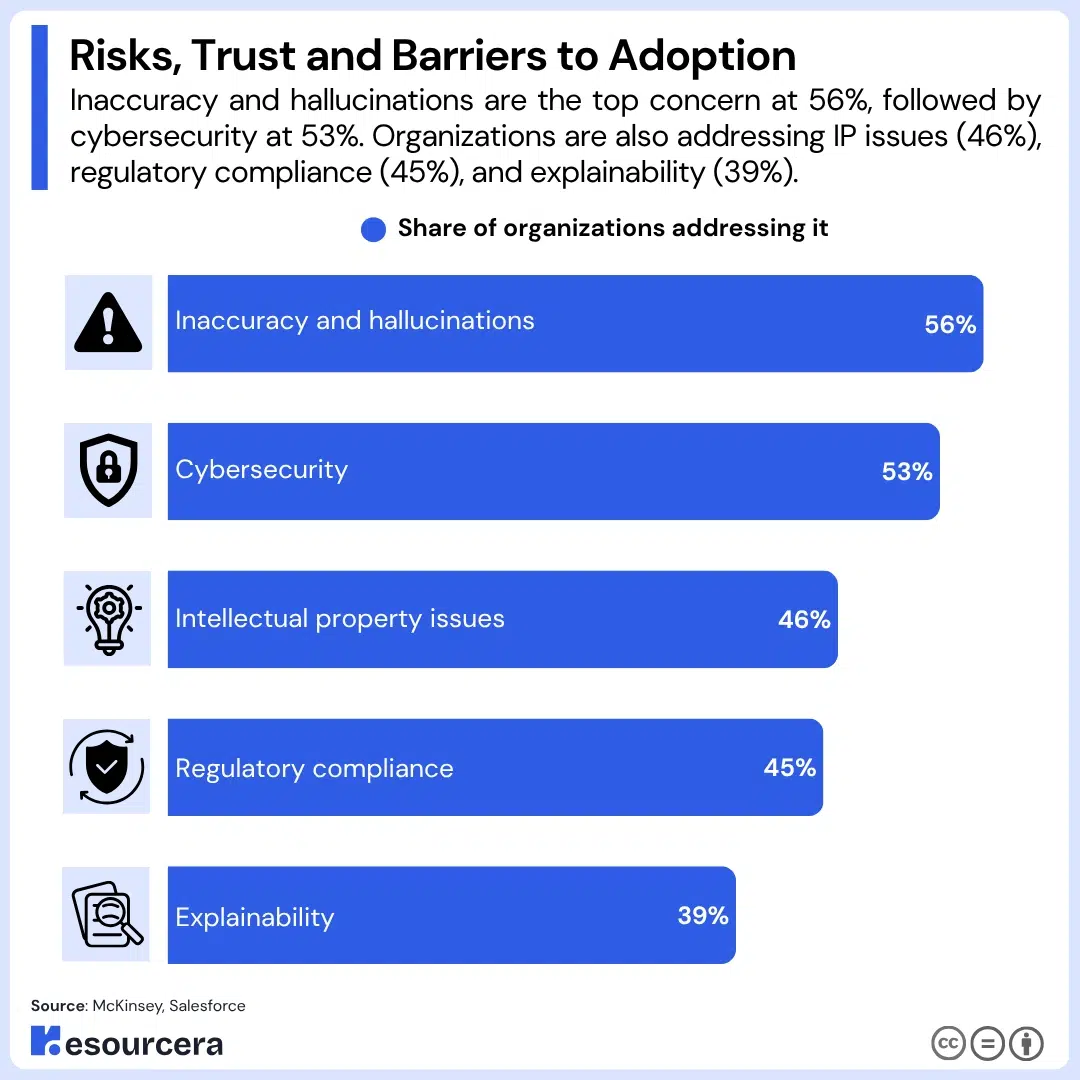
Organizations now act to manage an average of four AI-related risks, up from two in 2022.
The table below shows which risks companies are actively addressing.
| Risk | Share of organizations addressing it |
|---|---|
| Inaccuracy and hallucinations | 56% |
| Cybersecurity | 53% |
| Intellectual property issues | 46% |
| Regulatory compliance | 45% |
| Explainability | 39% |
Explainability is the second most commonly experienced problem but ranks last among mitigated ones, meaning companies are running into it without acting on it.
Organizations with the most AI deployed report the most problems. High performers, who have deployed roughly twice as many use cases as everyone else, are more likely to report negative consequences, particularly around intellectual property infringement and regulatory compliance. They also protect against a larger number of risks.
Worker and consumer trust
Trust has not kept pace with adoption. 59% of workers believe generative AI outputs are biased, 54% believe they are inaccurate, and 73% believe generative AI introduces new security risks.
Trust also predicts usage. Workers who trust AI are more than twice as willing to use it at work and four times more likely to know how it is governed in their business.
The table below shows what workers say would establish generative AI as trustworthy.
| Trust factor | Share of workers |
|---|---|
| Human oversight | 60% |
| Enhanced security | 59% |
| Trusted customer data | 58% |
| Ethical use guidelines | 58% |
Data privacy is the leading concern among users, with 72% ranking it in their top three and 40% naming it first. Transparency follows at 47%.
Among consumers, 53% still distrust AI-generated search results. At the same time, 78% of people think the benefits of generative AI outweigh the risks, and 65% of consumers trust businesses that use AI against 14% who do not.
There is a wide perception gap inside companies. 83% of C-suite leaders claim they know how to use generative AI while keeping data secure, against only 29% of individual contributors.
(Sources: McKinsey, Salesforce, Statista, Gartner, IBM)
Final Thoughts
Generative AI has won the adoption argument and has not yet won the value argument. Nearly nine in ten organizations use AI, four in five use generative AI, and half of all private AI capital now flows into generative systems, yet only 39% can point to any profit impact and most of those say it is under 5%.
The companies capturing real value follow a visible pattern. They redesign workflows, set growth targets rather than just cost targets, and put serious budget behind it.
That group is about 6% of all organizations, and it is the only group where the spending and the results line up.
Expect the adoption headline to stall near 90% because there is nowhere left for it to go. The scaling number becomes the metric that matters from here.
Agents are the next test. 62% of organizations are experimenting, 23% are scaling, and roughly 40% of agent projects are forecast to be cancelled by 2027. The distance between pilot and production is where the next three years of this story get decided.