Claude has 245 million monthly active users as of June 2026.
In January 2025 it had around 5 million people using it each month. By June 2026 that number was 245 million, and more than a million new accounts were being created every single day.
Claude now takes 40% of everything enterprises spend on large language models and writes 4% of all public code committed to GitHub.
None of that came from winning the consumer market. ChatGPT still holds six times Claude’s share of AI web traffic, yet Claude earns roughly $192 per user each year against OpenAI’s $23.
Read on to get full insights on Claude AI and its user growth in 2026.
Claude AI Statistics 2026: Key Highlights
- Claude has 245 million monthly active users worldwide as of June 2026, up from about 5 million in January 2025.
- More than 1 million people sign up for Claude every day.
- Anthropic’s annualized revenue run-rate crossed $47 billion in May 2026, up from $1 billion at the end of 2024.
- Anthropic serves over 300,000 business customers, with more than 1,000 accounts spending over $1 million a year.
- 8 of the Fortune 10 and roughly 70% of the Fortune 100 are Claude customers.
- Anthropic holds 40% of enterprise spending on large language models, ahead of OpenAI at 27%.
- Claude holds an estimated 54% of the enterprise coding model market, more than double OpenAI’s 21%.
- Claude’s share of global AI web traffic reached 8.9% in May 2026, up from 1.6% a year earlier.
- Claude grew from under 2% to roughly 17% of the US mobile chatbot market in six months.
- 93% of Claude conversations produce a concrete output such as a document, an explanation, or working code.
- ClaudeBot is the second most active AI web crawler, ahead of GPTBot by a 1.7 to 1 margin.
How Many People Use Claude in 2026?
Claude has 245 million monthly active users globally on web and app together as of June 2026.
That is up from roughly 5 million in January 2025, a 49-fold increase across 17 months.
The scale of that jump is easier to read as a rate than as a total. Sustained across 17 months, it works out to roughly 26% compounding growth every single month.
Very few consumer products have held that pace at nine-figure scale.
One major reason for this rapid growth is the number of new sign-ups. Anthropic reported in March 2026 that more than one million people were creating Claude accounts each day. At that rate, Claude adds a user base the size of its entire January 2025 total roughly every five days.
Website traffic tracks the same curve. Claude.ai recorded an estimated 952.6 million monthly visits in May 2026, with 73.78% of desktop traffic arriving direct rather than through search or referral.
Direct traffic at that share is a repeat-usage signal rather than a discovery signal, which suggests the visit count reflects a habitual user base rather than one-time curiosity.
Claude’s Mobile App Reached 12.48 Million Monthly Active Users
Claude’s mobile app has an estimated 12.48 million monthly active users as of 2026. This was a 49.15% increase in one month and placed Claude 37th among all apps worldwide.
Mobile daily active users also reached 11.3 million by early 2026, up 183% from the beginning of the year.
Mobile has become an important part of Claude’s growth. By early 2026, mobile devices accounted for 54% of Claude’s total usage. This is a major change from 2024, when most people used Claude through its website.
Sources: Statista, FatJoe, TechnologyChecker
Claude User Growth Over Time
Claude’s user base grew from 2 million in the first half of 2024 to 245 million by June 2026.
Claude’s growth happened in two main stages. During 2024 and most of 2025, its consumer chatbot audience generally grew by around 80% to 225% every six months.
Growth accelerated sharply after late 2025 as Claude expanded beyond its original developer-focused audience. The launch and wider adoption of its mobile apps, Claude Code, desktop app, and Cowork helped bring the platform to more users.
Between the second half of 2025 and June 2026, Claude’s reported user count increased from 20 million to 245 million. That was an increase of 1,125% in around six months. Claude added more users during this period than it had gained during its first three years combined.
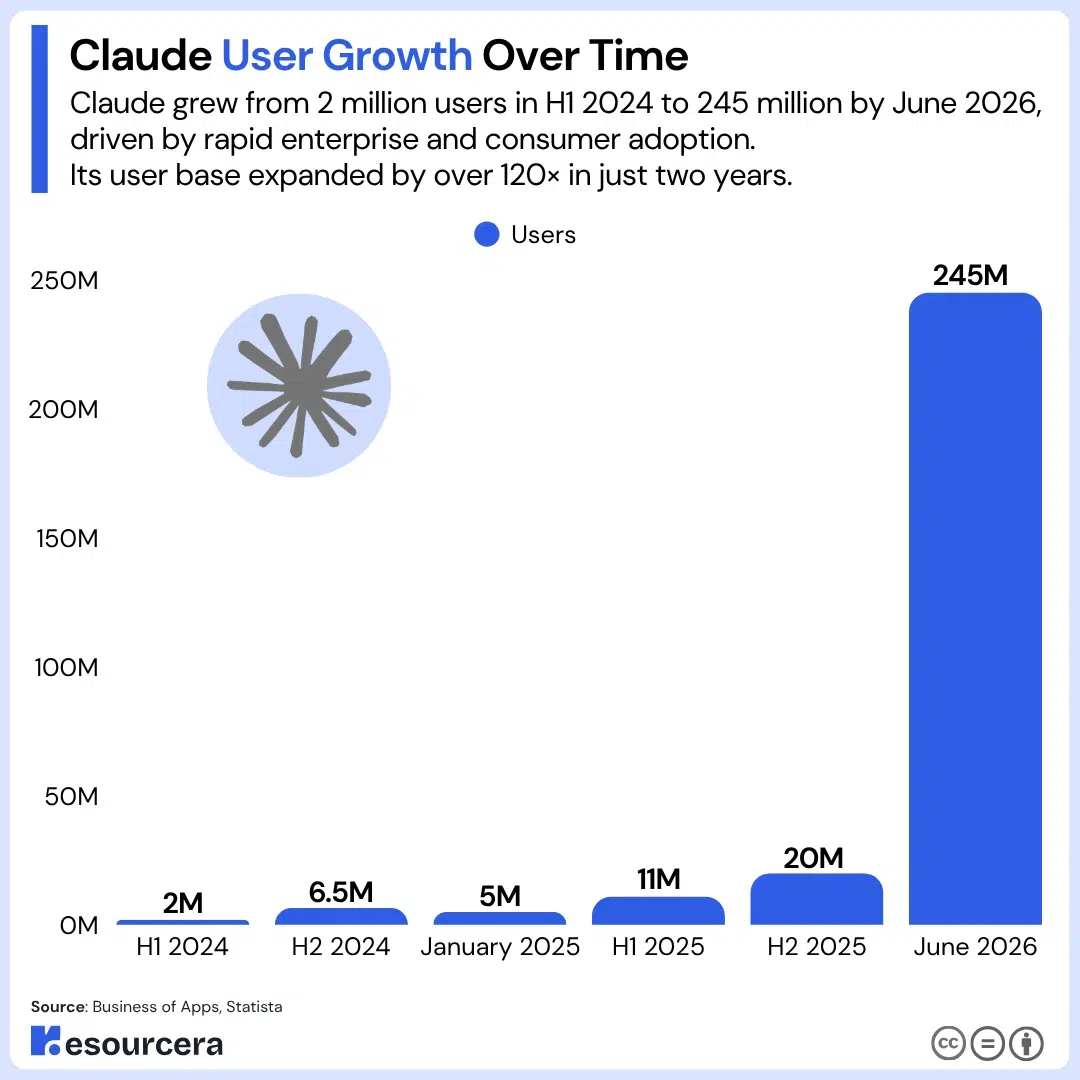
Here is the full user progression across every period with available data.
| Period | Users |
|---|---|
| H1 2024 | 2 million |
| H2 2024 | 6.5 million |
| January 2025 | 5 million |
| H1 2025 | 11 million |
| H2 2025 | 20 million |
| June 2026 | 245 million |
The figures are not fully comparable because they measure different parts of Claude’s audience. Consumer chatbot figures mainly track people using Claude through the Claude.ai website.
Monthly active user figures cover a wider range of products, including Claude’s website, mobile apps, desktop app, Claude Code, and Cowork. This broader measurement explains some of the large jumps between periods.
Claude App Downloads Passed 20 Million
Claude has been downloaded more than 20 million times since launch, with 8.7 million of those coming in the second half of 2025 alone.
Downloads grew 74% between the second half of 2024 and the second half of 2025.
Download volume stayed modest relative to Claude’s revenue for most of this period, which reflects where the money actually came from.
A large share of Claude usage runs through the API and enterprise licences rather than through app installs, so install counts understate the platform’s reach.
This table shows Claude app downloads by half-year period.
| Period | Downloads |
|---|---|
| H2 2024 | 5 million |
| H1 2025 | 7 million |
| H2 2025 | 8.7 million |
Sources: Business of Apps, Statista
Claude Users by Country
The United States is Claude’s largest market, accounting for 29% of all app downloads and roughly a quarter of total traffic. The US and India together make up 33.13% of Claude’s user base.
Claude’s geographic footprint is unusually concentrated for a product at this scale.
France is the second largest download market at 10%, which is a much higher share than France’s population or internet base would predict, and points to strong professional adoption in European markets rather than broad consumer spread.
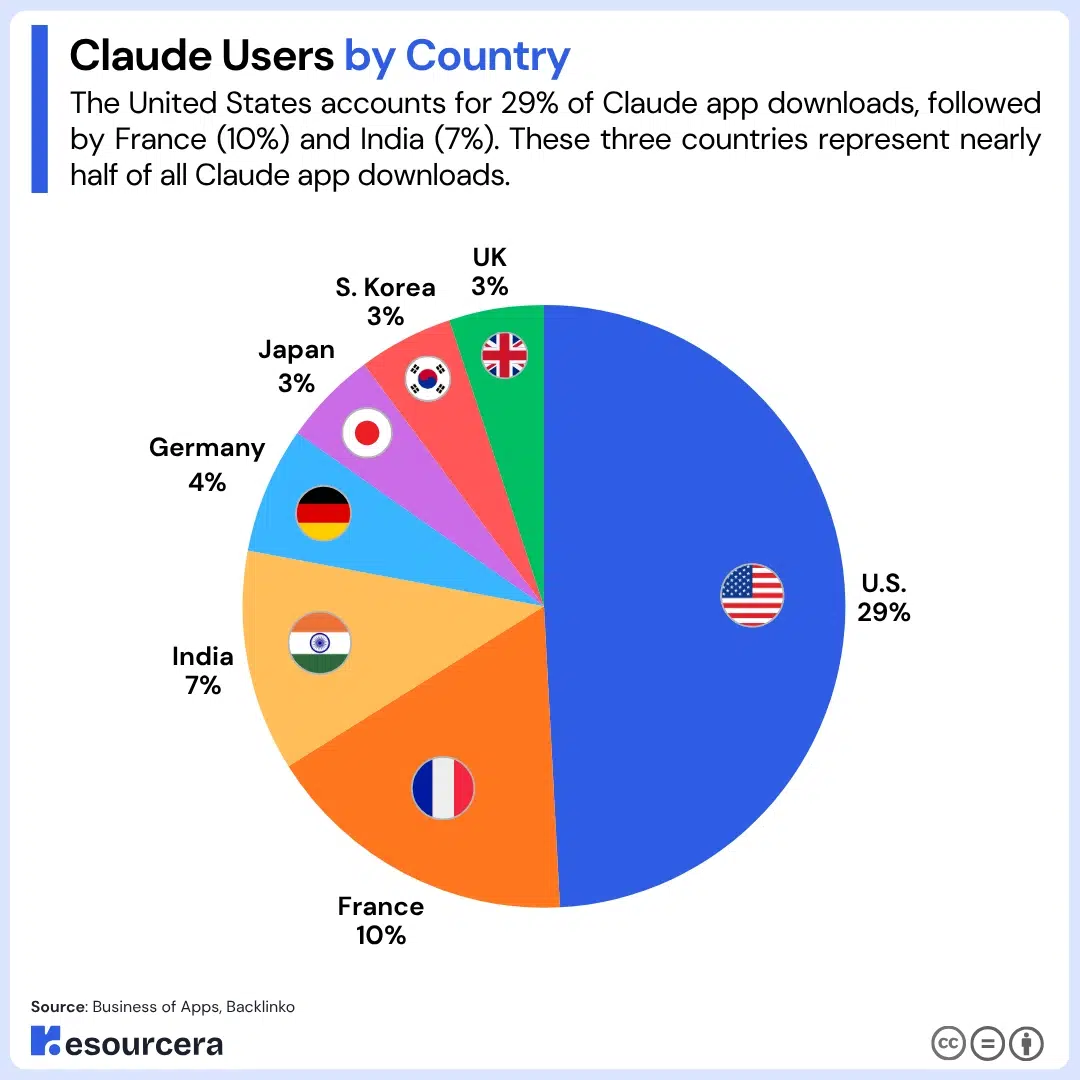
This table shows the Claude app download share by country.
| Country | Share of downloads |
|---|---|
| United States | 29% |
| France | 10% |
| India | 7% |
| Germany | 4% |
| Japan | 3% |
| South Korea | 3% |
| United Kingdom | 3% |
Website usage tells a slightly different story, with India ranking second rather than third and several markets appearing that do not show up in download data at all.
| Country | Claude website users |
|---|---|
| United States | 3.2 million |
| India | 2.1 million |
| Japan | 692,200 |
| South Korea | 556,700 |
| Kenya | 523,600 |
| United Kingdom | 516,800 |
| Germany | 491,100 |
| Indonesia | 453,500 |
| Israel | 329,200 |
| Brazil | 327,600 |
Global Usage Is Getting More Concentrated, Not Less
The top 20 countries account for 48% of all population-adjusted Claude usage, up from 45% in the previous measurement period. Adoption is consolidating in markets that were already ahead rather than spreading evenly.
Inside the United States the pattern runs the other way. The five highest-usage states fell from 30% of per-person usage in August 2025 to 24% by February 2026, and the top ten states dropped from 40% to 38%. American adoption is levelling out across states even as the gap between countries widens.
At the current rate of convergence, US states would reach roughly equal per-capita usage in five to nine years. That estimate was two to five years in the prior measurement cycle, so domestic convergence is real but slowing.
Sources: Business of Apps, Backlinko, Anthropic Economic Index 1
Claude User Demographics
Claude’s user base is 77.1% male and 22.9% female.
While, more than half of users, 51.88%, are aged 18 to 24, which is a younger and more concentrated profile than ChatGPT or Gemini, both of which peak in the 25 to 34 bracket.
The age concentration is worth pausing on. Claude is widely described as an enterprise-first product, yet its single largest user segment is the group least likely to be making enterprise purchasing decisions.
That tension is explained by the split between who uses Claude and who pays for it, which the revenue data makes clear later in this article.
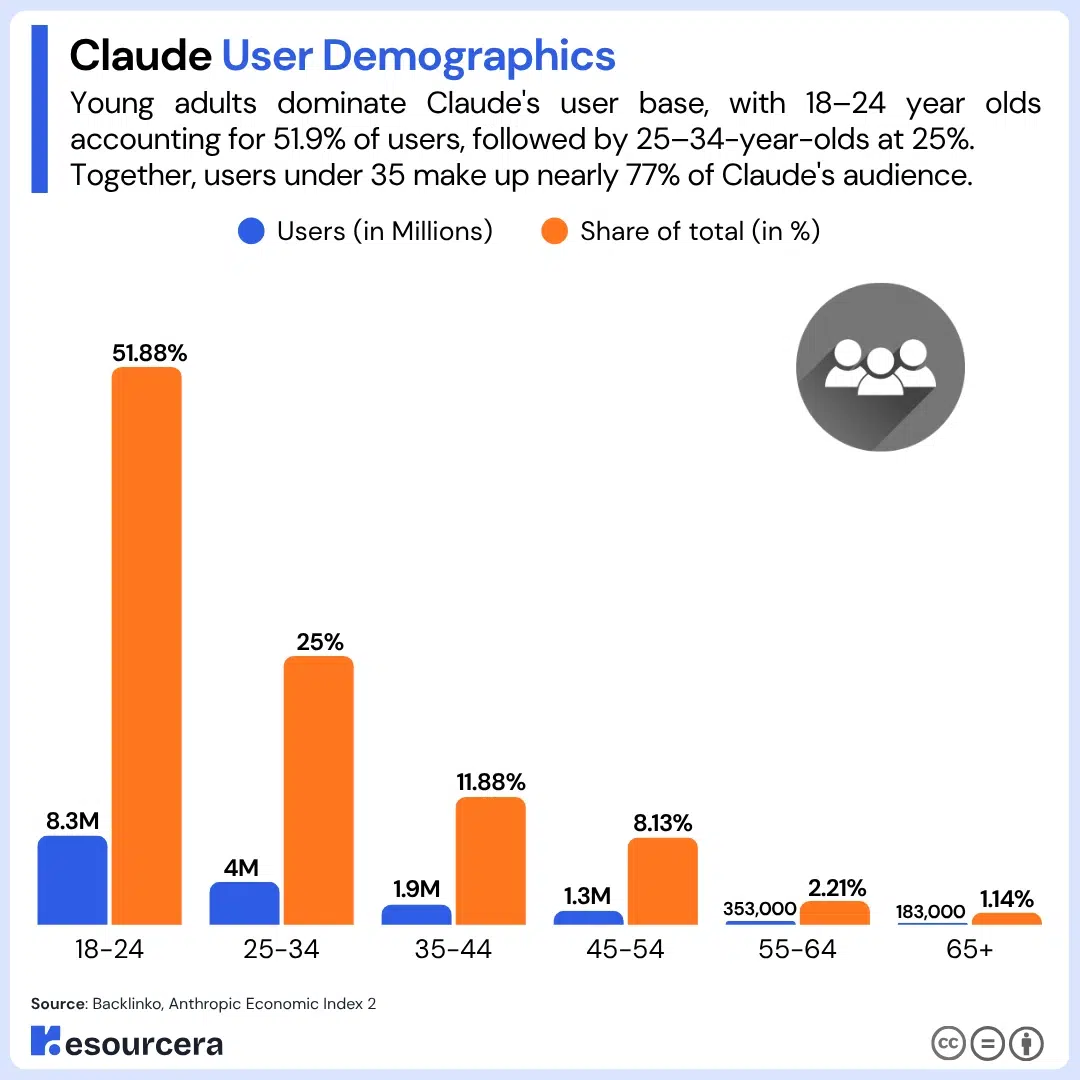
Here is the full age breakdown of Claude’s user base.
| Age group | Users | Share of total |
|---|---|---|
| 18-24 | 8.3 million | 51.88% |
| 25-34 | 4 million | 25% |
| 35-44 | 1.9 million | 11.88% |
| 45-54 | 1.3 million | 8.13% |
| 55-64 | 353,000 | 2.21% |
| 65+ | 183,000 | 1.14% |
Computer and Management Occupations Are Heavily Overrepresented
Computer and mathematical occupations make up roughly 30% of surveyed Claude users, against just 4% of total US employment. Management accounts for 23% of respondents versus 7% of US employment.
The management figure carries an interesting wrinkle. Management occupations represent 23% of Claude’s surveyed user base but only 4% of actual sessions.
Managers are on the platform in large numbers, but they are using Claude for analysis, drafting, and research rather than for management tasks themselves.
Physical occupation categories including transportation, food preparation, and construction are all underrepresented, matching their low share of Claude sessions.
Women and Men Use Claude Differently
Women make up 12% of the surveyed user base and use Claude in measurably different ways than men, even after accounting for occupational differences.
Their share of Claude Code sessions runs 6.3 percentage points lower and their automation share runs 7.3 percentage points lower.
Women instead log more active time in chat and work through tasks more iteratively. That is a collaboration pattern rather than a delegation pattern, and it holds up even when Claude Code usage is controlled for.
Sources: Backlinko, Anthropic Economic Index 2
Claude Paid Users and Business Customers
Anthropic serves more than 300,000 business customers, with over 1,000 accounts spending more than $1 million a year. Two years earlier, the number of $1 million accounts was roughly a dozen.
That progression is the clearest signal in Anthropic’s entire dataset. Accounts spending over $100,000 annually grew roughly 7x year over year, and business subscriptions quadrupled between January and February 2026 alone.
Claude did not grow its enterprise base by adding many small accounts; it grew it by moving existing accounts up the spending ladder.
This table shows Anthropic’s enterprise customer tiers.
| Customer tier | Count | Reporting period |
|---|---|---|
| Total business customers | Over 300,000 | September 2025 |
| Customers running Claude on Amazon Bedrock | Over 100,000 | April 2026 |
| Customers spending $100,000+ annually | Grew 7x year over year | February 2026 |
| Customers spending $1 million+ annually | Over 500 | February 2026 |
| Customers spending $1 million+ annually | Over 1,000 | April 2026 |
| Fortune 10 companies using Claude | 8 of 10 | February 2026 |
| Fortune 100 companies using Claude | Roughly 70% | Early 2026 |
Paid Subscribers More Than Doubled in Under Six Months
Anthropic’s paid consumer subscriber base more than doubled between October 2025 and early 2026. Consumer subscription revenue from the Pro and Max plans reached $1.25 billion in 2025, up from $105 million in 2024.
That is nearly 12x growth in consumer subscription revenue in a single year. It is also the smaller half of the business, which is the point worth holding onto.
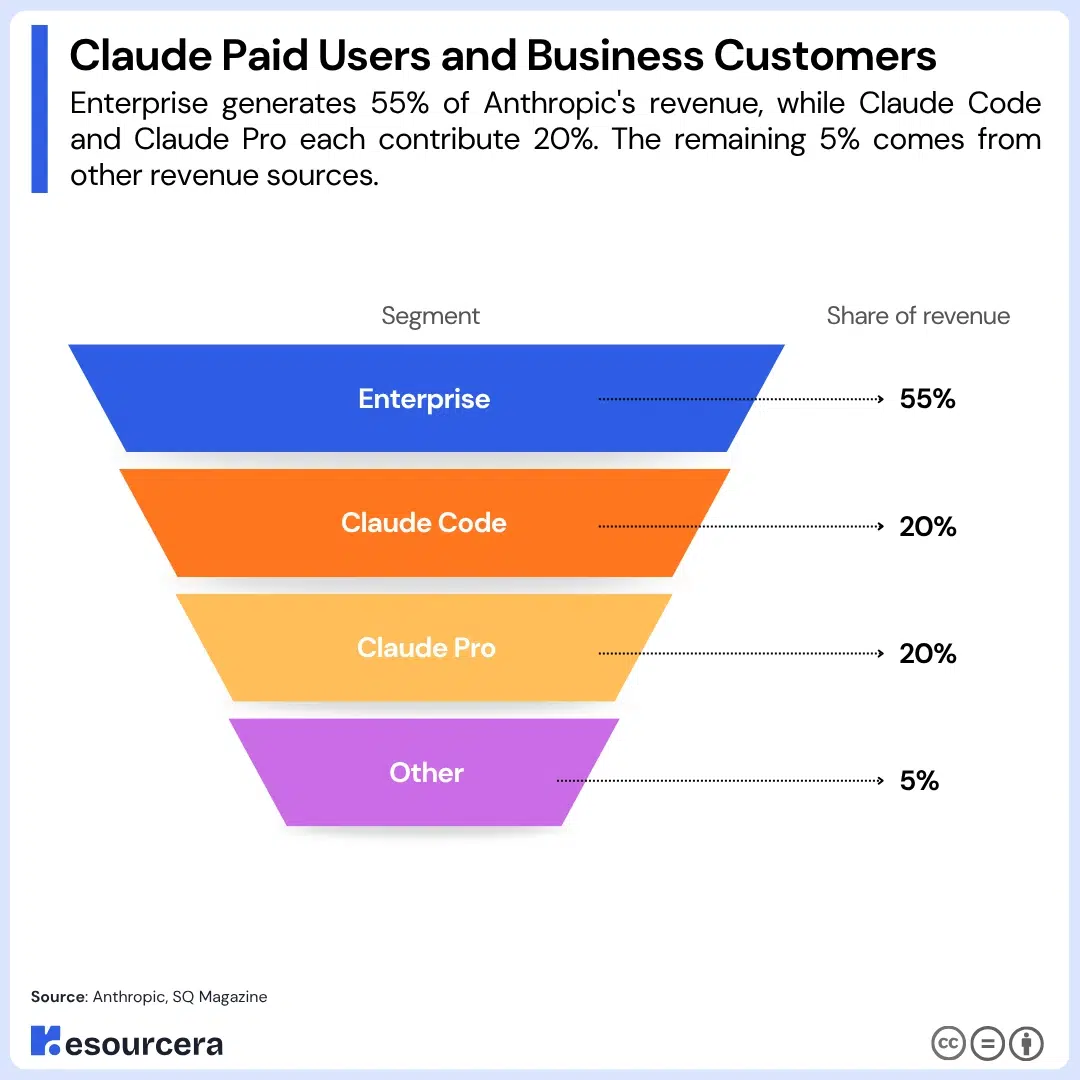
Roughly 80% of Anthropic’s revenue comes from enterprise and API workloads, and only about 20% from consumer subscriptions.
Here is how Anthropic’s revenue splits by product line.
| Segment | Share of revenue |
|---|---|
| Enterprise | 55% |
| Claude Code | 20% |
| Claude Pro | 20% |
| Other | 5% |
Claude Generates Roughly $192 Per Monthly Active User
At $47 billion in annualized revenue across 245 million monthly active users, Claude generates approximately $192 per user per year. The comparable figure for OpenAI is around $23.
That is an 8x premium on a user base a fraction of the size. It is the single number that explains Anthropic’s business model most efficiently.
Claude does not monetize scale; it monetizes intensity, and the paying customers are concentrated in workloads where the output is worth far more than the subscription.
Sources: Anthropic, SQ Magazine, Business of Apps, FatJoe
Claude Usage Statistics: What People Actually Do With It
93% of Claude conversations produce a concrete output. Explanations are the most common at 17% of conversations, followed by documents and reports at 15% and guidance at 11%.
Grouped more broadly, conversational outputs such as explanations and recommendations account for about a third of all conversations.
Written deliverables such as documents and presentations account for another third. Code and technical work make up roughly a sixth.
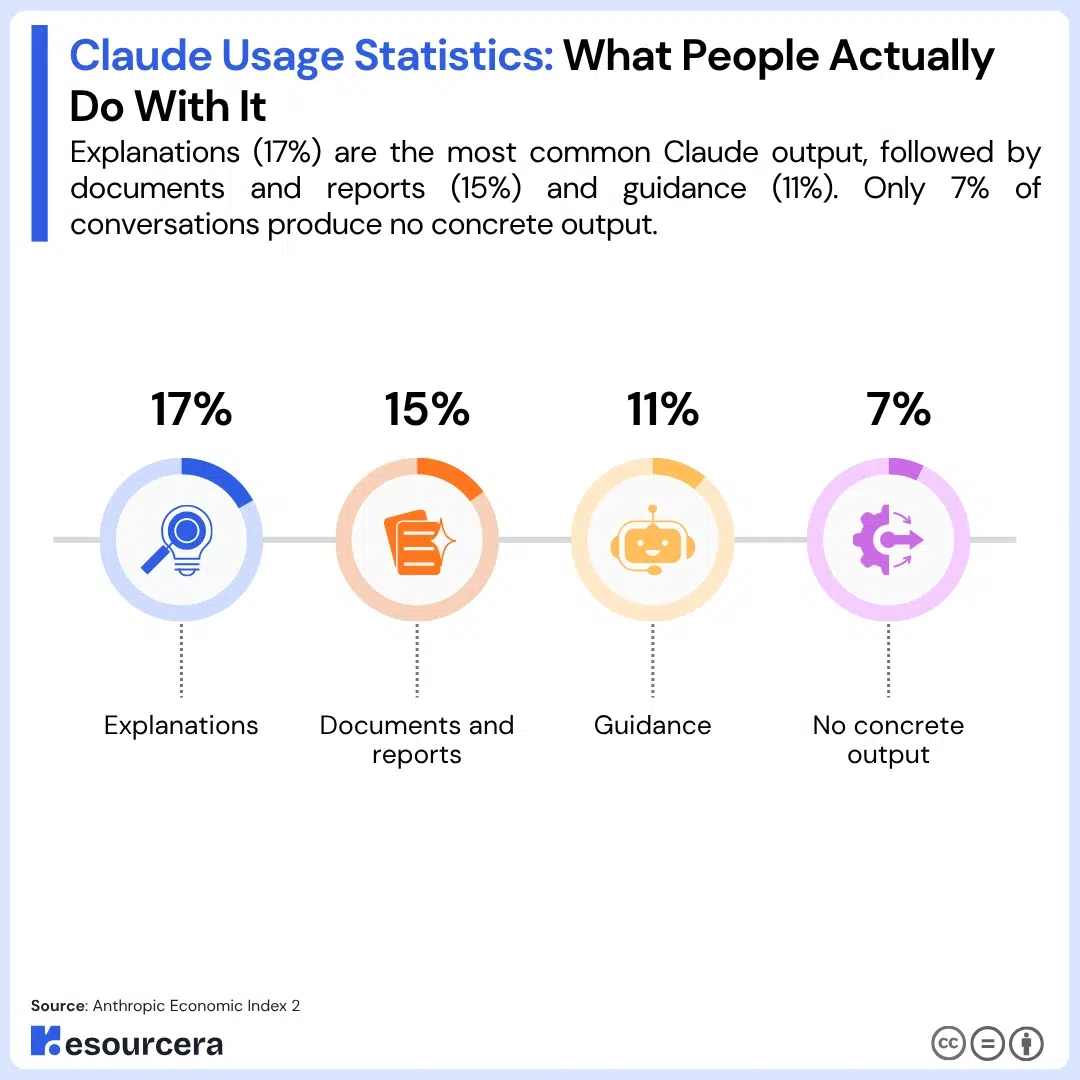
This table shows the most common outputs Claude produces.
| Output type | Share of conversations |
|---|---|
| Explanations | 17% |
| Documents and reports | 15% |
| Guidance | 11% |
| No concrete output | 7% |
Personal Use Now Outweighs Coursework
Personal conversations rose from 35% of Claude.ai usage in November 2025 to 42% in February 2026. Coursework fell from 19% to 12% across the same period.
Part of the coursework decline is seasonal, since the measurement window overlapped with winter breaks in several countries. The drop was 5 percentage points in countries where school terms were active and 12 percentage points where students were on break. The rest reflects a broader shift, as a wave of new signups brought more casual users onto the platform.
Here is the usage split across the two measurement periods.
| Use case | November 2025 | February 2026 |
|---|---|---|
| Personal | 35% | 42% |
| Coursework | 19% | 12% |
Some Outputs Are Almost Entirely Personal, Others Almost Entirely Work
More than 80% of conversations producing creative writing, guidance, or recipes are personal. At the other end, 82% of database query conversations, 81% of blog and article conversations, and 80% of marketing content conversations are work-related.
A few categories split almost evenly. Plans and strategies run 44% work and 49% personal. Translation runs 42% work and 44% personal.
The same output type serves completely different purposes depending on who is asking, and personal planning skews toward travel itineraries and workout schedules while work planning skews toward content and business strategy.
This table shows what each type of conversation tends to produce.
| Conversation type | Most common outputs |
|---|---|
| Work | Documents and reports 20%, explanations 9%, email drafts 7%, analyses and summaries 6% |
| Coursework | Documents and reports 21%, explanations 20%, educational materials 11%, academic papers 6% |
| Personal | Explanations 25%, recommendations 22%, documents 6% |
Claude Usage Follows the Rhythm of the Working Week
Personal conversations rise from around 35% on weekdays to just under 50% on weekends. The shift is largest in high-income countries.
What changes on weekends is the subject matter, not just the volume. Business correspondence, marketing copy, and slide decks give way to emotional support, medical questions, and investment advice.
Inside Claude Code the same pattern appears, with backend architecture and API debugging falling while AI agent design, quantitative trading, and game development rise.
Weekends also appear to create room for new ventures. Conversations about starting a business peak on Saturday and Sunday across every country are measured, even as job application activity falls along with other work tasks.
Usage Peaks at Predictable Hours of the Day
People ask Claude for news at 7 a.m. local time and for recipes at 6 p.m., when recipe requests run 2.3 times more frequent than their daily average. Sleep advice peaks in the hours just before dawn, around 5 a.m.
Business correspondence traces the shape of a normal working day with a slight peak between 10 and 11 a.m. Media recommendations cluster in the evening.
Calendar events show up clearly too, with tax-related conversations on April 14 running eight times higher than an average day in May before dropping sharply on April 16.
Night and weekend work conversations skew toward higher-paid occupations. Tasks tied to the bottom two wage quartiles, including telemarketing and clerical work, fall as a share of total conversations outside standard hours.
Source: Anthropic Economic Index 2
How People Work With Claude
Claude usage divides into automation, where a task is handed over with minimal input, and augmentation, where the user and Claude work through it together.
Augmentation increased slightly on Claude.ai through early 2026, driven by more validation and learning interactions.
The more revealing pattern is what experience does to that split. Long-term users do not delegate more, they collaborate more, which runs against the assumption that sophistication leads to hands-off use.
Users Bring Higher-Value Tasks to the Most Capable Model
Among paying Claude.ai users, 55% of computer and mathematical tasks use the Opus model class, compared with 45% of educational tasks.
Broken down by occupation, 34% of software developer tasks use Opus against just 12% of tutoring tasks.
The relationship holds across the wage scale. For every additional $10 in hourly wage attached to a task, the share of conversations using Opus rises by 1.5 percentage points on Claude.ai.
On the API the same slope is nearly twice as steep at 2.8 percentage points, which suggests developers running programmatic workflows switch models far more deliberately than web users do.
Long-Term Users Have a 10% Higher Success Rate
Users who signed up at least six months ago have a 10% higher conversation success rate than newer users. That advantage survives statistical controls for the specific task, the model used, the language, and the country.
Comparing users within the same narrowly defined task brings the effect down to about 3 percentage points, and adding full controls brings it back up to about 4.
In other words, experienced users are not simply bringing easier work to Claude. They appear to have learned how to get more out of it.
This table shows how high-tenure and low-tenure users differ.
| Behavior | High-tenure users | Difference vs low tenure |
|---|---|---|
| Work-related usage | Higher | 7 percentage points more likely |
| Personal conversations | Lower | 10% fewer |
| Education level of prompts | Higher | 6% higher |
| Conversation success rate | Higher | 10% higher |
| Top 10 tasks as share of usage | 20.7% | Down from 22.2% |
The education gradient is steady enough to measure per year. The schooling level needed to understand a user’s prompt rises by almost a full year for every additional year of Claude usage, while personal use falls from 44% among the newest users to 38% among those a year in.
Higher-Wage Work Consumes More Compute
Conversations mapped to top-tercile occupations consume 2.07 times as many tokens as those mapped to bottom-tercile occupations. Marketing managers earn roughly twice what editors do, at $80 versus $37 per hour, and conversations tied to their tasks use about 2.5 times as many tokens.
The gap comes from both sides of the conversation. Claude produces 1.34 times as much output per turn on higher-wage work, while users take 1.53 times as many turns and switch on extended thinking more often, at 34% of conversations against 31%.
Both sides do more, which reads as labor-augmenting rather than labor-displacing.
Output type accounts for about 44% of that wage gradient. Building an app consumes more than three times the tokens of a median conversation, while a typical explanation uses about a fifth.
Claude Code Sessions Involve Far More Delegation Than Chat
Claude Code sessions show higher AI autonomy than chat and Cowork on 26 of 31 output types, with an average difference of 0.37 points on a five-point scale. For scripts and code snippets the gap widens to 0.53 points.
Blog posts illustrate the difference most sharply. A median chat conversation producing a blog post involves 13 rounds of back and forth.
The median Claude Code session producing the same output contains a single human prompt.
That is not simply a model effect. Opus serves 54% of Claude Code sessions against 10% of chat and Cowork conversations, but the autonomy gap persists even when comparing sessions running on the same model.
Among Sonnet conversations alone, Claude Code still shows 0.26 points more autonomy.
Claude Answers Above the Level It Is Asked
In almost every output category, Claude’s response sits at a higher comprehension level than the prompt that produced it, by roughly one year of education on average. The gap is widest for images and graphics at 2.6 years, games at 1.9 years, and apps and websites at 1.7 years.
Reading level varies widely by what is being produced. Prompts leading to academic papers require more than 16 years of education to understand, roughly bachelor’s level, and 15% of those conversations sit at PhD level or above. Conversations producing recipes or guidance need fewer than 10 years.
Where the gap nearly vanishes is audience-facing writing. Blogs run 0.1 years below the prompt, academic papers are level, and email sits 0.3 years above. In those cases the prompt usually contains draft language written in the same register as the intended output.
Sources: Anthropic Economic Index 1, Anthropic Economic Index 2
What Claude Users Expect From AI at Work
More than a third of Claude users expect AI to handle most or nearly all of their work tasks within 12 months. Close to 6 in 10 expect that share to be higher next year than it is today.
The expectations are strikingly uniform across occupations. A software engineer and a construction manager anticipate roughly the same increment of progress inside their own profession over the next year, even though their starting points differ sharply.
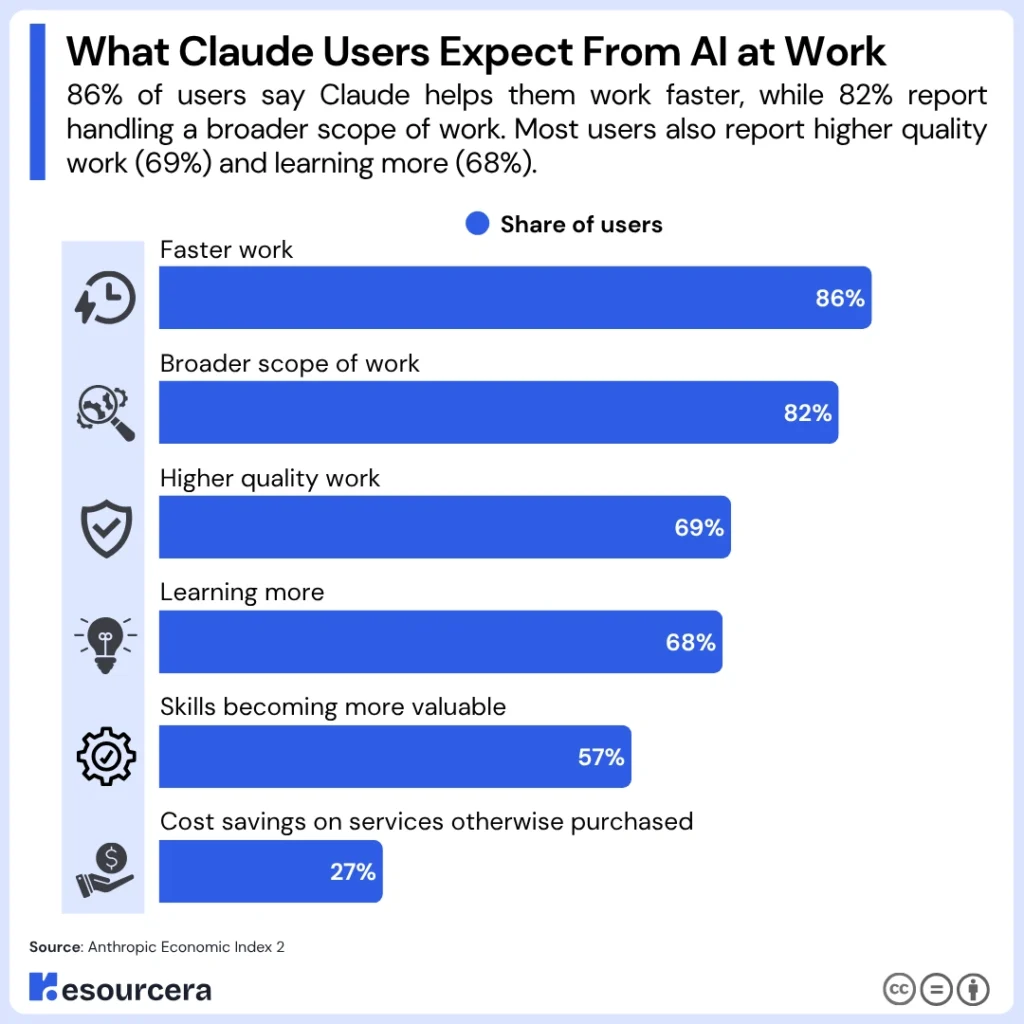
Reported productivity gains are broad and large.
| Reported outcome | Share of users |
|---|---|
| Faster work | 86% |
| Broader scope of work | 82% |
| Higher quality work | 69% |
| Learning more | 68% |
| Skills becoming more valuable | 57% |
| Cost savings on services otherwise purchased | 27% |
Heavy Delegators Are the Most Optimistic, Not the Least
Users who hand entire tasks to Claude report more positive expectations across all six measured dimensions of job quality, including pay, job security, ability to find a new job, meaning, autonomy, and human interaction.
The largest effects appear on expected pay and job-finding ability.
This runs against the common assumption that the people delegating most to AI would feel most threatened by it. It also does not show the skill atrophy that delegation is often assumed to cause.
Heavy delegators report learning at the same rate as everyone else, though the share reporting that AI is increasing the market value of their skills rises with automation share.
Concern Concentrates on Others, and on the Young
10% of users rate losing their own job in the next year as likely or very likely, and 38% of that group attributes the forecast to AI. More than a third put the probability of a junior colleague losing their job above 60%.
Users are consistently more worried for others than for themselves, and more worried about job loss in lower-income countries than in high-income ones.
Experience shapes perception too. Workers with at least 15 years in their field put the share of tasks AI can do roughly 10 percentage points lower than those in their first year, most often citing judgment, contextual awareness, and relationship management as things AI cannot replicate.
Asked what they hope an AI-shaped economy looks like in ten years, over half of users described collaboration with AI on meaningful work. Just over half hoped for automation of the tedious parts of their jobs. About a third named shared prosperity.
Source: Anthropic Economic Index 2
Claude Code Statistics
Claude Code reached over $2.5 billion in annualized run-rate revenue by February 2026, nine months after general availability. It crossed $500 million within its launch quarter and $1 billion within six months.
That trajectory made Claude Code roughly 18% of Anthropic’s entire $14 billion run-rate at the time, from a product line that did not exist eighteen months earlier. Weekly active users doubled in the first six weeks of 2026 alone.
Here are Claude Code’s revenue milestones.
| Milestone | Annualized run-rate | Time since launch |
|---|---|---|
| September 2025 | Over $500 million | Launch quarter |
| Late 2025 | $1 billion | Six months |
| February 2026 | Over $2.5 billion | Nine months |
Claude Code Writes 4% of All Public GitHub Commits
Claude Code authors an estimated 4% of all public commits on GitHub worldwide, double its share a year earlier. Projections put that figure above 20% by the end of 2026.
The 4% is the verified number and it is already meaningful. AI is now a measurable contributor to global software output rather than a peripheral assistant, and Claude Code is the single largest identifiable contributor within that group.
Developer sentiment matches the usage. Claude Code was rated the most loved AI coding tool by 46% of respondents in a February 2026 survey of 15,000 developers, ahead of GitHub Copilot, Cursor, and JetBrains AI Assistant.
Sources: SQ Magazine, TechnologyChecker
Anthropic Revenue and Market Growth
Anthropic’s annualized revenue run-rate crossed $47 billion in May 2026, up from approximately $1 billion at the end of 2024. That is 47 times growth in about 17 months, or roughly 25% compounding every month.
The pace accelerated rather than tapering. Revenue took eight months to move from $1 billion to $5 billion, then four months to reach $9 billion, then just five months to go from $9 billion to $47 billion. The last leg alone was a 5.2x increase.
This table shows every disclosed run-rate milestone.
| Reporting date | Annualized run-rate | Growth from prior milestone |
|---|---|---|
| End of 2024 | $1 billion | Baseline |
| August 2025 | $5 billion | 5x |
| December 2025 | $9 billion | 1.8x |
| February 2026 | $14 billion | 1.6x |
| March 2026 | $19 billion | 1.4x |
| April 2026 | $30 billion | 1.6x |
| Early May 2026 | $44 billion | 1.5x |
| Mid-May 2026 | $47 billion | 1.1x |
Run-rate and calendar revenue are different measures and both appear in Anthropic reporting. On a calendar basis Anthropic generated about $6 billion across 2025, against $0.7 billion in 2024, with most of the 2025 total landing in the second half as enterprise usage ramped.
Anthropic Is Targeting Its First Profitable Quarter
Anthropic is on track for its first profitable quarter in Q2 2026, with projected revenue of roughly $10.9 billion for the quarter and operating profit of around $559 million.
The company has set a run-rate target of $50 billion or more by the end of July 2026.
These are projections rather than reported results, and they should be read as such. What makes them notable is the gap against Anthropic’s own guidance.
The company’s stated full-year 2026 revenue guidance was $15 billion, a figure the April run-rate had already passed twice over.
Sources: Anthropic 3, VentureBeat, FatJoe, Business of Apps
Anthropic Funding and Valuation
Anthropic is valued at $965 billion following its $65 billion Series H, announced on May 28, 2026. That put it ahead of OpenAI’s $852 billion valuation for the first time, a 13% premium over its closest competitor.
The Series H closed just 105 days after the Series G. Across that window Anthropic’s valuation rose 154%, from $380 billion to $965 billion. Measured from the Series F in September 2025, the increase is 427% in eight months.
Here is Anthropic’s complete valuation history.
| Date | Valuation |
|---|---|
| December 2023 | $18.4 billion |
| March 2025 | $61.5 billion |
| September 2025 | $183 billion |
| February 2026 | $380 billion |
| May 2026 | $965 billion |
The funding history behind those valuations spans nine disclosed rounds.
| Date | Amount | Lead investors |
|---|---|---|
| October 2023 | $2 billion | |
| January 2024 | $750 million | Menlo Ventures |
| March 2024 | $884 million | ATIC, MVP |
| May 2024 | $452 million | G Squared, MVP |
| November 2024 | $4 billion | Amazon |
| January 2025 | $2 billion | |
| March 2025 | $3.5 billion | Lightspeed Venture Partners |
| September 2025 | $13 billion | ICONIQ, Fidelity, Lightspeed |
| February 2026 | $30 billion | GIC, Coatue |
| April 2026 | Up to $40 billion committed | |
| May 2026 | $65 billion | Altimeter, Dragoneer, Greenoaks, Sequoia |
The Series H included $15 billion of previously committed hyperscaler investment, with $5 billion of that coming from Amazon. Memory and chip suppliers Micron, Samsung, and SK Hynix also joined the round, which reads as supply chain alignment as much as financing.
Anthropic Filed for an IPO in June 2026
Anthropic filed a confidential draft S-1 with the SEC on June 1, 2026, targeting an October 2026 Nasdaq listing. The filing came one week ahead of OpenAI’s own confidential filing.
The listing is being led by Goldman Sachs, JPMorgan, and Morgan Stanley, with the company reportedly seeking to raise more than $60 billion. If it prices anywhere near the Series H valuation, it would be among the largest technology listings ever attempted.
Sources: Anthropic 3, Business of Apps, FatJoe
Claude Market Share in 2026
Anthropic holds 40% of enterprise spending on large language models, ahead of OpenAI at 27% and Google at 21%. Together those three account for 88% of enterprise LLM API usage.
The share reversal happened quickly. Anthropic went from 12% to 40% of enterprise spend in two years, a 28 percentage point gain, while OpenAI fell from 50% to 27% across the same window. Google was the fastest riser in relative terms, going from 7% to 21%.
This table shows enterprise LLM spend shared by the provider.
| Provider | 2023 | 2024 | 2025 |
|---|---|---|---|
| Anthropic | 12% | 24% | 40% |
| OpenAI | 50% | Not disclosed | 27% |
| 7% | Not disclosed | 21% |
The category itself expanded at the same time. Enterprise spending on generative AI reached $37 billion in 2025, up from $11.5 billion in 2024, a 3.2x increase.
Anthropic gained share inside a market that more than tripled, which is a rarer combination than either event alone.
Open-source models continue to lose ground in this segment, accounting for 13% of enterprise daily workloads by mid-2025, down from 19% at the start of that year.
Claude Holds 54% of the Enterprise Coding Model Market
Claude commands an estimated 54% of the enterprise coding model market, against 21% for OpenAI. That is up from 42% just six months earlier, a 12 percentage point gain in a category that was already concentrated.
Anthropic has held the top position on coding leaderboards since Claude 3.5 Sonnet launched in June 2024, an 18-month run at the time of measurement. The coding lead is the widest single-vendor advantage in any LLM workload category, and it is the clearest explanation for why enterprise spend followed.
Claude’s Web Traffic Share Grew Nearly 6x in a Year
Claude’s share of global generative AI web traffic reached 8.9% in May 2026, up from 1.6% a year earlier. That is a 5.6x increase and the largest single-platform gain in the tracked set.
The share moved fast within 2026 alone, from 2.22% in December 2025 to 6.02% in March and 8.9% by late May. In the United States specifically Claude’s web visit share is higher still at 13.4%, which reflects how concentrated its usage remains in its home market.
Here is how the generative AI web traffic market divides.
| Platform | 12 months earlier | May 2026 |
|---|---|---|
| ChatGPT | 76.4% | 52.7% |
| Gemini | 8.9% | 27.3% |
| Claude | 1.6% | 8.9% |
| DeepSeek | – | 4.0% |
| Grok | – | 2.8% |
| Copilot | – | 2.0% |
| Perplexity | – | 1.3% |
Claude Took 17% of the US Mobile Chatbot Market in Six Months
Claude holds roughly 17% of US mobile chatbot daily active user share as of June 2026, up from under 2% in December 2025. That is an 8.5x increase in six months.
US mobile daily active users grew 1,100% year to date. The gains came largely at the expense of ChatGPT and Copilot, while Gemini held steady around 25% and Grok plateaued.
This table shows the US mobile chatbot daily active user share.
| Platform | December 2025 | April 2026 | June 2026 |
|---|---|---|---|
| ChatGPT | ~50% | 38.1% | Falling further |
| Gemini | ~22% | ~25% | ~25% |
| Claude | Under 2% | 13.1% | ~17% |
| Grok | 14% | 13.5% | Plateaued |
| Copilot | ~10% | ~10% | Down ~60% year to date |
Claude Has Ranked Second in Generative AI for 191 Consecutive Days
Claude has held the number two position in generative AI service rankings by DNS traffic for 191 consecutive days, from January 22 to August 1, 2026. Only ChatGPT ranks higher.
Two things are worth noting about that ranking. It measures absolute traffic rank across the entire category rather than percentage share, so it answers a different question than the web traffic table above. And the third position is not stable in the way the top two are, alternating between Perplexity and Gemini across the period.
Sources: Menlo Ventures, SQ Magazine, FatJoe, TechnologyChecker
Claude Engagement Statistics
Claude users average 34.7 minutes per daily session, the highest per-user engagement of any major AI platform. Power users on mobile spend more than two hours a day inside the app.
Engagement at that depth is harder for a competitor to displace than raw user counts. It also explains the revenue-per-user gap, since the users doing two hours of daily work in Claude are the same users converting to paid plans.
Two-Thirds of Claude Users Also Use ChatGPT
65.8% of Claude users also use ChatGPT, up from 58.3% in January 2026. Meanwhile the share of ChatGPT users who also use Claude rose from 1.4% to 3.7%.
The asymmetry is the story here. Claude is not replacing ChatGPT in people’s routines, it is being added alongside it. Overlap with Grok’s user base rose 171% year to date to 11.1%, following the same pattern.
Here is how cross-platform overlap shifted through 2026.
| Overlap measure | January 2026 | May 2026 |
|---|---|---|
| Claude users who also use ChatGPT | 58.3% | 65.8% |
| ChatGPT users who also use Claude | 1.4% | 3.7% |
| Claude users who also use Grok | 4.1% | 11.1% |
Mobile Now Accounts for 54% of Claude Usage
Mobile made up 54% of Claude’s total usage by early 2026, reversing the web-heavy pattern of 2024. That share already sits above the general web baseline in Claude’s largest market.
The underlying device landscape varies sharply by country, which matters for where Claude’s mobile growth comes from next. US web traffic runs 70.8% desktop, while India runs 60% mobile.
| Market | Desktop share | Mobile share |
|---|---|---|
| United States | 70.8% | 29.2% |
| Global | 59.9% | 40.1% |
| United Kingdom | 56.7% | 43.2% |
| India | 40.0% | 60.0% |
Sources: TechnologyChecker, FatJoe
ClaudeBot Web Crawler Statistics
ClaudeBot accounted for 16.28% of AI bot traffic in July 2026, ranking second behind Googlebot. It outcrawled GPTBot by 6.54 percentage points, roughly a 1.7 to 1 margin.
Anthropic runs two separate crawlers, which matters for anyone writing robots.txt rules. ClaudeBot handles training and Claude-SearchBot handles navigational search inside Claude. Claude-SearchBot first appeared in raw telemetry in May 2026 at 2.22% and reached 3.54% by July, so blocking one does not block the other.
This table shows AI crawler shares month by month through 2026.
| Month | ClaudeBot | GPTBot | Googlebot | Meta-ExternalAgent | Bytespider | ClaudeBot rank |
|---|---|---|---|---|---|---|
| January | 11.58% | 12.73% | 38.21% | 11.07% | 3.55% | 3 |
| February | 10.40% | 12.94% | 35.94% | 14.27% | 3.28% | 4 |
| March | 11.86% | 12.01% | 31.66% | 16.38% | 3.58% | 4 |
| April | 11.69% | 9.84% | 30.28% | 14.91% | 5.73% | 3 |
| May | 9.73% | 11.48% | 27.26% | 13.23% | 10.25% | 5 |
| June | 19.77% | 9.40% | 25.18% | 10.20% | 7.65% | 2 |
| July | 16.28% | 9.74% | 24.52% | 12.65% | 5.14% | 2 |
The month-to-month volatility is the honest headline. ClaudeBot led in April, lost the lead in May, nearly doubled in June to reach 19.77%, then gave back 3.48 points in July. The lead has changed hands three times in four months, so any single month’s ranking is a weak forecast.
ClaudeBot Overtook GPTBot Year Over Year
ClaudeBot’s crawl share rose 45% between July 2025 and July 2026, from 11.23% to 16.28%. Across the same window GPTBot fell 26%, from 13.15% to 9.74%.
That is an 8.47 point swing in the gap between the two. A year ago GPTBot led by 1.93 points, and now ClaudeBot leads by 6.54. Googlebot is the other half of the story, having shed 18.17 points of share, most of which went to Anthropic and Meta rather than OpenAI.
Here is the year-over-year comparison across all major crawlers.
| Crawler | July 2025 | July 2026 | Change |
|---|---|---|---|
| Googlebot | 42.69% | 24.52% | -18.17 points |
| ClaudeBot | 11.23% | 16.28% | +5.05 points |
| Meta-ExternalAgent | 8.44% | 12.65% | +4.20 points |
| GPTBot | 13.15% | 9.74% | -3.41 points |
| Bingbot | 10.30% | 8.92% | -1.38 points |
Anthropic’s Crawl-to-Referral Ratio Improved 20x in a Year
Anthropic crawled 1,917 pages for every referral it sent back in July 2026, improving from 38,744 to 1 a year earlier. That is a roughly 20x improvement in twelve months.
It is still the weakest return among operators sending referrals at any real scale. OpenAI reads 251 to 1 and Google reads 5 to 1, so Anthropic returns roughly 7.6 times less traffic per page crawled than OpenAI and 400 times less than Google.
The direction matters more than the level for publishers deciding crawl policy. The ratio fell from 13,528 to 1 in April to 3,386 to 1 in June to 1,917 to 1 in July, and Claude-SearchBot’s steady climb suggests Anthropic is building toward a product that returns traffic rather than only consuming it.
| Operator | Crawl-to-referral ratio, July 2026 |
|---|---|
| 5 to 1 | |
| OpenAI | 251 to 1 |
| Anthropic | 1,917 to 1 |
ClaudeBot Activity Varies 9x Between Markets
ClaudeBot is the second most active crawler in the United States at 15.65% of AI bot requests, but only the eighth most active in India at 1.67%. That is a roughly 9x spread between Claude’s two largest user markets.
Adding Claude-SearchBot, Anthropic’s combined crawler footprint reaches 18.91% in the US and 16.48% globally. The pattern follows Claude’s usage geography closely, with heavy crawling where the high-value commerce and technology web sits.
| Market | ClaudeBot | Claude-SearchBot | Combined | ClaudeBot rank |
|---|---|---|---|---|
| United States | 15.65% | 3.26% | 18.91% | 2 |
| Global | 13.65% | 2.83% | 16.48% | 2 |
| United Kingdom | 8.79% | Below 2% | 8.79%+ | 5 |
| India | 1.67% | Below 2% | 1.67%+ | 8 |
Source: TechnologyChecker
Claude Model Release Timeline
Anthropic shipped five major Claude releases in 2025, up from three in 2024. The average gap between releases fell from about 140 days to about 73, and 2026 has run faster still with five releases inside roughly ten weeks in the spring.
Release cadence maps closely onto the revenue and crawl inflections elsewhere in this article. Each release triggers a fresh round of training crawls, enterprise evaluation runs, and the migration projects that follow once procurement signs off.
Here is the complete Claude release history.
| Date | Model | Tier | Notable change |
|---|---|---|---|
| March 4, 2024 | Claude 3 (Opus, Sonnet, Haiku) | Family launch | Three-tier structure and vision capabilities |
| June 20, 2024 | Claude 3.5 Sonnet | Sonnet | Outperformed the larger Opus 3 on benchmarks |
| October 22, 2024 | Claude 3.5 Sonnet upgrade and 3.5 Haiku | Sonnet and Haiku | Computer use public beta |
| February 24, 2025 | Claude 3.7 Sonnet | Sonnet | Hybrid reasoning and extended thinking |
| May 22, 2025 | Claude Sonnet 4 and Opus 4 | Sonnet and Opus | Version 4 launch |
| September 29, 2025 | Claude Sonnet 4.5 | Sonnet | Agentic coding, 30+ hour sustained tasks |
| October 15, 2025 | Claude Haiku 4.5 | Haiku | Fast, low-cost tier refresh |
| November 24, 2025 | Claude Opus 4.5 | Opus | End-of-year capstone, halved token usage on coding |
| February 5, 2026 | Claude Opus 4.6 | Opus | First 2026 release |
| February 17, 2026 | Claude Sonnet 4.6 | Sonnet | Matched Opus 4.5 on coding benchmarks |
| April 16, 2026 | Claude Opus 4.7 | Opus | Stronger agents, 3x vision resolution |
| Late May 2026 | Claude Opus 4.8 | Opus | Improved agentic task completion and long context |
| June 9, 2026 | Claude Fable 5 and Mythos 5 | Mythos | First Mythos-class models |
| June 30, 2026 | Claude Sonnet 5 | Sonnet | Lower-cost, highly agentic mid-size model |
Anthropic moved Sonnet 4.6 and Opus 4.6 to a 1 million token context window at standard pricing on March 13, 2026, retiring the earlier beta tier. That ended the context window gap that had defined Claude versus ChatGPT comparisons since 2024, since OpenAI followed with a comparable tier weeks later.
Current API pricing runs $1 and $5 per million input and output tokens for Haiku 4.5, $3 and $15 for Sonnet 4.6, and $5 and $25 for Opus 4.7.
Fable 5 Was Suspended Worldwide by Government Order Three Days After Launch
Anthropic launched Claude Fable 5 on June 9, 2026, and the US Commerce Department ordered it taken offline on June 12. It returned globally on July 1, after roughly two and a half weeks of negotiation.
The directive required Anthropic to block all access to Fable 5 and Mythos 5 for any foreign national anywhere in the world, including Anthropic’s own foreign-national employees.
Because real-time filtering by nationality was not possible across its global infrastructure, Anthropic disabled both models for every customer worldwide. All other Claude models remained available throughout.
The reported trigger was a claimed jailbreak of Fable 5’s cybersecurity safety classifiers, which by design route flagged cyber, biology, and chemistry queries to Opus 4.8 in under 5% of sessions. Export controls were lifted on June 30 following a bipartisan congressional letter and open letters from researchers. Mythos 5 access was restored to vetted partners on June 26.
This appears to be the first time a government has used export-control authority to force the shutdown of a commercially deployed frontier AI model. For anyone modeling AI platform risk, it is a more consequential data point than any single usage metric in this article, because it establishes that a model at this capability level can be switched off worldwide within days of launch.
Sources: TechnologyChecker, FatJoe, SQ Magazine
Final Thoughts
Claude in 2026 is two products wearing one name. There is a 245 million user consumer platform growing at 26% a month, and there is a $47 billion enterprise business where 300,000 companies and 1,000 seven-figure accounts generate roughly 80% of the revenue.
The consumer side explains the user charts. The enterprise side explains the $965 billion valuation.
The number that ties them together is $192 per monthly active user per year, more than eight times OpenAI’s equivalent. Claude has never won on reach and does not need to.
It won 40% of enterprise LLM spend and 54% of the coding model market while holding under 9% of consumer web traffic, which is a strategy rather than an accident.
The open question for the rest of 2026 is whether the consumer surge holds. Growing from under 2% to 17% of US mobile chatbot share in six months is the kind of move that either compounds or reverts, and the crawler data already shows Anthropic’s metrics swinging hard month to month.
With an October IPO in view and a $50 billion run-rate target for July, the next two quarters will show whether Claude’s consumer numbers become a second business or remain a funnel into the first one.