


As of 2026, there are 1.02 million ecommerce stores in the United Kingdom. Globally, this number falls to around 24.56 million ecommerce stores in total. That means 4.17% of total ecommerce stores are British.
The UK store count has grown 35.40% since 2020. Back then, the country had 756,000 online stores. 2026 is the first year the UK has passed one million online stores count.
This post covers how many UK stores there are, who they run on, what they sell, and how UK shoppers buy.
Let’s get straight into it.
Top Ecommerce Store Statistics In The UK: At A Glance 2026
- There are 1.02 million ecommerce stores in the United Kingdom in 2026.
- 4.17% of the world’s 24.56 million ecommerce stores are based in the UK.
- The UK added 49,360 new stores in 2026, a 5.1% rise on 2025.
- Wix Stores powers 24.19% of UK ecommerce stores, the largest share of any platform.
- The UK has the second-highest store count of any country, behind the United States.
- UK online retail sales reached £132.5 billion in 2025.
- 27.4% of all UK retail spending went online in 2025, one of the highest shares in the world.
- The average UK online order was worth £123.37 in July 2026.
- 62.3% of UK ecommerce sales happen on a mobile phone.
- UK stores have a cart abandonment rate of 77%, the fourth lowest of any tracked country.
How Many Ecommerce Stores Are There In The United Kingdom?
There are 1.02 million ecommerce stores in the United Kingdom in 2026. That is 4.17% of the 24.56 million ecommerce stores in the world.
The store count has grown 35.40% since 2020, when the UK had 756,000 stores. The UK crossed one million online stores for the first time in 2026.
Source: BuiltWith
UK Ecommerce Store Growth By Year
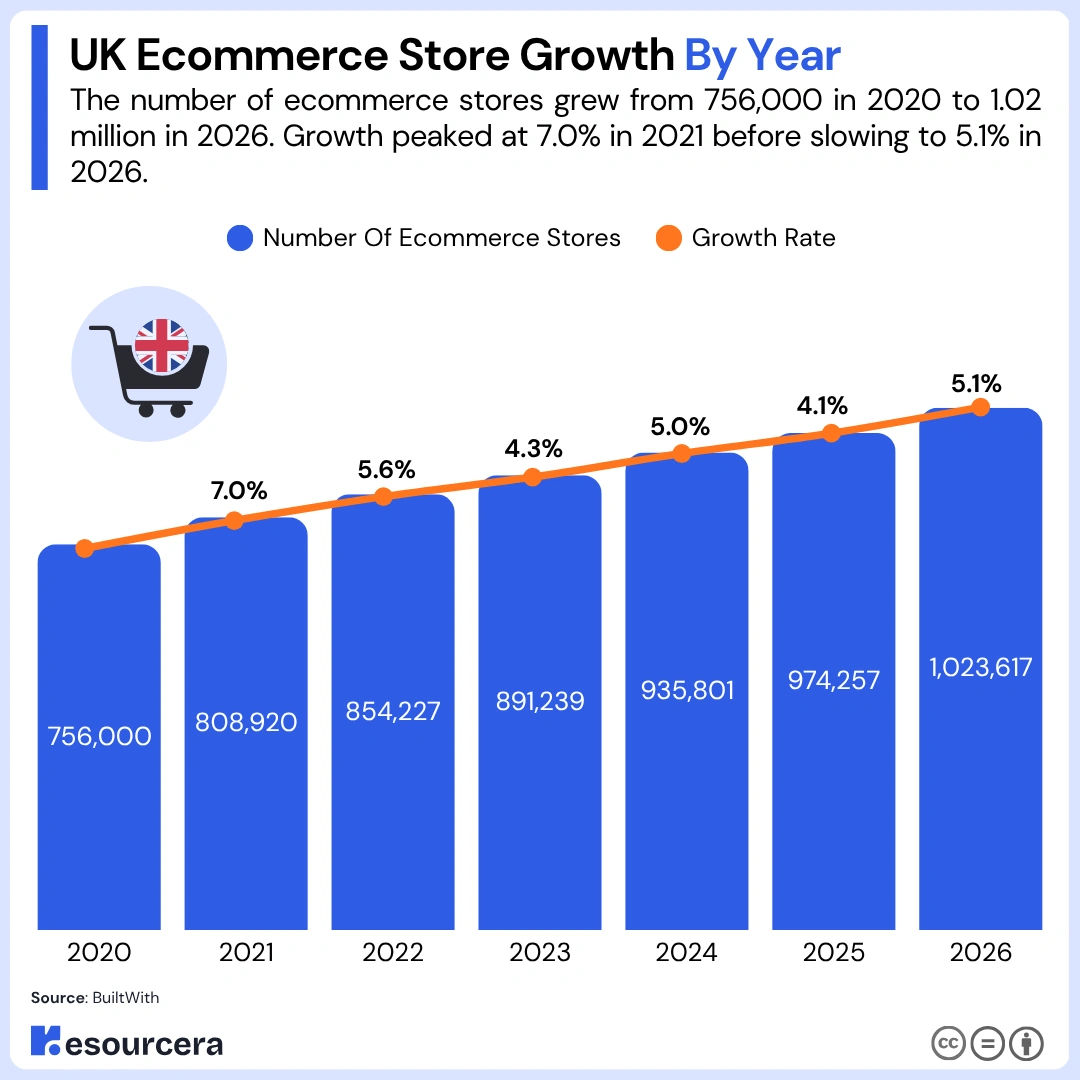
The UK added 49,360 ecommerce stores in 2026, which is a 5.1% rise from 2025. The store count has grown every year since 2020, and the pace has been far steadier than in the United States.
| Year | Number Of Ecommerce Stores | Growth Rate |
|---|---|---|
| 2026 | 1,023,617 | 5.1% |
| 2025 | 974,257 | 4.1% |
| 2024 | 935,801 | 5.0% |
| 2023 | 891,239 | 4.3% |
| 2022 | 854,227 | 5.6% |
| 2021 | 808,920 | 7.0% |
| 2020 | 756,000 | – |
2021 remains the fastest growth year in the series at 7.0%, driven by the post-pandemic boom in online selling. Growth then slowed to 4.3% in 2023 before picking up again in 2024 and 2026. The UK has never seen the double-digit swings the US recorded between 2021 and 2023.
Source: BuiltWith
Ecommerce Platform Market Share In The UK
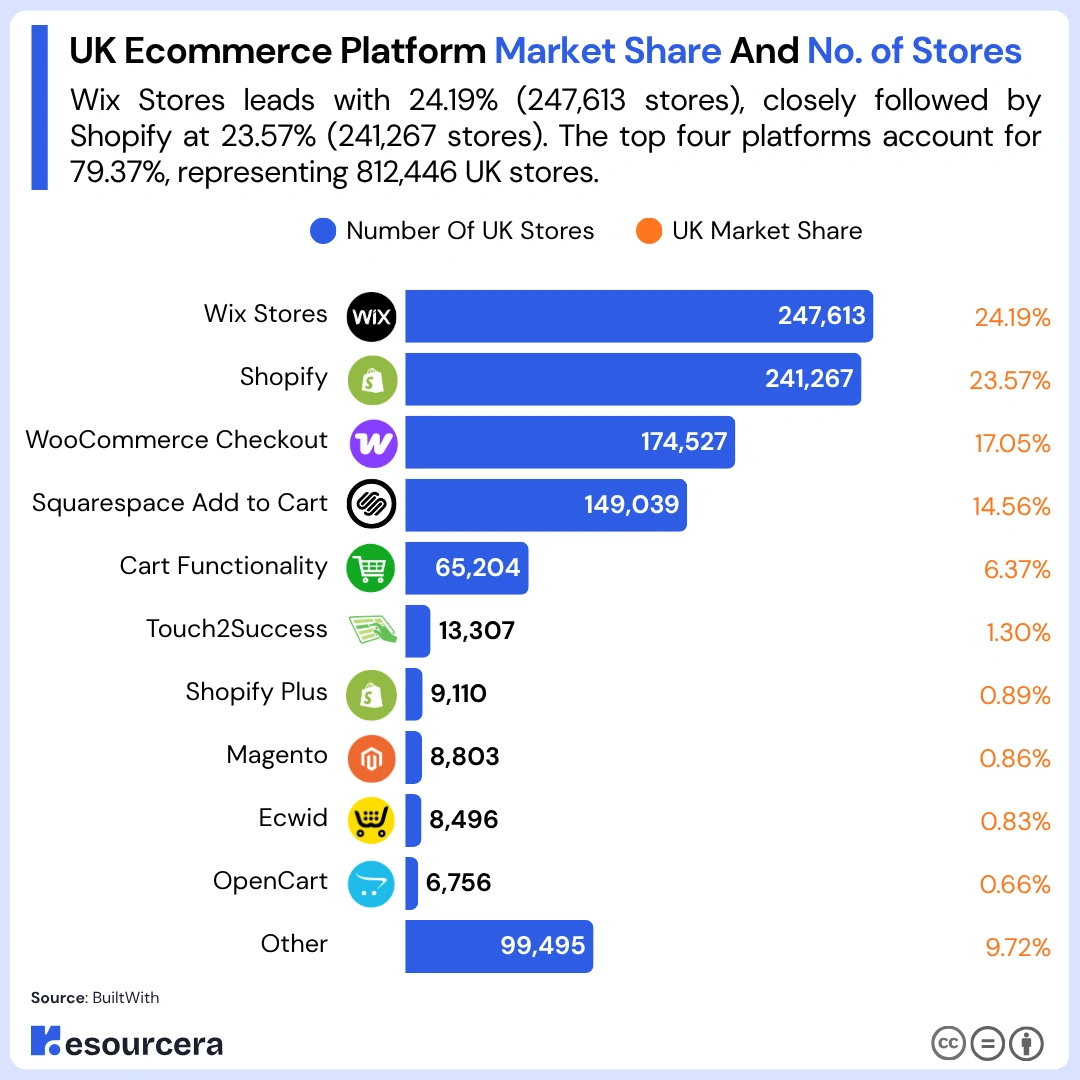
Wix Stores is the most used ecommerce platform in the United Kingdom with a 24.19% market share in 2026.
Shopify ranks second at 23.57%, and WooCommerce Checkout ranks third at 17.05%. The top three platforms together power 64.81% of all UK ecommerce stores.
Here is a quick look at eCommerce platforms’ market share in the UK:
| Ecommerce Platform | UK Market Share |
|---|---|
| Wix Stores | 24.19% |
| Shopify | 23.57% |
| WooCommerce Checkout | 17.05% |
| Squarespace Add to Cart | 14.56% |
| Cart Functionality | 6.37% |
| Touch2Success | 1.30% |
| Shopify Plus | 0.89% |
| Magento | 0.86% |
| Ecwid | 0.83% |
| OpenCart | 0.66% |
| Other | 9.72% |
| Total | 100.00% |
Wix Stores runs 247,613 stores in the UK, just 6,346 ahead of second-placed Shopify. The table below shows the e-commerce platforms with the number of stores in the UK:
| Ecommerce Platform | Number Of UK Stores |
|---|---|
| Wix Stores | 247,613 |
| Shopify | 241,267 |
| WooCommerce Checkout | 174,527 |
| Squarespace Add to Cart | 149,039 |
| Cart Functionality | 65,204 |
| Touch2Success | 13,307 |
| Shopify Plus | 9,110 |
| Magento | 8,803 |
| Ecwid | 8,496 |
| OpenCart | 6,756 |
| Other | 99,495 |
| Total | 1,023,617 |
This is the clearest difference between the UK and the United States. Shopify leads the US with a 28.89% share and sits more than a million stores ahead of Wix. In the UK, the two are almost level, and Wix is in front.
WooCommerce is also stronger in the UK. It holds 17.05% of British stores against 12.50% in the United States, so a larger slice of the UK market is running on self-hosted WordPress rather than a hosted platform.
Source: BuiltWith
Which Country Has The Most Ecommerce Stores?
The United States has the most ecommerce stores of any country, with 13.63 million stores in 2026. The United Kingdom ranks second with 1.02 million stores. The US has 13.3 times more stores than the UK.
The UK is the only country outside the United States with more than a million online stores. It sits ahead of Germany, Australia, Brazil, Canada and France.
| Country | Ecommerce Stores | Share Of Global Total |
|---|---|---|
| United States | 13,631,536 | 55.50% |
| United Kingdom | 1,023,617 | 4.17% |
| Germany | 597,737 | 2.43% |
| Australia | 584,926 | 2.38% |
| Brazil | 565,940 | 2.30% |
| Canada | 462,896 | 1.88% |
| France | 445,731 | 1.81% |
| India | 418,539 | 1.70% |
| Russia | 336,666 | 1.37% |
| Italy | 284,885 | 1.16% |
The top ten countries hold 74.72% of the world’s ecommerce stores. The UK holds 4.17% of the global total on its own, more than Germany and Australia put together.
For the full picture on the largest market, see our report on ecommerce sales in the United States.
Source: BuiltWith
How Much Revenue Do UK Ecommerce Stores Generate?
UK online retail sales reached £132.5 billion in 2025, up 4.4% from £126.9 billion in 2024. Sales in the first half of 2026 came to £71.4 billion, an 11.2% rise on the same period a year earlier.
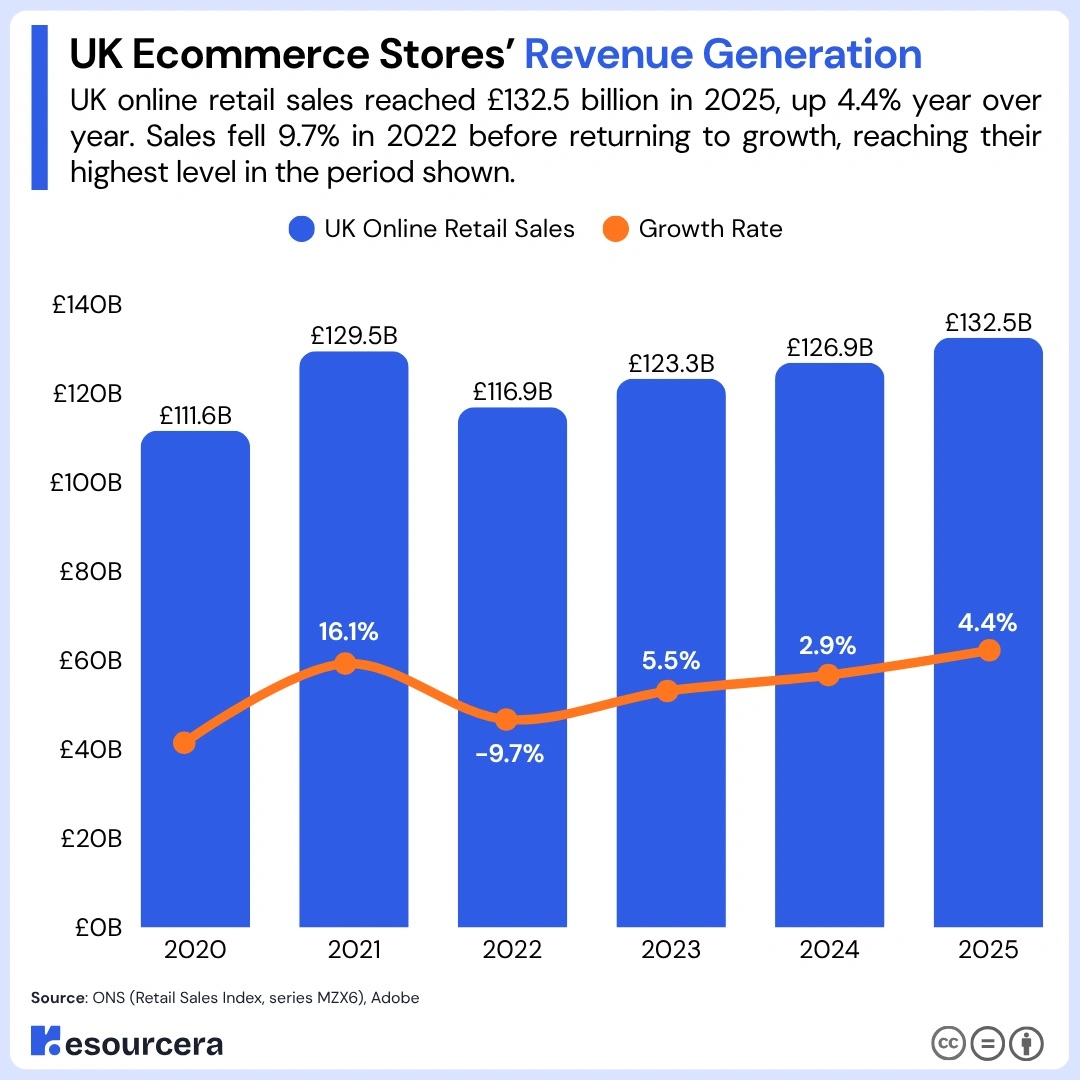
UK online sales have grown 18.7% since 2020, when stores sold £111.6 billion. In 2025, sales worked out to an average of about £129,400 per store.
| Year | UK Online Retail Sales | Growth Rate |
|---|---|---|
| 2025 | £132.5 billion | 4.4% |
| 2024 | £126.9 billion | 2.9% |
| 2023 | £123.3 billion | 5.5% |
| 2022 | £116.9 billion | -9.7% |
| 2021 | £129.5 billion | 16.1% |
| 2020 | £111.6 billion | – |
2022 is the only fall in the series. Shoppers went back to physical stores once pandemic restrictions ended, and online spending did not pass its 2021 level again until 2024.
These are Office for National Statistics retail sales figures. They cover goods sold online by British retailers, seasonally adjusted and excluding automotive fuel, and are calculated from the ONS average weekly internet sales series.
Adobe Analytics measures the same market a different way, by tracking online transactions rather than retailer returns. It put total UK online spend at £118.5 billion in 2025, up 2.8% on 2024 and a record.
For the full quarterly and yearly breakdown globally, see our report on ecommerce statistics.
Sources: ONS (Retail Sales Index, series MZX6), Adobe
How Much Of All UK Retail Now Happens Online?
27.4% of all UK retail spending went online in 2025. That is one of the highest online shares of any major economy and more than double the 12.5% recorded in 2015.
The share has held between 26% and 28% for four years. It peaked at 37.8% in January 2021, during lockdown, then settled at a level about eight percentage points above where it started in 2019.
| Year | Online Share Of UK Retail Sales |
|---|---|
| 2025 | 27.4% |
| 2024 | 27.1% |
| 2023 | 26.7% |
| 2022 | 26.6% |
| 2021 | 30.7% |
| 2020 | 28.1% |
| 2019 | 19.2% |
November is always the strongest month. Online took 32.3% of UK retail spending in November 2025, the highest monthly reading since November 2021, before easing back to 27.4% in July 2026.
This matters for store owners because the easy growth is over. The share of shopping that moves online is no longer climbing, so extra revenue now has to come from spending more per shopper rather than from shoppers switching channels.
Source: ONS (Retail Sales Index, series J4MC)
How Concentrated Is The UK Ecommerce Market?
Amazon takes close to 30% of all UK ecommerce spending, and the ten largest players hold about 50% between them, according to IRP Commerce. That leaves roughly a third of the market for independent small and mid-sized merchants.
IRP works from a £200 billion UK ecommerce market. On that basis, independent stores are competing for around £60 billion of annual online sales. The rest sits with a handful of marketplaces and national chains.
Amazon is the largest online retailer in the UK by net sales, followed by eBay and Tesco. Those three names alone shape how most British shoppers expect delivery, returns and pricing to work, which sets the bar every independent store has to clear.
Sources: IRP Commerce, ecommerceDB
How Much Do Shoppers Spend Per Order In The UK?
The average order value (AOV) for a UK ecommerce order was £123.37 in July 2026, up 0.41% on the same month a year earlier. Order values have been close to flat for a year.
The average price of a single item sold rose much faster, from £56.82 to £63.71 over the same twelve months, a 12.12% rise. UK shoppers are buying fewer but more expensive items in each basket.
Conversion improved at the same time, from 1.94% to 2.26% of sessions. Visitor numbers fell 13.86%, so UK stores are converting a smaller audience more efficiently.
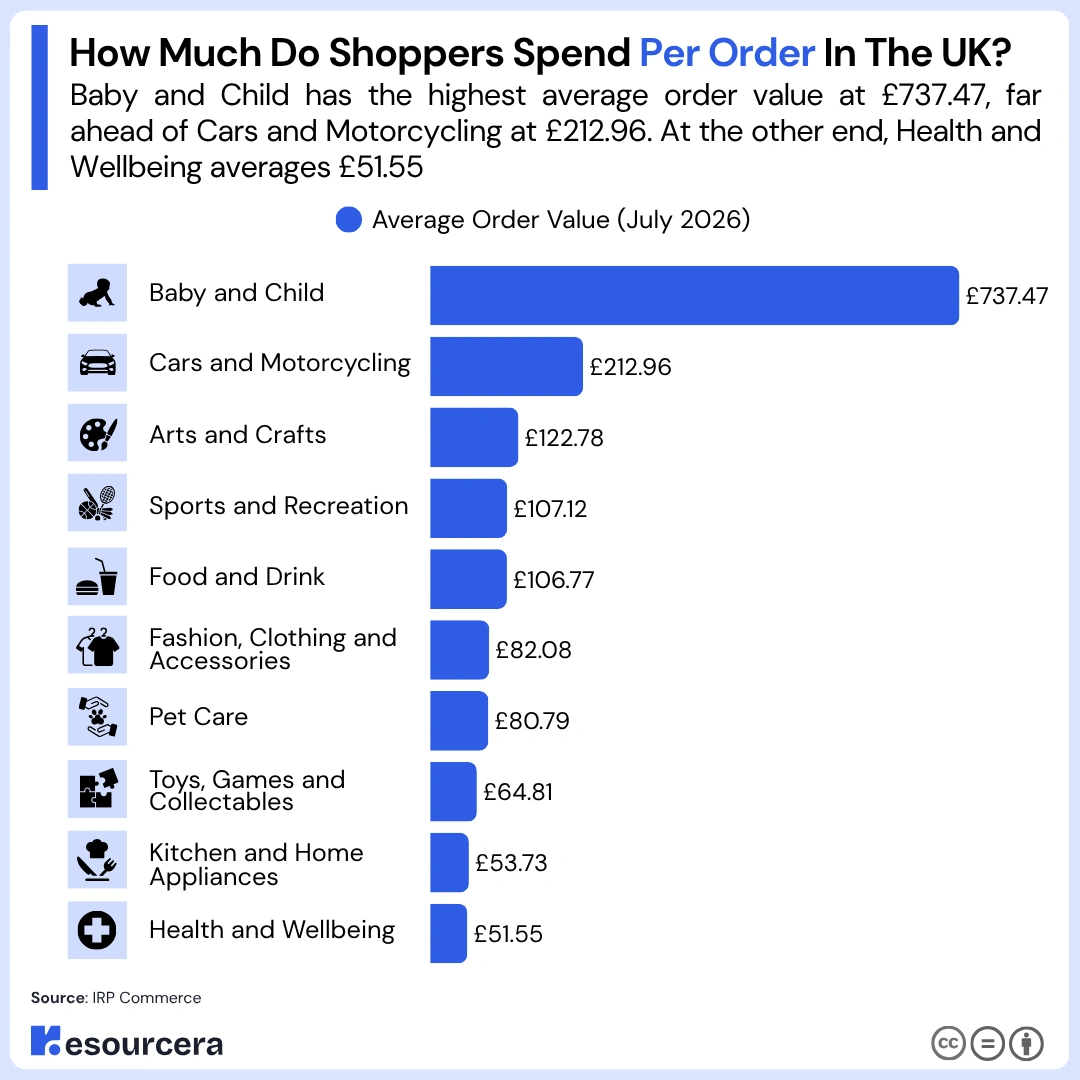
AOV varies a lot by product category:
| Category | Average Order Value (July 2026) |
|---|---|
| Baby and Child | £737.47 |
| Cars and Motorcycling | £212.96 |
| Arts and Crafts | £122.78 |
| Sports and Recreation | £107.12 |
| Food and Drink | £106.77 |
| Fashion, Clothing and Accessories | £82.08 |
| Pet Care | £80.79 |
| Toys, Games and Collectables | £64.81 |
| Kitchen and Home Appliances | £53.73 |
| Health and Wellbeing | £51.55 |
Fashion is the largest single category in UK stores and sits well below the all-market average at £82.08. It also grew fastest of any category, up 21.23% year on year. Pet Care fell hardest, down 19.67%.
Source: IRP Commerce
How Much Of UK Ecommerce Happens On Mobile?
62.3% of UK ecommerce sales happen on a mobile phone. Desktop accounts for 36.3% and tablets for 1.4%.
| Device | Share Of UK Ecommerce Sales |
|---|---|
| Mobile | 62.3% |
| Desktop | 36.3% |
| Tablet | 1.4% |
Adobe Analytics, working from a different sample, put mobile at 61.5% of UK online spend across November and December 2025. That was £16.5 billion, up 14.1% on 2024.
The two measures land in the same place. Roughly six in every ten pounds spent on a UK online store now comes from a phone. That is well ahead of the United States, where mobile accounts for 44.6% of ecommerce sales.
Sources: IRP Commerce, Adobe
Where UK Ecommerce Stores Get Their Sales From
Paid search is the single biggest source of sales for UK ecommerce stores by a wide margin. It drove 62.5% of sales in July 2026, ahead of direct traffic at 21.2% and email marketing at 9.2%.
| Traffic Channel | Share Of UK Ecommerce Sales |
|---|---|
| Paid Search Marketing | 62.5% |
| Direct | 21.2% |
| Email Marketing | 9.2% |
| Affiliate Marketing | 4.7% |
| Other | 2.0% |
| Paid Social Media Marketing | 0.4% |
Google PPC alone accounted for 60.67% of sales at a cost per acquisition of 11.70%. Email was the cheapest channel by a long way at 0.84%, and affiliate sales through AWIN more than doubled year on year.
More than four in every ten pounds taken by UK stores now come from outside the UK. International sales made up 42.2% of total sales in July 2026, up from 40.87% a year earlier. That export share is one of the things that separates the British market from the American one, where domestic demand is large enough that most stores never need to sell abroad.
Source: IRP Commerce
UK Ecommerce Return Rates
Shoppers send back 23.6% of everything they buy from UK clothing stores online, according to the 2025/2026 ZigZag Annual Returns Research Report, produced with Retail Economics. The research is based on buying and returning items from each of the UK’s top 100 fashion retailers rather than on a survey.
Around one in five online purchases in the UK is returned across all categories. The highest rates sit in clothing, footwear and beauty, where sizing and fit drive most of the volume.
Returns are expensive to handle. ZigZag estimates that processing a single return costs a UK retailer between £10 and £20 once logistics, repackaging and lost sales are counted. The total cost of online returns in the UK passed £27 billion in 2024.
That cost is why paid returns spread so quickly across British fashion retail. Charging for a return protects margin, but it also removes the free safety net that made bracketing normal in the first place.
Sources: ZigZag Global, Retail Economics
AI Adoption Among UK Ecommerce Stores
80% of UK retailers expect their online sales to grow faster in 2026 because of AI, according to the Ecommerce Delivery Benchmark Report 2026 from Metapack and Retail Economics. The report surveyed more than 8,000 consumers and 400 retailers across eight markets.
Spending is as follows. 90% of retailers globally plan to increase AI investment over the next 12 to 24 months, with the money going into delivery execution, predictive fulfilment and returns management.
Adoption is uneven. Only 17% of European retailers have AI embedded and scaled across multiple functions, against 28% in North America. 36% of European retailers name keeping pace with AI as a major challenge for 2026.
The barriers differ by size. Retailers turning over more than £500 million point to skills gaps and the difficulty of connecting AI to legacy systems (54%). Retailers under £100 million point to development costs (35%) and data security concerns.
UK shoppers are further ahead than UK retailers. British consumers are the most confident in Europe about AI-assisted shopping, with 64% saying they trust AI shopping tools. Almost half of UK adults under 45 already use AI for product research, price comparison and delivery searches, and 30% are open to an AI agent buying on their behalf.
Chat platforms are now a genuine retail channel. ChatGPT and similar tools generate 50.2 million shopping-intent visits a month in the UK, which puts them alongside the country’s biggest ecommerce sites.
Adobe measured what that did to store traffic. Referrals to UK retail sites from AI sources grew 329% year on year over the 2025 holiday period, and AI referrals on Boxing Day were up 685% on 2024.
Adyen found UK consumer adoption of AI shopping tools more than doubled in a year, from 12% to nearly 28%. Gen Z leads at 43%, followed by Millennials at 42%.
Sources: Metapack and Retail Economics, Adobe, Adyen
How UK Shoppers Pay Online
Buy now, pay later accounts for 8% of all online and in-store point-of-sale payments in the UK, and UK Finance expects that to reach 9% by 2030.
25% of UK adults used BNPL at least once in 2024, up from 14% in 2023. The average BNPL purchase in the UK is £114, a little under the average online order value.
The market has grown very fast. FCA figures show deferred payment credit lending rose from £0.06 billion in 2017 to more than £13 billion in 2024.
The rules changed in 2026. Deferred payment credit came under Financial Conduct Authority regulation on 15 July 2026, which brought affordability checks, complaints rights and upfront disclosure to a product that had grown up outside consumer credit law. Any UK store offering third-party BNPL at checkout is now working with a regulated lender.
Cash has all but disappeared from UK retail. It made up 9% of all payments in 2024, down from 48% in 2014.
Sources: UK Finance, FCA
Black Friday And The Christmas Peak On UK Stores
UK shoppers spent a record £26.9 billion online across November and December 2025, up 4.1% on the year before. That was the highest online Christmas period on record.
| Peak Trading Period (2025) | UK Online Spend |
|---|---|
| November and December total | £26.9 billion |
| Cyber Weekend (four days) | £3.8 billion |
| Black Friday | £1.16 billion |
| Boxing Day | More than £500 million |
Black Friday was the single biggest online shopping day of the year. Boxing Day passed £500 million for the first time, as shoppers switched from buying gifts for other people to buying for themselves.
Peak also changes what people buy. Across November and December, the share of the most expensive items sold was 14% higher than across the rest of 2025. Deeper discounts pushed UK shoppers to trade up rather than down, which is the opposite of how they behave for the other ten months of the year.
Source: Adobe
Cart Abandonment Rate For Ecommerce Stores In The UK
Ecommerce stores in the UK have a cart abandonment rate of 77% in 2026. That means 77 out of every 100 online shoppers who add an item to their cart leave without completing the purchase.
That is better than the global average of 83% and better than the United States, which sits at 83%.
The UK is one of the strongest performing markets tracked. Only the Netherlands, Switzerland and Belgium do better. Shoppers in Mexico, South Korea, Spain, Australia, Ireland, Canada, France and Italy all abandon more often.
| Year | Global Average Cart Abandonment Rate |
|---|---|
| 2026 | 70.22% |
| 2025 | 70.19% |
| 2024 | 70.19% |
| 2023 | 70.19% |
| 2022 | 69.99% |
| 2021 | 69.82% |
| 2020 | 69.80% |
Mexico has the highest cart abandonment rate of any tracked country at 93%. Switzerland has the lowest at 60%.
Here is a table showing the cart abandonment rate across countries:
| Country / Region | Cart Abandonment Rate |
|---|---|
| Mexico | 93% |
| South Korea | 88% |
| Spain | 88% |
| Australia | 87% |
| Ireland | 87% |
| Canada | 85% |
| France | 85% |
| Italy | 85% |
| Global | 83% |
| Poland | 83% |
| Portugal | 83% |
| UAE | 83% |
| USA | 83% |
| New Zealand | 81% |
| Germany | 80% |
| Nordics | 79% |
| Japan | 78% |
| UK | 77% |
| Belgium | 76% |
| Netherlands | 66% |
| Switzerland | 60% |
Sources: Statista and Baymard Institute
As ecommerce continues to evolve, AI is playing a growing role in shaping online shopping and business operations. Explore our AI in ecommerce statistics for the latest data and trends.
Future Outlook For UK Ecommerce Stores
The UK store count has grown every year since 2020 and passed one million for the first time in 2026. The country holds the second-largest store base in the world and the only one outside the United States above a million.
Sales are at a record too, with £132.5 billion in 2025 and £71.4 billion in the first half of 2026. Three shifts are worth watching from here.
First, the online share of UK retail has stopped climbing and settled near 27%, so growth now has to come from spending more per shopper rather than from moving more shopping online.
Second, AI is starting to route orders to stores in a way that did not exist a year ago, with referrals to UK retail sites from AI sources up 329% over the last holiday period.
Third, BNPL came under FCA regulation in July 2026. Around one pound in every twelve spent at a UK checkout now moves through a product that has just been brought inside consumer credit law.
We will update this page as new store count data is released.
Also Read: How Many Ecommerce Stores Are There in Germany?
Frequently Asked Questions On UK Ecommerce Stores
How many ecommerce stores are there in the United Kingdom?
There are 1.02 million ecommerce stores in the United Kingdom in 2026.
How many ecommerce stores are there in the world?
There are 24.56 million ecommerce stores in the world in 2026.
What share of the world’s ecommerce stores are in the UK?
4.17% of all ecommerce stores in the world are based in the United Kingdom.
What is the most used ecommerce platform in the UK?
Wix Stores is the most used ecommerce platform in the UK with a 24.19% market share. It powers 247,613 British stores. Shopify is a close second at 23.57%.
How much do UK ecommerce stores sell each year?
UK online retail sales reached £132.5 billion in 2025. Sales in the first half of 2026 came to £71.4 billion.
What share of UK retail happens online?
27.4% of all UK retail spending went online in 2025. The share peaked at 37.8% in January 2021 and has held between 26% and 28% since 2022.
What share of UK ecommerce goes through Amazon?
Amazon takes close to 30% of UK ecommerce spending, and the ten largest players hold about half the market between them.
What is the average order value for a UK ecommerce store?
The average order value for a UK online store was £123.37 in July 2026.
What percentage of UK online orders get returned?
23.6% of orders from UK online clothing retailers are returned, according to the 2025/2026 ZigZag Annual Returns Research Report. Around one in five online purchases is returned across all categories.
How many UK ecommerce merchants use AI?
80% of UK retailers expect AI to accelerate their online sales growth in 2026, and 90% of retailers globally plan to increase AI spending over the next 12 to 24 months. Only 17% of European retailers have AI scaled across multiple functions.
What is the cart abandonment rate for UK ecommerce stores?
UK ecommerce stores have a cart abandonment rate of 77%. The global average across 50 studies is 70.22%.
How many ecommerce stores did the UK have in 2020?
The UK had 756,000 ecommerce stores in 2020. The count has grown 35.40% since then.
Where do UK ecommerce stores get most of their sales from?
Paid search drives 62.5% of sales for UK ecommerce stores, ahead of direct traffic at 21.2% and email at 9.2%. International shoppers account for 42.2% of total sales.
