

The platform continues to grow steadily, with billions in advertising revenue, and remains the first choice for marketers worldwide. Meta reported $200.96 billion in revenue in 2025, with 86% of global marketers actively using Facebook as part of their strategy.
Below, we have compiled the most comprehensive breakdown of Facebook statistics for 2026, based on content reach, user demographic distribution, and advertising performance.
Read on to know more.
Key Facebook Statistics for 2026
- Facebook has 3.12 billion monthly active users as of 2026.
- Around 2.17 billion people use Facebook daily.
- Facebook Messenger has 1.01 billion monthly active users.
- 86% of global marketers use Facebook for marketing.
- 76% of women internet users use Facebook, compared to 59% of men.
- 39% of people using Facebook are millennials.
- 68% of the adults in the United States use Facebook.
- Meta (Facebook) generated around $200.96 billion in revenue.
- As of Q1 2026, Meta reached a revenue of $56.31 billion.
How Many People Use Facebook in 2026?
Facebook has around 3.12 billion users globally as of 2026, an increase of 1.7% from the previous year.
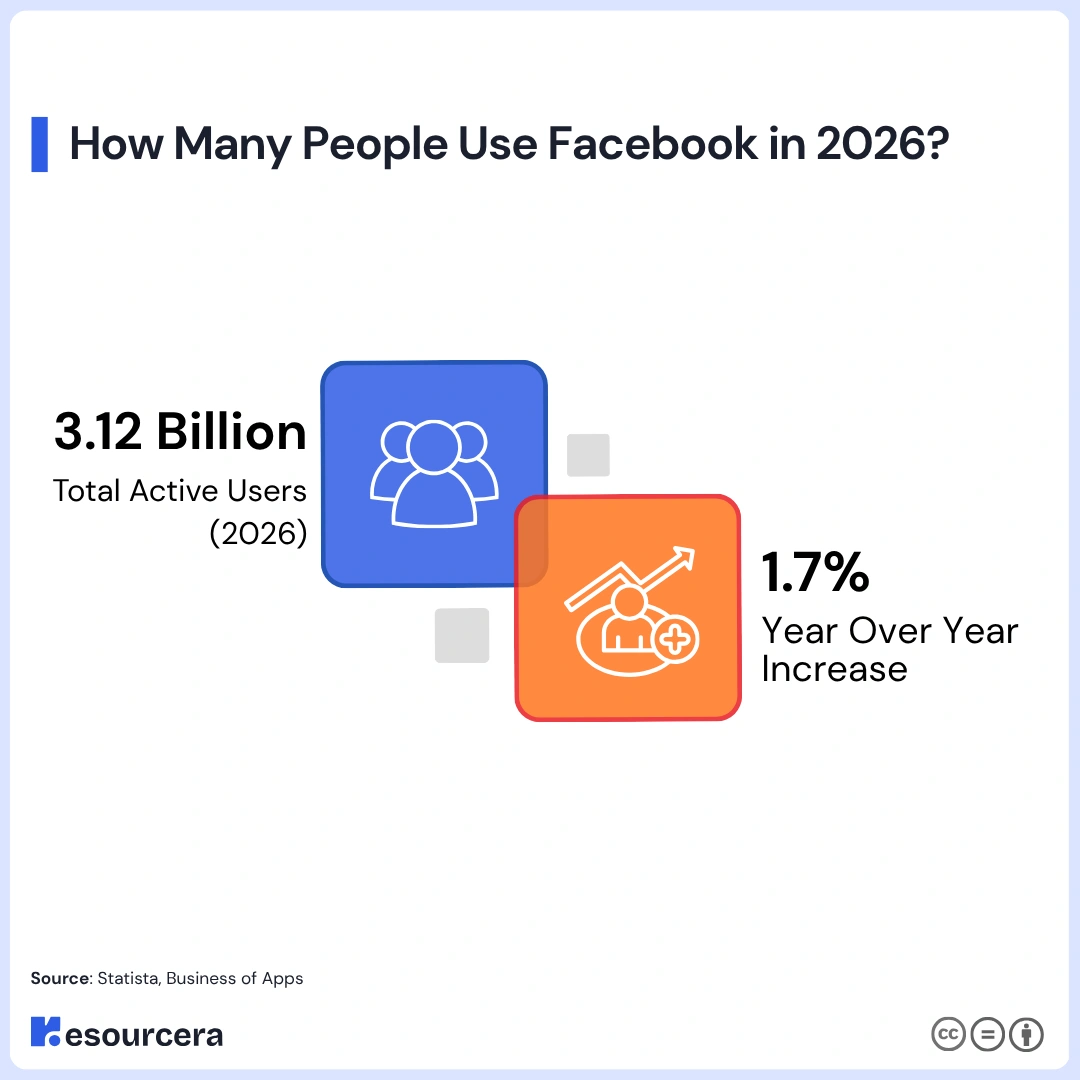
This means that 60% of the social media users and 56.1% of the internet population around the world are on Facebook.
Facebook is also the first social media platform to reach 3 billion users and is estimated to cross the 4 billion mark in 2031.
Facebook Monthly Active Users
Each month, around 3.12 billion people use Facebook. To put that in perspective, the platform now reaches nearly 40% of the global population every single month.
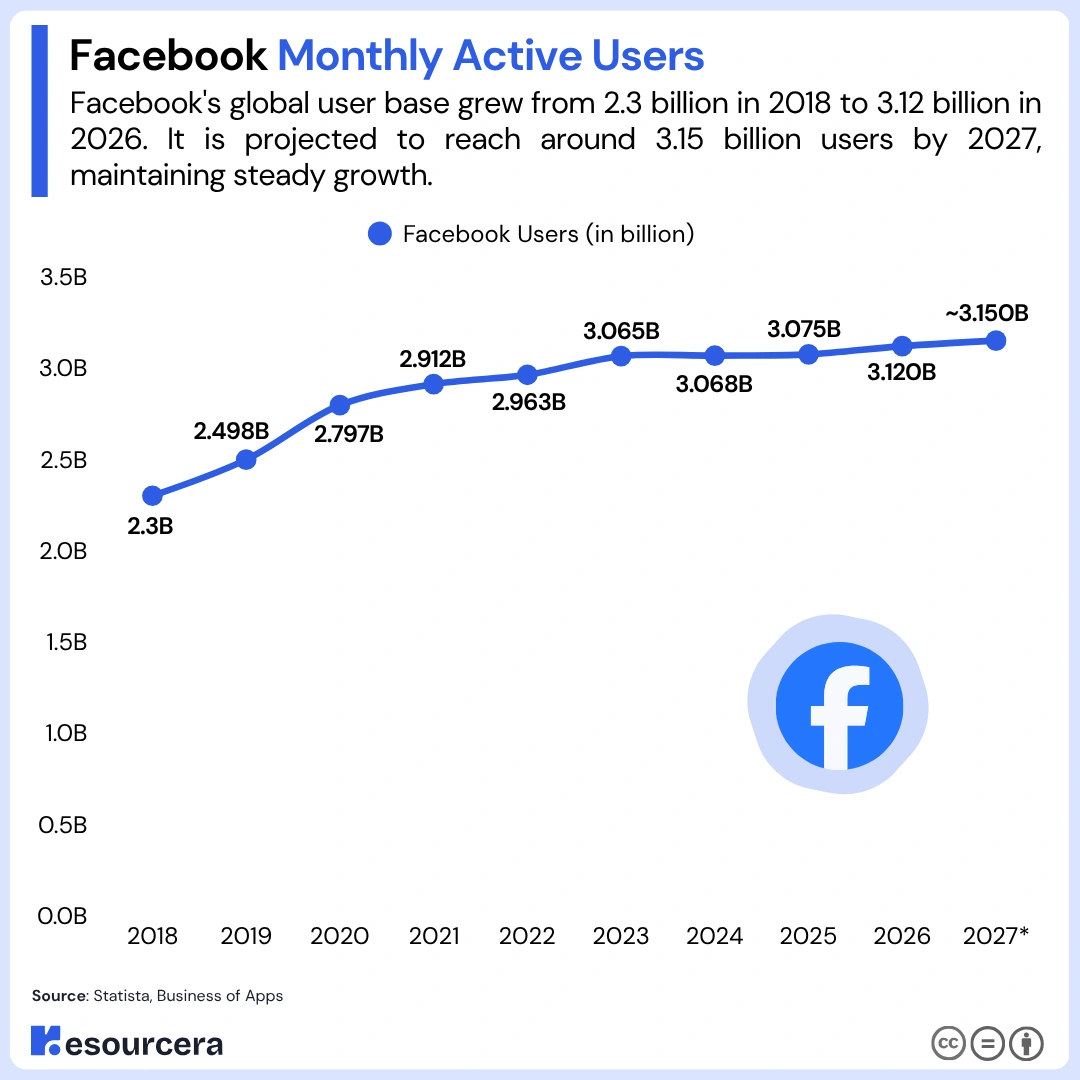
The given data reflects the number of Monthly active users on Facebook in millions.
| Year | Facebook Users (in billion) |
|---|---|
| 2018 | 2.3 billion |
| 2019 | 2.498 billion |
| 2020 | 2.797 billion |
| 2021 | 2.912 billion |
| 2022 | 2.963 billion |
| 2023 | 3.065 billion |
| 2024 | 3.068 billion |
| 2025 | 3.075 billion |
| 2026 | 3.120 billion |
| 2027* | ~3.150 million* |
Source: Statista and Business of Apps
Considering the monthly active users from the previous year, the estimated MAUs for the year 2027 may reach up to 3.1 billion.
The following data displays the monthly active users on Facebook across various regions from 2019 to 2025.
| Year | United States and Canada | Asia Pacific | Europe | Other Parts of the World |
|---|---|---|---|---|
| 2019 | 244 million | 1012 million | 385 million | 782 million |
| 2020 | 256 million | 1140 million | 410 million | 892 million |
| 2021 | 267 million | 1233 million | 446 million | 989 million |
| 2022 | 264 million | 1305 million | 407 million | 959 million |
| 2023 | 270 million | 1349 million | 409 million | 1002 million |
| 2024 | 270 million | 1363 million | 406 million | 1041 million |
| 2025 | 275 million | 1384 million | 412 million | 1049 million |
Source: Business of Apps
Facebook Daily Active Users
The number of Facebook’s DAUs stands around 2.17 billion as of 2026. This means that 68.7% of all monthly users return to the platform on any given day.
The daily active users on Facebook increased by 1.5% from 2024 to 2025.
| Year | Number of Daily active users |
|---|---|
| 2018 | 1.523 billion |
| 2019 | 1.657 billion |
| 2020 | 1.845 billion |
| 2021 | 1.929 billion |
| 2022 | 2.000 billion |
| 2023 | 2.110 billion |
| 2024 | 2.138 billion |
| 2025-2026 | 2.170 billion |
Source: Statista and Business of Apps
Facebook Users in the United States
According to Statista, an estimated 279.8 million people in the United States are active on Facebook. This makes it the second-largest national audience on the platform.
Over the full six-year span from 2019 to 2025, the US user base has grown by approximately 56.4 million people, which is an increase of more than 25%.
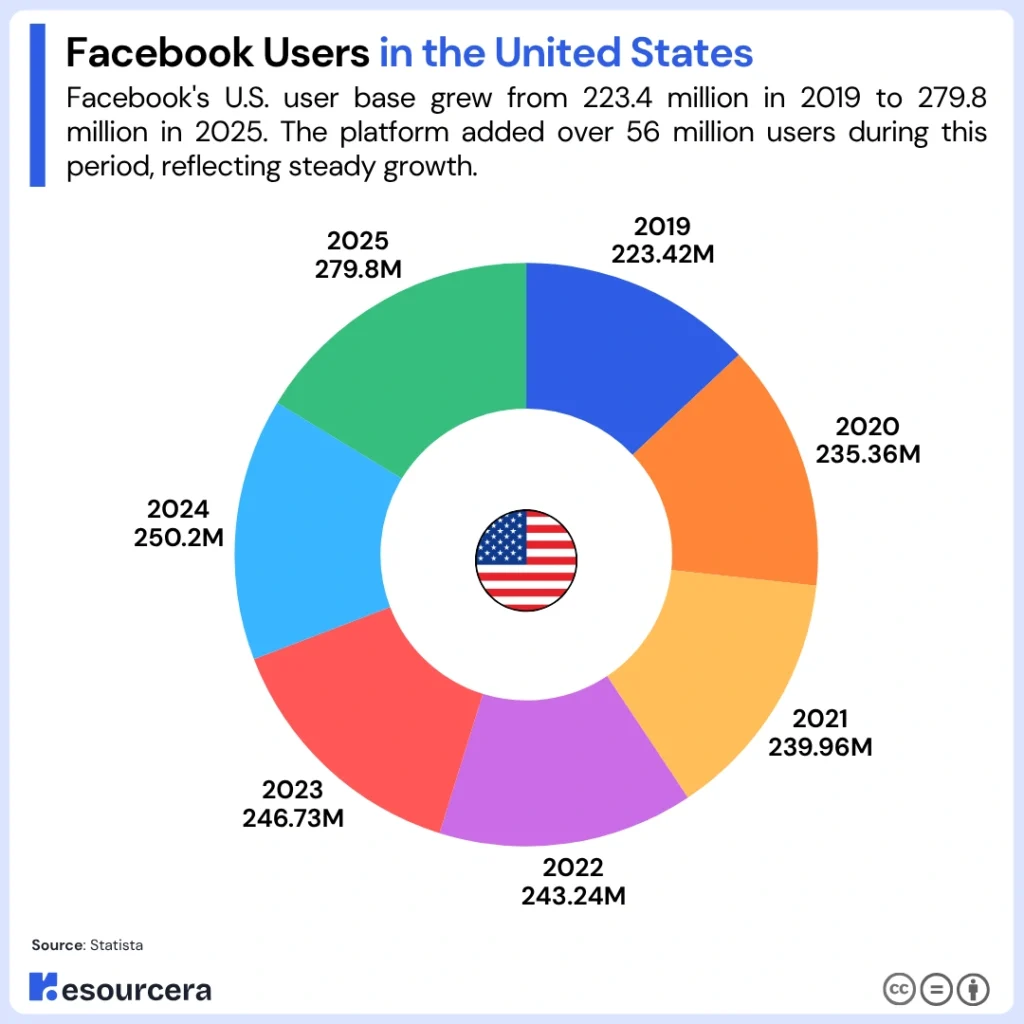
Here are the Facebook users in the United States over the years:
| Year | Facebook Users in the US |
|---|---|
| 2019 | 223.42 million |
| 2020 | 235.36 million |
| 2021 | 239.96 million |
| 2022 | 243.24 million |
| 2023 | 246.73 million |
| 2024 | 250.2 million |
| 2025 | 279.8 million |
(Source: Statista)
Facebook User Demographics
Facebook, being one of the leading social media platforms in the digital realm, is used by different users based on age, gender, and race.
Below is the complete breakdown of the Facebook Stats according to the user demographics.
Facebook Users By Age
In 2026, around 24.2% of Facebook users in the United States fall into the age group between 25 and 34 years.
Closely behind the leading cohort, adults aged 18 to 24 make up 18.6% of Facebook’s US user base.
Combined, the 18 to 34 age range accounts for nearly 43% of all US Facebook users.
The table below provides insights into Facebook users by age:
| Age Groups | Share of Facebook Users |
|---|---|
| 18 to 24 years | 18.6% |
| 25 to 34 years | 24.2% |
| 35 to 44 years | 19% |
| 45 to 54 years | 14.2% |
| 55 to 64 years | 11.7% |
| 65 and Above | 12.3% |
Source: Statista and Business of Apps
Facebook Users By Gender
As of 2026, 55.26% of Facebook users are male, and 44.74% of the users are female.
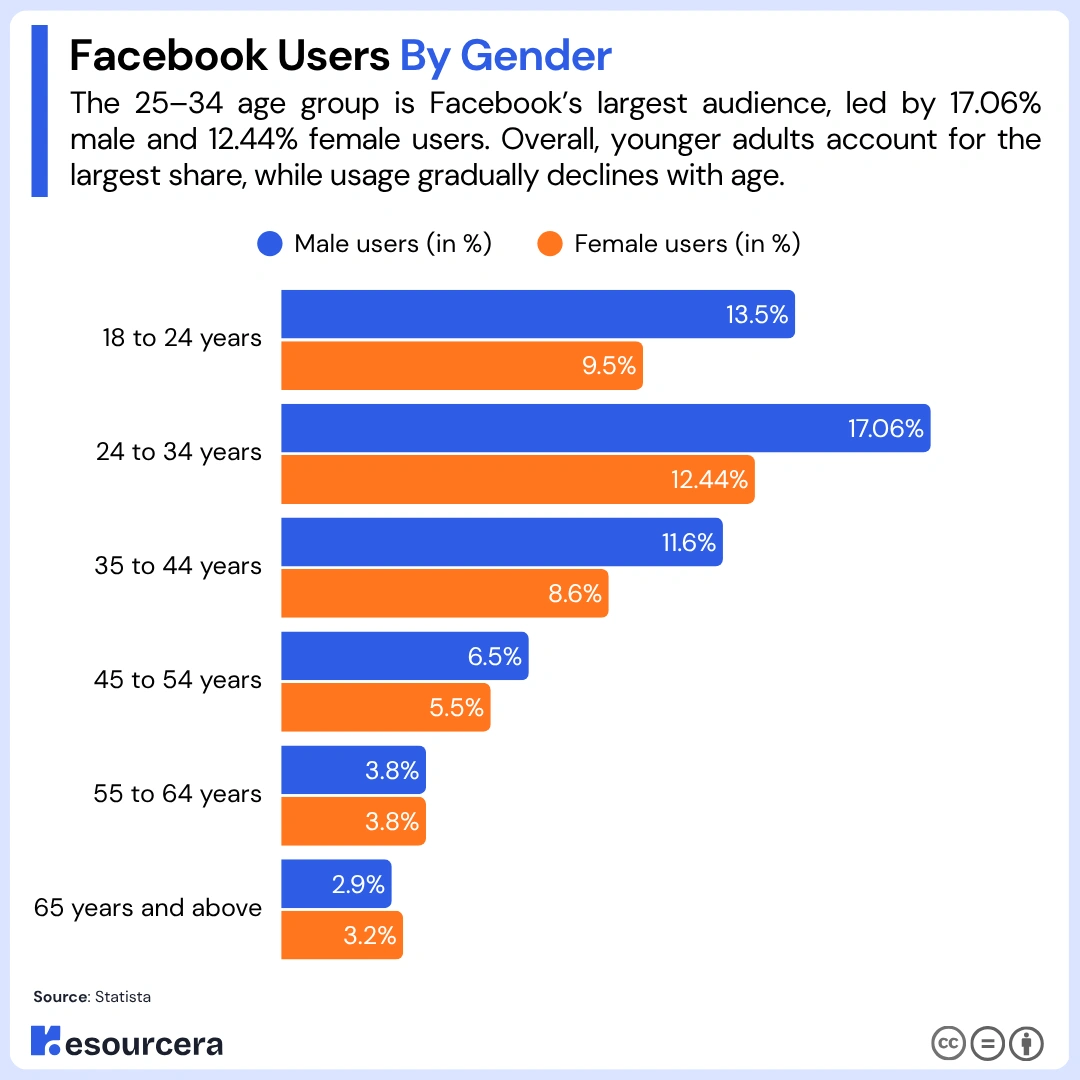
To get a clear view of the Facebook user demographics based on gender, check out the data below.
| Age groups | Male users (in %) | Female users (in %) |
|---|---|---|
| 18 to 24 years | 13.5% | 9.5% |
| 24 to 34 years | 17.06% | 12.44% |
| 35 to 44 years | 11.6% | 8.6% |
| 45 to 54 years | 6.5% | 5.5% |
| 55 to 64 years | 3.8% | 3.8% |
| 65 years and above | 2.9% | 3.2% |
Source: Statista
Facebook Users By Country
India is the leading nation, and a significant portion of Facebook’s user base is from India, i.e., 378.05 million.
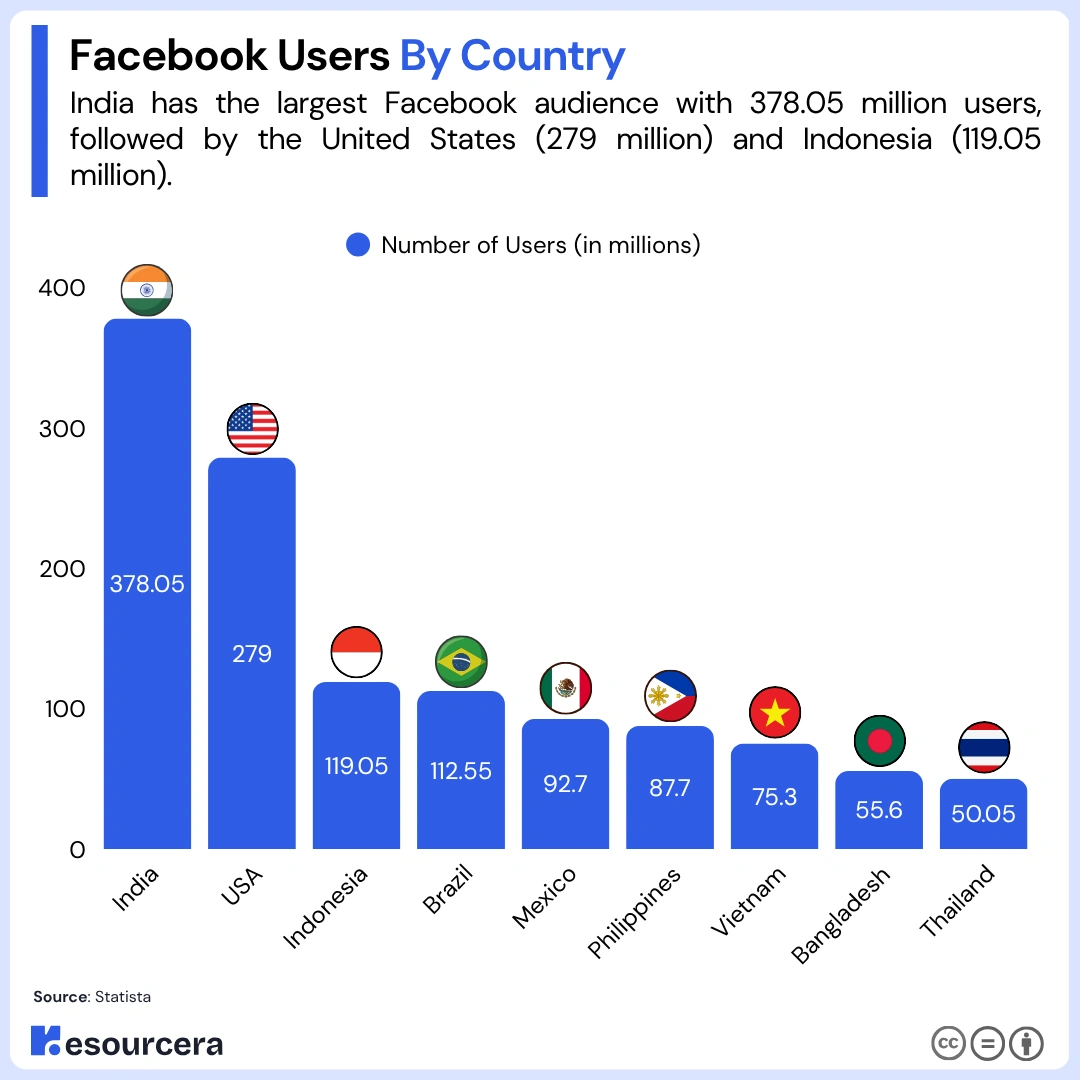
To get a clear view of Facebook users across different countries, check out the data below.
| Country | Number of Users (in millions) |
|---|---|
| India | 378.05 million |
| USA | 279 million |
| Indonesia | 119.05 million |
| Brazil | 112.55 million |
| Mexico | 92.7 million |
| Philippines | 87.7 million |
| Vietnam | 75.3 million |
| Bangladesh | 55.6 million |
| Thailand | 50.05 million |
Source: Statista
Facebook (Meta) Revenue 2026
In the first quarter of 2026, Meta reported approximately $56.3 billion in revenue. If that pace holds through the rest of the year, 2026 is on track to surpass 2025 comfortably
In 2025, Meta had reached $200.96 billion, with roughly 22% growth year over year.
Additionally, Meta generated around $134.9 billion in 2023 and then rose again to $164.5 billion in 2024, a 21.9% increase.
From a starting point of roughly $17.9 billion in 2015, the company has grown its annual revenue to nearly $201 billion by 2025, representing more than an 11-fold increase over the span of a decade.
The following data illustrates the revenue generated by Facebook from the year 2015 to 2026.
| Year | Revenue | YoY Growth |
|---|---|---|
| 2015 | $17.92 billion | Baseline |
| 2016 | $27.63 billion | +54.2% |
| 2017 | $40.65 billion | +47.2% |
| 2018 | $55.83 billion | +37.3% |
| 2019 | $70.69 billion | +26.6% |
| 2020 | $85.96 billion | +21.6% |
| 2021 | $117.92 billion | +36.8% |
| 2022 | $116.60 billion | -1.1% |
| 2023 | $134.90 billion | +15.7% |
| 2024 | $164.50 billion | +21.9% |
| 2025 | $200.96 billion | +22.2% |
| Q1 2026 | $56.31 billion | — |
(Source: Meta Earnings Report)
According to Statista’s report, Facebook was one of the early unicorns that secured billion-dollar valuations prior to their IPOs.
To get a comprehensive overview of Facebook’s Revenue (in $bn) according to different regions, go through the data below.
| Year | United States and Canada | Asia Pacific | Europe | Other Parts of the World |
| 2021 | 51.5 | 26.7 | 29 | 10.5 |
| 2022 | 54.5 | 23.4 | 25.7 | 12.7 |
| 2023 | 61.2 | 26.9 | 30.8 | 15.8 |
| 2024 | 72 | 32.8 | 38.7 | 20.8 |
Source: Business of Apps
Facebook Group Statistics
- Over 1.8 billion people use Facebook groups every month.
- 10 million active communities are on Facebook, where people connect, learn, and share interests.
- Around 70 million admins and moderators are actively involved in building and managing Facebook groups.
- Facebook reports that more than 400 million people are part of the Facebook group that they find meaningful.
- Facebook allows you to join 6000 groups. Once you hit this limit, you are required to leave some groups to join a new one.
Facebook Usage and Advertising Statistics
- It was reported that the advertisers reached 1.036 billion Facebook users through the Facebook Messenger app.
- The number of global Facebook advertising audiences was around 2.249 billion.
- The Facebook Messenger App has had 25.96 million monthly downloads as of 2025.
- According to EMARKETER, 25% of adults in the United States access Facebook as one of the influential digital platforms for decision-making regarding purchases, as compared to Instagram (20%) and TikTok (21%).
- According to Statista, Facebook is the most used social networking platform in the United States, representing 71.8% of overall social media visits.
The following table represents the use of Facebook for different purposes in percent.
| Use of Facebook | Major | Minor | Total |
|---|---|---|---|
| To connect with family and friends | 75% | 18% | 93% |
| For entertainment purpose | 34% | 41% | 75% |
| To connect with new people | 33% | 41% | 74% |
| To keep up with the latest news | 7% | 30% | 37% |
| To get recommendations and product reviews | 8% | 29% | 37% |
| To keep up with pop culture and sports | 8% | 27% | 36% |
| To keep up with political issues and politics | 4% | 23% | 27% |
Source: Pew Research Center, and DATAREPORTAL.
The global Facebook advertising revenue is given as follows.
| Year | Facebook Advertising Revenue |
|---|---|
| 2017 | $39.94 billion |
| 2018 | $55.01 billion |
| 2019 | $69.66 billion |
| 2020 | $84.17 billion |
| 2021 | $114.93 billion |
| 2022 | $113.64 billion |
| 2023 | $118.96 billion |
| 2024 | $121.8 billion |
| 2025 | $123.73 billion |
| 2026* | $125.37 billion |
| 2027* | $127.27 billion |
(Note: This includes revenue generated only through advertising. This does not include revenue through Facebook marketplace or others. This is a part of the total Meta revenue)
Source: Statista
Impact of AI on Facebook Ads
In order to provide a unique and personalized experience to users, Facebook has incorporated AI systems.
According to a survey by Statista, about 38% of marketers around the globe reported an increase in the efficiency of Social media marketing with the help of AI.
As per the latest statement from Mark Zuckerberg, more than 20% of users’ feeds are recommended by AI algorithms.
Use of Facebook across different devices
97.4% of the users prefer accessing Facebook via mobile phones, while only 2.6% of the users are likely to access Facebook through desktop computers or laptops.
| Devices | User distribution (in %) |
|---|---|
| Any type of mobile phone | 97.4% |
| Desktop computers or Laptops | 2.6% |
| Both computers and phones | 28.7% |
| Only through mobile phones | 68.7% |
Best Time to Post on Facebook
The ideal time to share a post on Facebook depends on your location, industry, and audience.
However, the most effective time to post on Facebook is 9 am to 3 pm on weekdays, i.e., from Monday to Friday, and from 8 am to 11 am on weekends.
Below is a detailed breakdown of the ideal time to post on Facebook.
| Days | Ideal Time |
|---|---|
| Monday | 9 am to 12 pm |
| Tuesday | 9 am to 2 pm and 5 pm |
| Wednesday | 9 am to 3 pm and 5 pm |
| Thursday | 8 am to 2 pm and 5 pm |
| Friday | 9 am to 11 am |
| Saturday | 8 am to 11 am |
| Sunday | 9 am to 11 am |
Most Followed Facebook Pages in 2026
Cristiano Ronaldo is the most followed page, with 171 million followers.
The following are the top 10 most-followed pages on Facebook, with their number of followers for 2026.
| Accounts | Followers |
|---|---|
| Cristiano Ronaldo | 171 million |
| Samsung | 163 million |
| Mr Bean | 140 million |
| Real Madrid C.F. | 133 million |
| CGTN | 125 million |
| Shakira | 122 million |
| Leo Messi | 116 million |
| Will Smith | 113 million |
| China Daily | 110 million |
| Coca Cola | 107 million |
User Engagement and Content Performance on Facebook
The engagement rate on Facebook’s posts largely depends on the type of content, including photos, videos, statuses, and links uploaded by the page.
The following table showcases the average engagement rate on the Facebook page.
| Type of content | Engagement rate (in %) |
|---|---|
| All types of posts | 0.07% |
| Photo | 0.13% |
| Video | 0.07% |
| Link | 0.03% |
| Status | 0.09% |
Source: DataReportal
Facebook Video Statistics
The video content on Facebook has demonstrated remarkable growth and engagement over the past few years.
- More than 617 million people watch reels on Facebook
- About 85% of the videos on Facebook are viewed without sound.
- Square and landscape video formats get a lower engagement rate than vertical format Facebook videos.
- Videos uploaded on Facebook get 478% more shares than those uploaded from other sources.
Facebook Video length specifications
Shorter videos tend to be more engaging on mobile devices. Different placements support different video lengths.
Here’s a quick summary of Facebook video length specifications.
| Length | |
|---|---|
| Facebook Feed | Maximum 240 minutes |
| Facebook in-stream videos on mobile | 5 seconds to 10 minutes |
| Facebook in-stream videos on desktop | 5 to 15 seconds |
| Facebook Stories | 1 to 15 seconds |
| Facebook Marketplace | Maximum 240 minutes |
Source: Meta

