

In 2026, around 20.5% of internet users worldwide use voice search, and 8.4 billion voice assistants are now in use. That is more voice assistants than people on Earth. Yet most brands still plan their content only for typed searches.
Only 13% of marketers actively optimize for voice, and just 4% of US businesses are ready for voice search.
On top of that, much of the voice search data online is several years old, which makes it hard to know what is still true.
We collected the latest voice search statistics and traced each figure back to its original source.
You will learn how many people use voice search, which devices and assistants they prefer, and how voice affects local search, shopping, and SEO.
Let’s quickly get into the details.
Voice Search Statistics: Key Highlights
- 20.5% of internet users worldwide use voice search or voice commands in 2026.
- 8.4 billion voice assistants were in use in 2026, double the 4.2 billion in use in 2020.
- US voice assistant users will reach 157.1 million by the end of 2026, up 10.6% from 2022.
- China leads weekly voice assistant use at 40.8%, and India ranks fourth at 33.6%.
- Google Assistant has 88.8 million US users, ahead of Siri (84.2 million) and Alexa (75.6 million).
- 35% of Americans aged 12 and older own a smart speaker.
- 58% of consumers have used voice search to find local business information.
- 28% of consumers call a business after finding it through voice search.
- The global voice commerce market is projected to reach $186.28 billion by 2030.
- About 80% of voice search answers come from the top three search results.
- Only 13% of marketers actively optimize for voice search.
How Many People Use Voice Search?
About 20.5% of internet users worldwide use voice search or voice commands. That is roughly 1 in 5 internet users.
Usage peaked at 22.5% in Q2 2022 and fell to 19.03% by Q4 2022. Since then, it has stayed between 19.6% and 20.5%.
Weekly use is higher when you count all voice assistant activity. In fact, 27.6% of internet users aged 16 to 64 use a voice assistant every week.
Moreover, 21% use voice to find information each week, while 20% use it to complete an action like playing a song or placing an order.
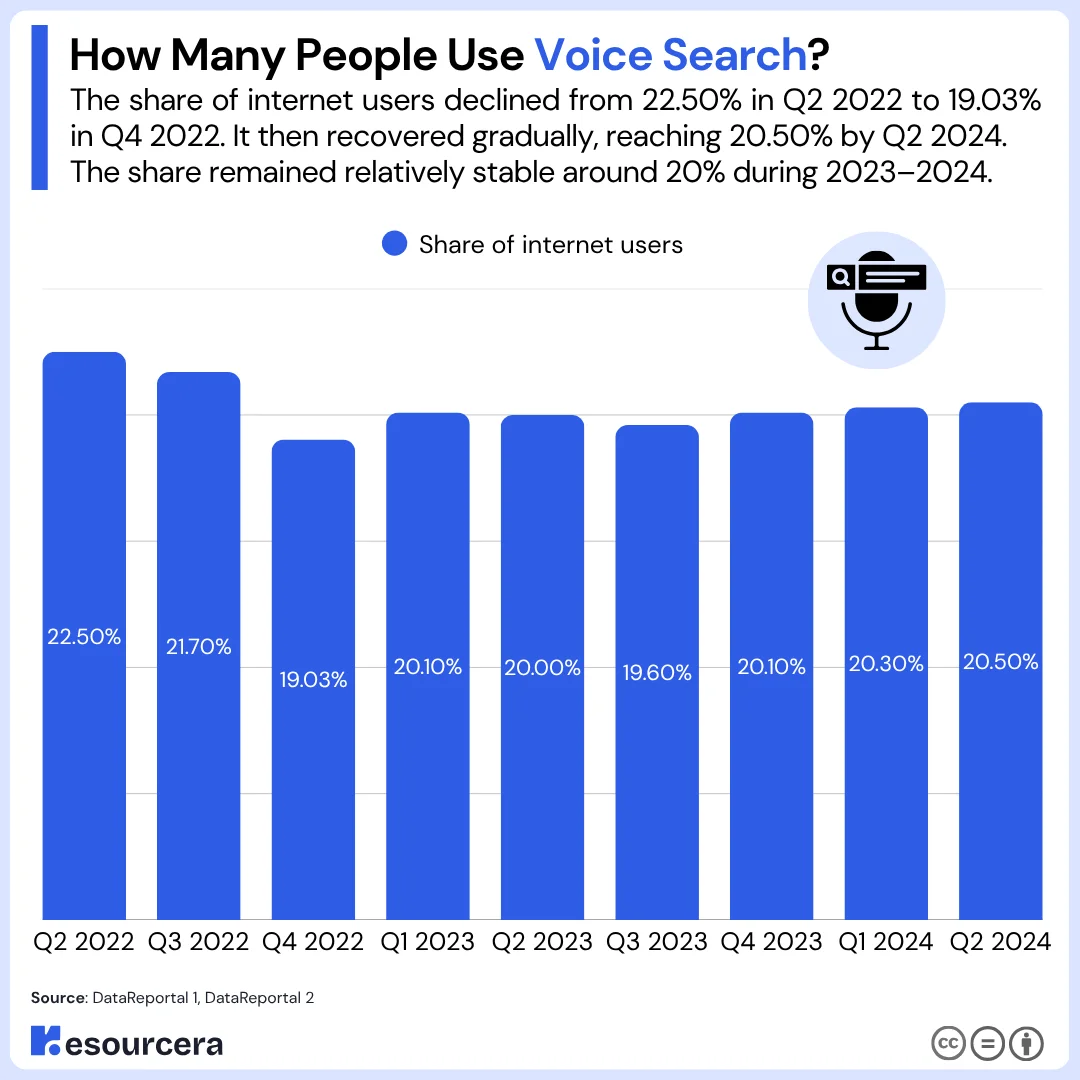
The table below shows the share of internet users using voice search each quarter from Q2 2022 to Q2 2024.
| Quarter | Share of internet users |
|---|---|
| Q2 2022 | 22.50% |
| Q3 2022 | 21.70% |
| Q4 2022 | 19.03% |
| Q1 2023 | 20.10% |
| Q2 2023 | 20.00% |
| Q3 2023 | 19.60% |
| Q4 2023 | 20.10% |
| Q1 2024 | 20.30% |
| Q2 2024 | 20.50% |
(Source: DataReportal 1, DataReportal 2, GWI 1)
How Many Voice Assistants Are in Use?
There were 8.4 billion voice assistants in use worldwide in 2024. This number doubled from 4.2 billion in 2020.
This figure counts devices with a built-in assistant, such as phones, speakers, TVs, and cars. It does not count people, and many people own more than one assistant-enabled device. From 2020 to 2024, the number grew at a CAGR of 18.9%. Over the full 2019 to 2024 period, it grew 158.5%.
The table below shows the number of voice assistants in use for each year with available data.
| Year | Voice assistants in use | Growth vs previous data point |
|---|---|---|
| 2019 | 3.25 billion | N/A |
| 2020 | 4.2 billion | +29.2% |
| 2024 | 8.3 billion | +100.0% |
| 2026 | 8.4 billion | +1.2% |
(Source: Statista 1)
How Many People Use Voice Assistants in the US?
The US will have 157.1 million voice assistant users in 2026. That is 15.1 million more than in 2022, an increase of 10.6%.
Yearly growth fell from 2.8% in 2023 to 2.3% in 2026. Across the four years, the user base grew at a CAGR of 2.6%. Overall, 62% of Americans aged 18 and older use a voice assistant on some device.
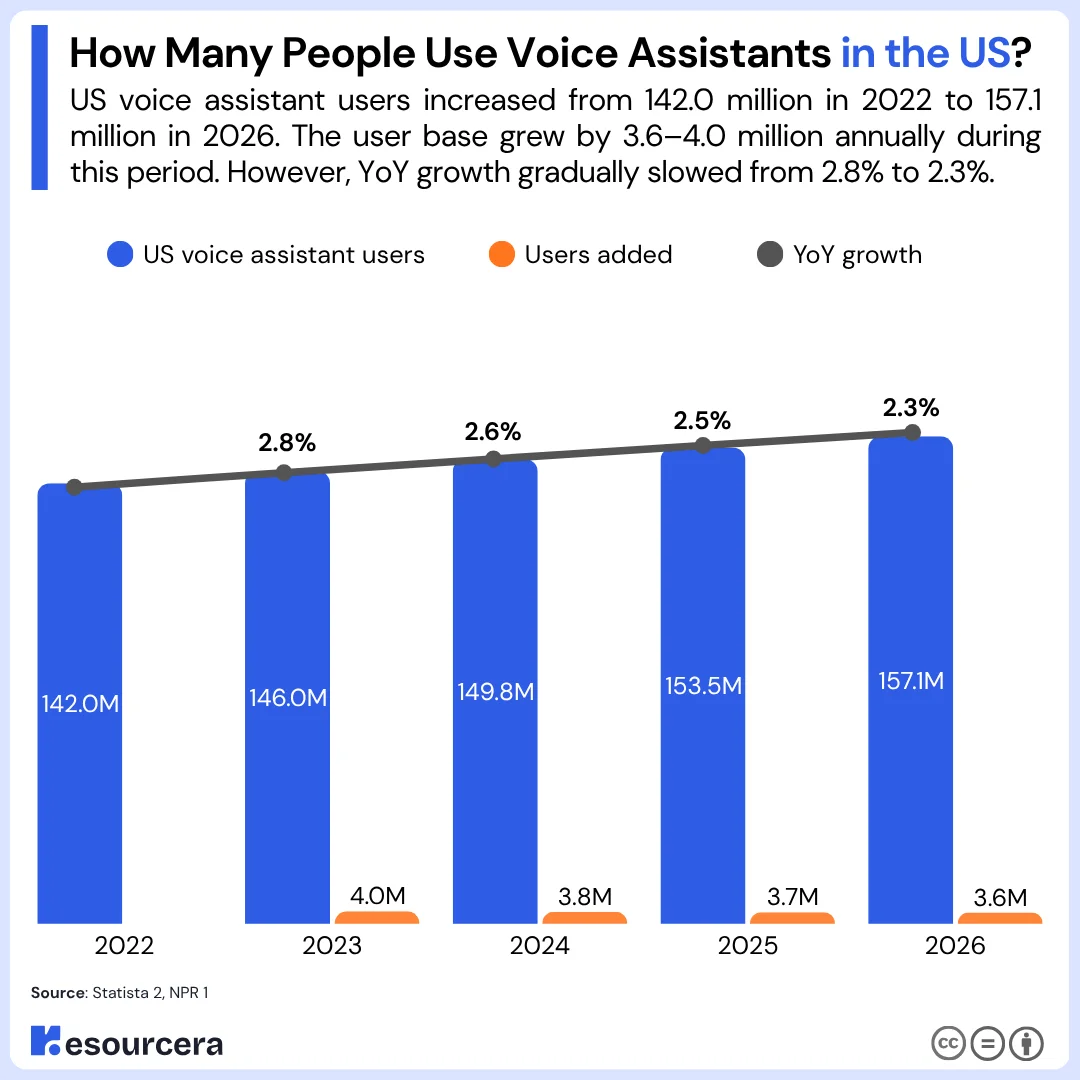
The table below shows the number of US voice assistant users from 2022 to 2026.
| Year | US voice assistant users | Users added | YoY growth |
|---|---|---|---|
| 2022 | 142.0 million | N/A | N/A |
| 2023 | 146.0 million | +4.0 million | 2.8% |
| 2024 | 149.8 million | +3.8 million | 2.6% |
| 2025 | 153.5 million | +3.7 million | 2.5% |
| 2026 | 157.1 million | +3.6 million | 2.3% |
(Source: Statista 2, NPR 1)
How Often Do People Use Voice Search?
Half of US consumers use voice search every day. Among adults aged 25 to 34, about 3 in 5 use it daily.
Most users are not new to it. 72% have used voice search for one to five years, and 16% have used it for more than five years. That means at least 88% of users have been using voice search for over a year.
US voice search use fell by 35% between 2018 and 2021. Security worries, the COVID-19 pandemic, poor results, and trouble hearing commands in noisy places all played a part. Daily use then rose 8% from 2021 to 2022.
Habits are strongest in the middle age groups. 65% of people aged 25 to 49 speak to a voice-enabled device at least once a day. Among smart speaker owners, 52% use their device every day.
(Source: UpCity, The Manifest, Vixen Labs, PwC, NPR 2)
Voice Search Usage by Country
China has the highest weekly voice assistant use in the world, at 40.8% of internet users. The UAE, Mexico, India, and Brazil follow, while the US ranks sixth at 30.4%.
The global average is 27.6%, so China sits 13.2 points above it. The US is only 2.8 points above the average, even though it is home to the biggest voice assistant brands. China’s weekly rate is 1.34 times the US rate.
By region, voice assistant use is highest in Asia Pacific, followed by Latin America and North America.
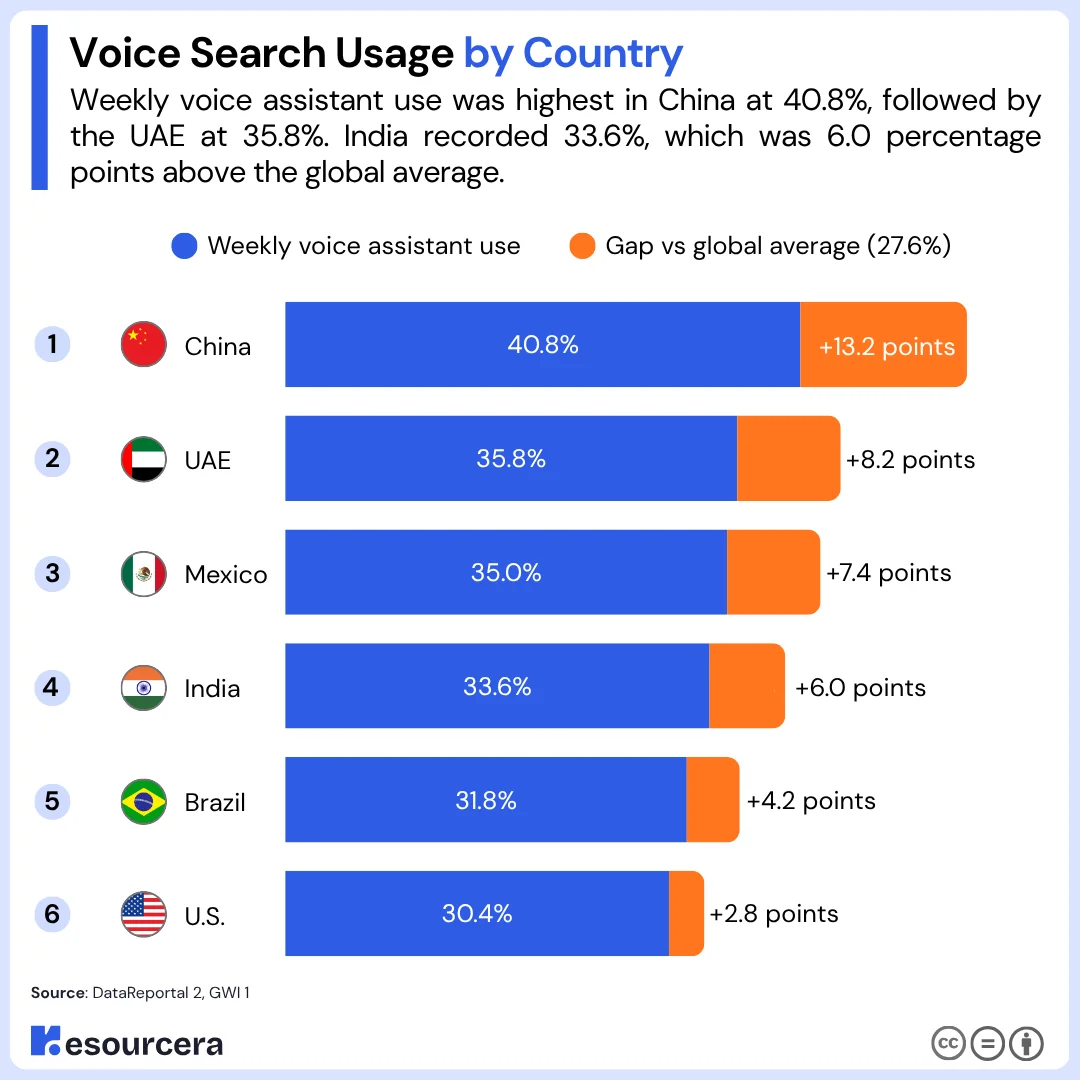
The table below ranks the top six countries by weekly voice assistant use.
| Rank | Country | Weekly voice assistant use | Gap vs global average (27.6%) |
|---|---|---|---|
| 1 | China | 40.8% | +13.2 points |
| 2 | UAE | 35.8% | +8.2 points |
| 3 | Mexico | 35.0% | +7.4 points |
| 4 | India | 33.6% | +6.0 points |
| 5 | Brazil | 31.8% | +4.2 points |
| 6 | United States | 30.4% | +2.8 points |
(Source: DataReportal 2, GWI 1, GWI 2)
Voice Search Demographics
People aged 25 to 44 use voice assistants the most, with weekly use above 32%. Use drops with age and falls to 17% to 19% among people aged 65 and older.
Voice Search Usage by Age
Adults aged 45 to 64 sit in the middle, with weekly use in the mid-20% range. By generation, 34% of millennials use a voice assistant every week, and Gen Z is close behind.
Younger users also expect to use voice more. 61% of adults aged 25 to 64 and 57% of those aged 18 to 24 say they will use voice devices more in the future. Among wearable owners, 71% expect to do more voice searches.
The device gap between age groups is large. Adults aged 18 to 34 use voice search on smartphones at 2.6 times the rate of adults aged 55 and older. Among the older group, 30% say they do not want to use voice search at all.
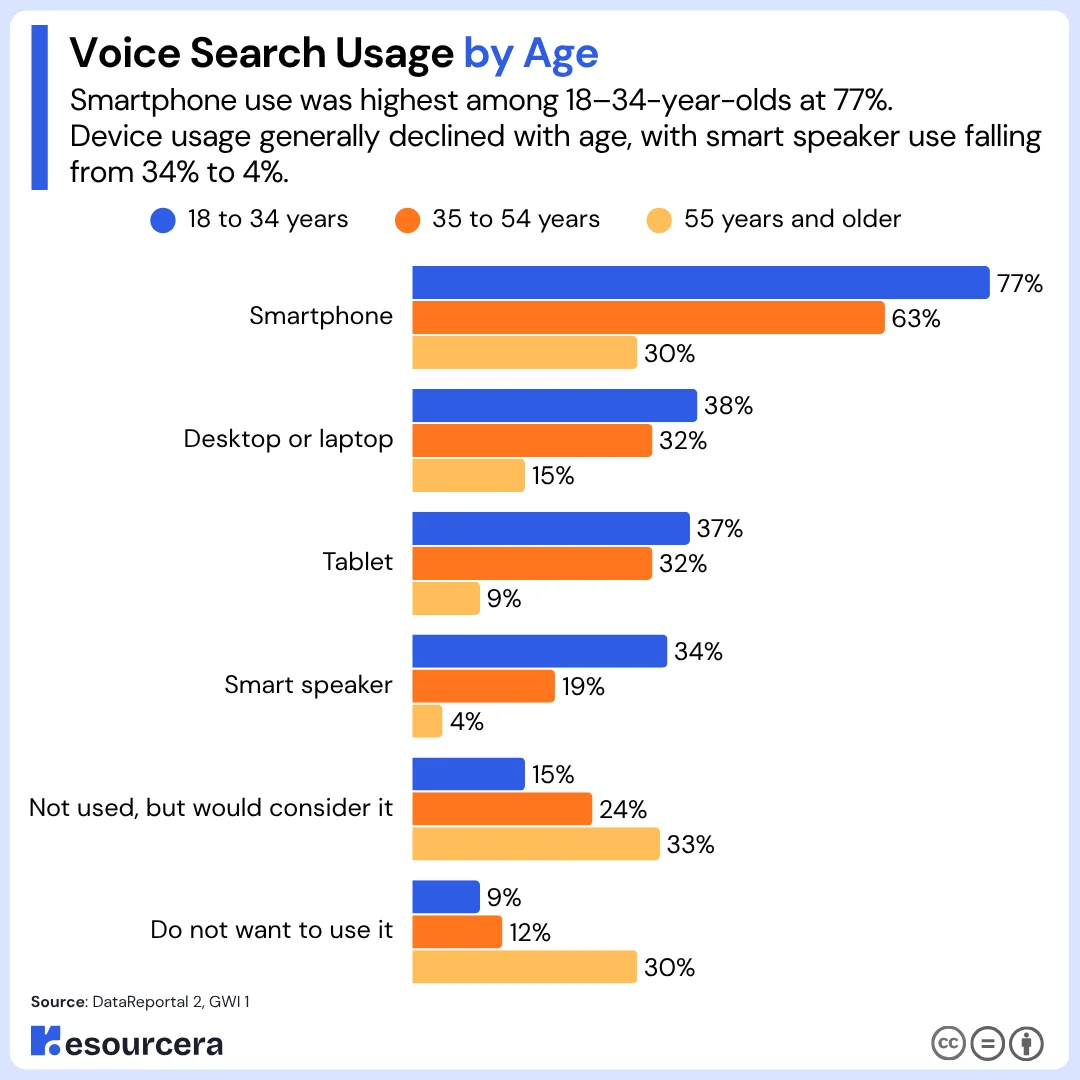
The table below shows how each age group uses voice search across devices.
| Device or response | 18 to 34 years | 35 to 54 years | 55 years and older |
|---|---|---|---|
| Smartphone | 77% | 63% | 30% |
| Desktop or laptop | 38% | 32% | 15% |
| Tablet | 37% | 32% | 9% |
| Smart speaker | 34% | 19% | 4% |
| Not used, but would consider it | 15% | 24% | 33% |
| Do not want to use it | 9% | 12% | 30% |
(Source: DataReportal 2, GWI 1, PwC, Keywords Everywhere)
Voice Search Usage by Gender
Men use voice assistants slightly more than women. 31% of men use one every week, compared with 28% of women.
The gap has barely changed over time. In 2018, 28% of men and 26% of women used mobile voice search, a 2-point gap. Today, the gap is 3 points.
(Source: DataReportal 2, GWI 2)
Voice Search Usage by Income and Location
Higher-income households, families with children, and younger consumers drive voice assistant adoption. Users also tend to live in cities and adopt new technology early.
Awareness is almost universal. 90% of consumers are familiar with voice-enabled products, and 72% of that group has used a voice assistant.
(Source: PwC, GWI 1)
Voice Search and Accessibility
1 in 3 consumers with a visual impairment uses a voice assistant every week. Among people with physical disabilities, 32% do the same.
For many of these users, voice is a daily tool rather than a novelty. 1 in 10 consumers with a visual impairment lives alone, and 27% of them buy groceries online every week.
(Source: GWI 1)
Voice Assistant Market Share
Google Assistant is the most used voice assistant in the US, with 88.8 million users in 2024. Siri follows with 84.2 million users, and Alexa has 75.6 million.
Google Assistant also grew the fastest, adding 7.3 million users since 2022. Measured against all 149.8 million US voice assistant users in 2024, Google Assistant reaches 59.3% of them, Siri reaches 56.2%, and Alexa reaches 50.5%. These shares add up to more than 100% because many people use more than one assistant.
The table below compares US users for the three biggest voice assistants in 2022 and 2024.
| Voice assistant | 2022 users | 2024 users | Users added | Growth |
|---|---|---|---|---|
| Google Assistant | 81.5 million | 88.8 million | +7.3 million | 9.0% |
| Siri | 77.6 million | 84.2 million | +6.6 million | 8.5% |
| Alexa | 71.6 million | 75.6 million | +4.0 million | 5.6% |
(Source: eMarketer 1, Statista 2)
Voice Assistant Usage Growth in the US
Monthly use of Google Assistant in the US grew 46% between 2020 and 2024, the biggest jump of any major assistant. Siri grew 40%, and Alexa grew 26% over the same period.
Preferences also split by generation. Millennials lean toward Alexa, with 33% using it in the past month. Gen Z leans toward Siri, which fits their strong ties to Apple devices.
The table below shows the growth in monthly US usage for each assistant from 2020 to 2024.
| Voice assistant | Growth in monthly US usage (2020 to 2024) |
|---|---|
| Google Assistant | +46% |
| Siri | +40% |
| Alexa | +26% |
(Source: GWI 1)
Smart Speaker Brand Ownership
Amazon Echo is the most owned smart speaker in the US, with 65% of smart speaker owners having one. Google Home follows at 24%, and Apple HomePod has 18%.
Echo is owned by 2.7 times as many people as Google Home. The shares add up to more than 100% because some households own speakers from more than one brand.
The table below shows US smart speaker ownership by brand as of March 2024.
| Smart speaker brand | Share of US smart speaker owners |
|---|---|
| Amazon Echo | 65% |
| Google Home | 24% |
| Apple HomePod | 18% |
(Source: RAB)
Voice Search by Device
Smartphones are the most common device for voice assistants, used by 56% of US voice assistant users. Smart speakers come second at 35%, followed closely by TVs and TV remotes at 34%.
Phones lead because they are always close at hand. About 20% of mobile searches are done by voice. Worldwide, 27% of the online population uses voice search on mobile.
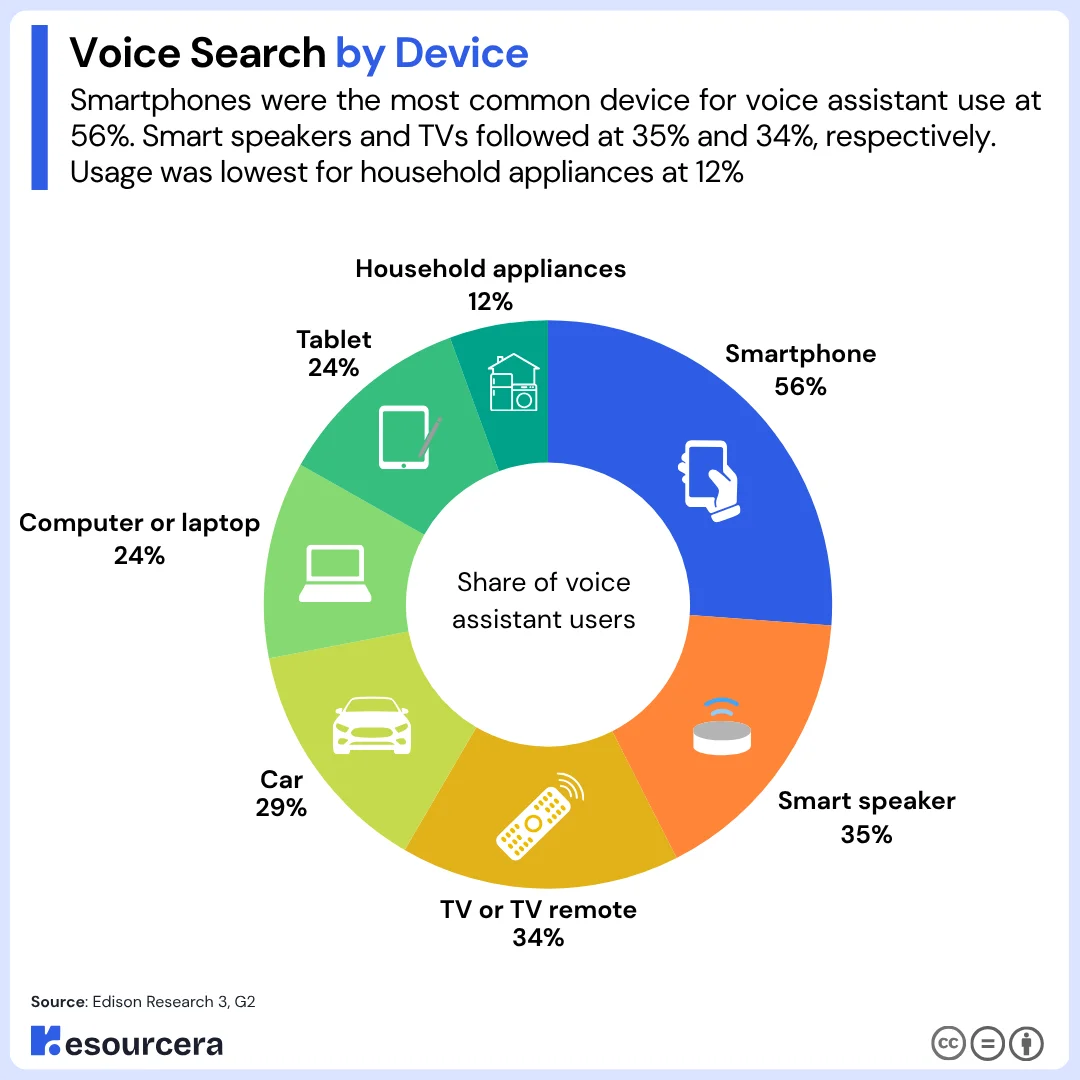
The table below shows the share of US consumers using voice assistants on each type of device.
| Device | Share of voice assistant users |
|---|---|
| Smartphone | 56% |
| Smart speaker | 35% |
| TV or TV remote | 34% |
| Car | 29% |
| Computer or laptop | 24% |
| Tablet | 24% |
| Household appliances | 12% |
(Source: Edison Research 3, G2, GWI 2)
Smart Speaker Ownership and Use
35% of Americans aged 12 and older own at least one smart speaker, which is about 101 million people. This rate has stayed flat for four years in a row.
Ownership grew fast early on, from 28% of US households in 2018 to 36% of Americans in 2023, and then leveled off.
Owners often have more than one device, with 58% of smart speaker households owning two or more. Most people keep their speaker in a shared space, and 52% of owners use it every day.
The table below shows where people place their smart speakers at home.
| Room | Share of smart speaker owners |
|---|---|
| Living room or family room | 52% |
| Bedroom | 25% |
| Kitchen | 22% |
(Source: Edison Research 2, Keywords Everywhere, Edison Research 1, SiriusXM, Think with Google, NPR 2)
Smart Speaker Market Size
The global smart speaker market was worth $10.6 billion in 2022 and is projected to reach $50.9 billion by 2030. That works out to a CAGR of about 21.7%.
North America held 41% of global revenue in 2022, which is about $4.3 billion. Asia Pacific is expected to be the fastest-growing region.
(Source: Grand View Research 2)
What Do People Use Voice Search For?
Checking the weather is the top use of voice assistants in the US, with 75% of users doing it. Playing music (71%) and looking up quick facts (68%) come next.
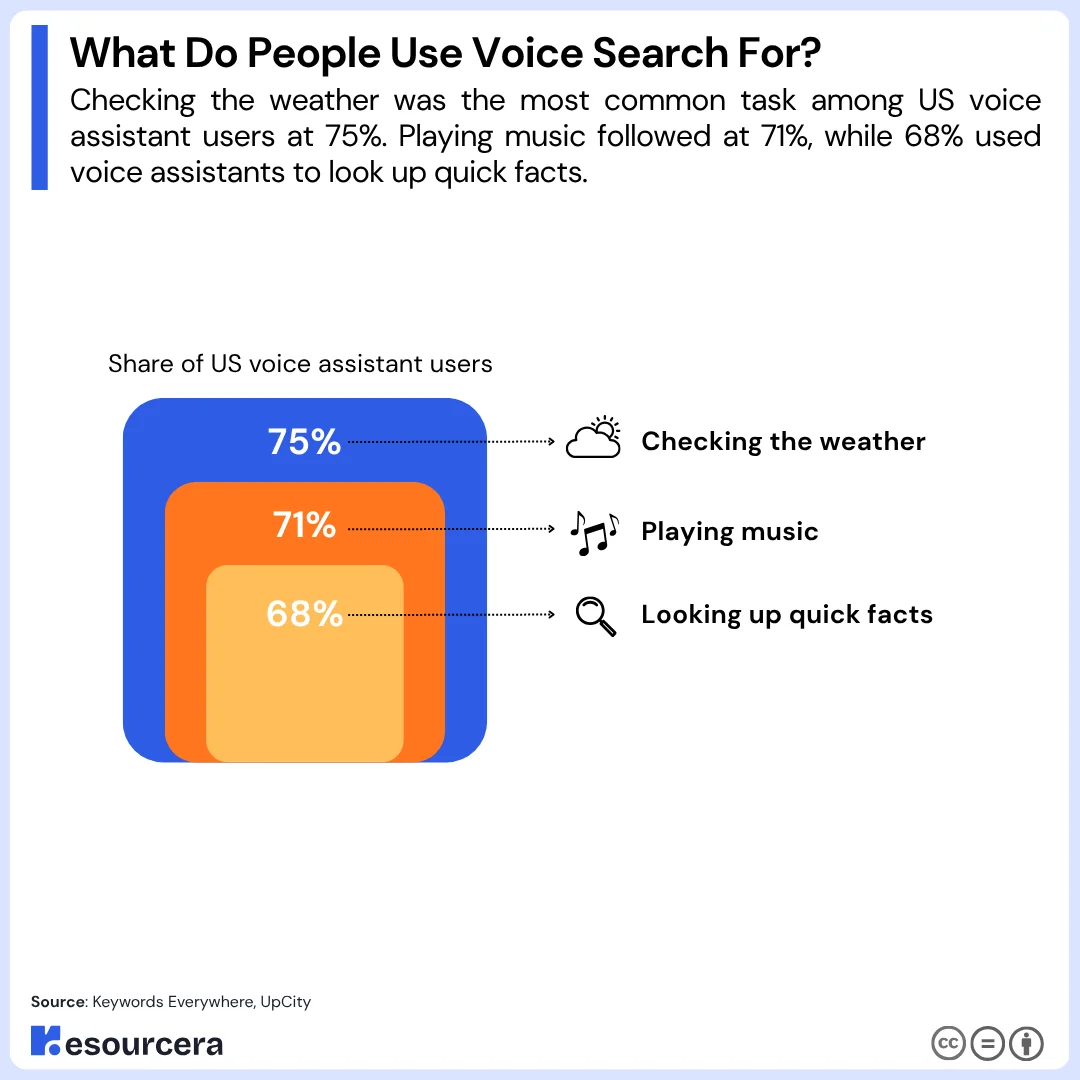
The table below shows the most common voice assistant tasks among US users.
| Task | Share of US voice assistant users |
|---|---|
| Checking the weather | 75% |
| Playing music | 71% |
| Looking up quick facts | 68% |
When people name their single most common voice task, the weather still comes first at 17%. Local “near me” searches come a close second at 16%. Hands-free searches while driving and looking up definitions follow.
The table below shows the share of users who named each task as their main use of voice search.
| Main voice search task | Share of users |
|---|---|
| Checking the weather | 17% |
| “Near me” searches for local businesses | 16% |
| Hands-free searches while driving | 14% |
| Definitions and fact-checking | 13% |
(Source: Keywords Everywhere, UpCity)
Why People Choose Voice Search
90% of people say voice search is easier than typing. 89% find it more convenient, and 87% say it is faster.
The preference for voice is not new. In 2018, 71% of consumers already preferred to search by voice rather than type.
The table below shows the main reasons people give for using voice search.
| Reason | Share of users |
|---|---|
| Easier than typing | 90% |
| More convenient | 89% |
| Faster than typing | 87% |
| Prefer voice over typing for queries (2018) | 71% |
(Source: Keywords Everywhere, PwC)
Local Voice Search Statistics
58% of consumers have used voice search to find information about a local business. Among smart speaker users, 76% run local voice searches at least once a week and 46% do it every day.
Local topics make up about 22% of all voice queries. These searches often lead straight to action. 28% of consumers call the business they found through voice search, which makes a phone call the most common next step.
Restaurants and cafes are the most searched local businesses by voice. They are searched by 51% of voice users, which is 2.2 times the rate for automotive services.
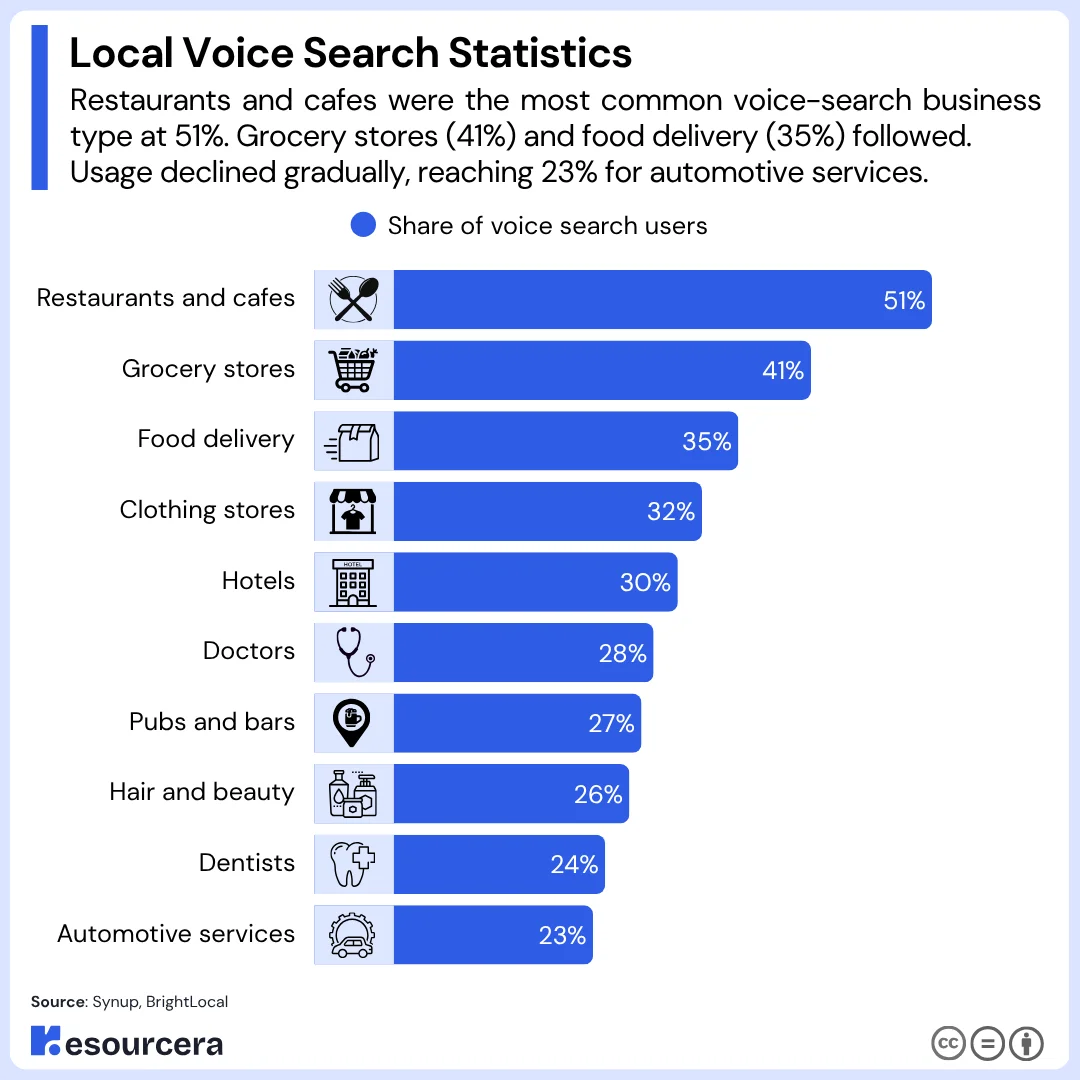
The table below shows the types of local businesses people search for by voice.
| Business type | Share of voice search users |
|---|---|
| Restaurants and cafes | 51% |
| Grocery stores | 41% |
| Food delivery | 35% |
| Clothing stores | 32% |
| Hotels | 30% |
| Doctors | 28% |
| Pubs and bars | 27% |
| Hair and beauty | 26% |
| Dentists | 24% |
| Automotive services | 23% |
(Source: Synup, BrightLocal, G2)
Where Voice Assistants Get Local Results
76% consumers use voice search for local business information. Each voice assistant pulls local results from a different data source. Google Assistant uses Google Maps and Google Business Profile data, Siri uses Apple Maps with Yelp data, and Alexa relies on Microsoft Bing.
For Siri, distance is the biggest ranking factor, followed by the number of Yelp reviews, the star rating, and pricing. For “best” searches, Siri gives the highest star rating more weight than distance.
The table below shows the local data source behind each major assistant.
| Voice assistant | Main local data source |
|---|---|
| Google Assistant | Google Maps and Google Business Profile |
| Siri | Apple Maps (with Yelp data) |
| Alexa | Microsoft Bing |
(Source: Semrush)
Voice Search Use by Industry
Banking is one of the strongest industries for voice. 57% of users have used a voice assistant to check an account balance, and 35% of banking customers use voice for questions and transactions.
Automotive and events also see strong voice activity. 44% of voice assistant users have checked car prices by voice, and 39% look up local events like concerts and festivals.
The table below shows how voice assistant users engage with specific industries.
| Industry | Voice activity | Share of users |
|---|---|---|
| Banking | Checked an account balance | 57% |
| Automotive | Checked car prices | 44% |
| Automotive | Found a nearby dealership or service center | 41% |
| Events | Looked up local events | 39% |
| Banking | Used voice for inquiries and transactions | 35% |
(Source: Synup, G2)
Voice Commerce and Shopping Statistics
The global voice commerce market was worth $42.75 billion in 2023 and is projected to reach $186.28 billion by 2030. That is a CAGR of 24.6% from 2024 to 2030.
At that pace, the market will grow 4.4 times and add $143.53 billion in value within seven years. Up to 43% of voice-enabled device owners already use their devices to shop, and 24% of all shoppers have used a voice assistant to shop online. In the US alone, there were 33.2 million smart speaker shoppers in 2022.
(Source: Grand View Research 1, Narvar, G2, eMarketer 2)
How Shoppers Use Voice Along the Buying Journey
Most voice shoppers use voice to research products, not to buy them. 51% research products by voice, while 22% make purchases directly through voice.
That means research happens 2.3 times as often as direct buying. Voice also plays a role after checkout, with 30% tracking packages and 17% reordering items by voice. In the US, 58% of smartphone users have used voice to look up product or service information. Adults aged 25 to 34 are the most likely to buy by voice, with 45 to 54-year-olds close behind.
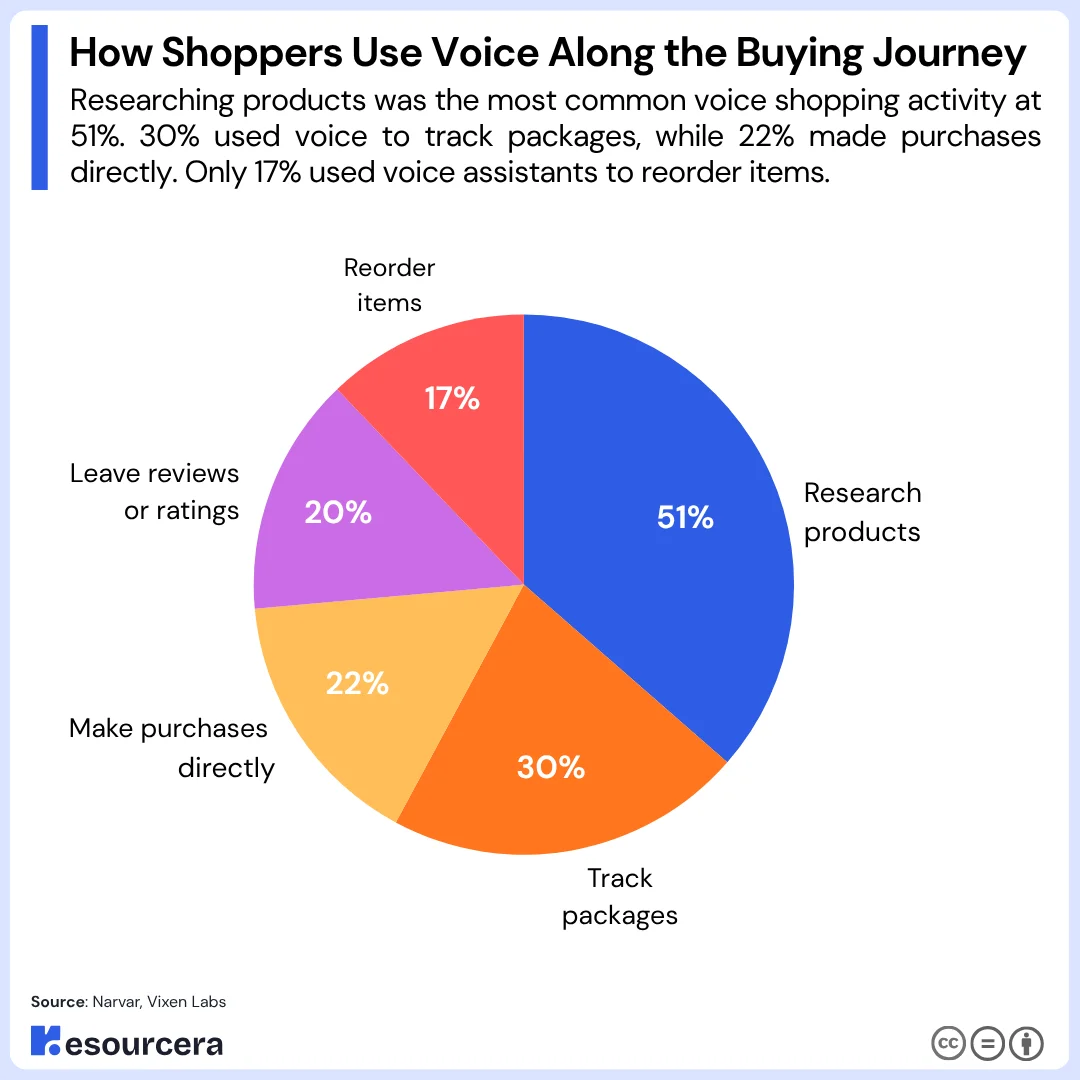
The table below shows how online shoppers use voice at each stage of the buying journey.
| Shopping activity | Share of voice shoppers |
|---|---|
| Research products | 51% |
| Track packages | 30% |
| Make purchases directly | 22% |
| Leave reviews or ratings | 20% |
| Reorder items | 17% |
(Source: Narvar, Vixen Labs)
What People Buy Through Smart Speakers
Health and beauty is the top smart speaker purchase category, with 8.9 million items bought between 2019 and 2021. Electronics (8.8 million) and household supplies (8.5 million) follow closely.
Across the five main categories, shoppers bought 39.1 million items. The top three categories alone make up 67% of that total.
The table below shows smart speaker purchases by category from 2019 to 2021.
| Category | Items purchased | Share of total |
|---|---|---|
| Health and beauty | 8.9 million | 22.8% |
| Electronics | 8.8 million | 22.5% |
| Household supplies | 8.5 million | 21.7% |
| Home and garden | 7.0 million | 17.9% |
| Arts, crafts, and party supplies | 5.9 million | 15.1% |
| Total | 39.1 million | 100% |
(Source: Comscore)
Voice Assistant Users Shop More Online
Voice assistant users are 33% more likely than the average consumer to have made an online purchase in the past week. They are also 51% more likely to have ordered a meal through a delivery app in that time.
This group prefers online stores. 66% of voice assistant users would rather shop online than in-store, and more than half bought something online in the past week. They also want fewer steps to checkout. 18% say a social media “buy” button would most increase their chance of buying, which makes them 55% more likely than average to say so. On the brand side, 52% of smart speaker owners want to hear about deals, sales, and promotions.
(Source: GWI 1, Think with Google)
Voice Ad Statistics
38% of consumers who have heard a voice ad on a smart speaker say it is less intrusive than other ads. 39% say voice ads are more engaging.
Voice ads also drive sales. 40% of people who heard a voice ad went on to buy the product.
The table below shows how consumers respond to voice ads on smart speakers.
| Consumer response to voice ads | Share of listeners |
|---|---|
| Bought the advertised product | 40% |
| Find voice ads more engaging | 39% |
| Find voice ads less intrusive | 38% |
(Source: Adobe)
Voice Search and SEO Statistics
About 80% of voice search answers come from the top three organic search results. Pages that win voice answers also tend to be fast, secure, and detailed.
Voice answers are short, at about 29 words on average. Only 1.71% of voice answer pages use the exact query in their title tag, which shows that page relevance matters more than exact keyword matching. Nearly 20% of all voice queries start with the same 25 keywords, mostly question words like “how” and “what” and descriptive words like “best” and “easy.” Also, 90% of voice queries are in English.
Google indexes the mobile version of a page first, and most voice searches happen on phones. Yet only 13% of marketers actively optimize for voice search.
The table below shows the common traits of pages that rank in voice search results.
| Voice search ranking metric | Value |
|---|---|
| Voice answers taken from featured snippets | 40.7% |
| Average length of a voice answer | 29 words |
| Average page load time | 4.6 seconds (52% faster than average) |
| Pages with an exact-match title tag | 1.71% |
| Average word count of ranking pages | 2,312 words |
| Ranking pages that use HTTPS | 70.4% |
(Source: Keywords Everywhere, Backlinko, seoClarity, UpCity, Google1, HubSpot)
Voice Search for Businesses
91% of brands have made substantial investments in voice search. Yet only 4% of US businesses are ready for voice search, based on an analysis of nearly 75,000 companies.
That is an 87-point gap between investment and readiness. The brands that did invest see results. 58% say the benefits beat their expectations, and they report a 20% drop in customer service costs.
Voice-driven calls are also valuable. Phone calls convert to 10 to 15 times more revenue than web leads.
The table below shows how brands view voice search.
| Brand view on voice search | Share of brands |
|---|---|
| Have made substantial investments | 91% |
| Believe it will improve user experience | 71% |
| Believe it can raise conversions and revenue | 66% |
| Say benefits exceeded expectations | 58% |
(Source: Algolia, Search Engine Land, BIA/Kelsey)
How Professionals Use Voice Technology
Subtitles and closed captions are the top business use of voice technology, used by 14% of industry professionals. Customer experience and analytics come second at 12%.
The table below shows how industry professionals use voice technology.
| Use case | Share of professionals |
|---|---|
| Subtitling and closed captioning | 14% |
| Customer experience and analytics | 12% |
| Media and communications monitoring | 10% |
| Web conferencing transcription | 9% |
| Education, academic, and research transcription | 7% |
| Automotive command and control | 7% |
| Digital asset management | 6% |
| Chat app messaging | 5% |
| Compliance | 2% |
| Other | 28% |
(Source: Statista 6)
Voice Search Accuracy
Google Assistant is the most accurate major voice assistant, answering 92.9% of questions correctly in a 2019 test and handles more than 1 billion voice searches every month globally. Siri answered 83.1% correctly, and Alexa answered 79.8%.
All three understood almost every question, so the problem is giving the right answer, not hearing the words. Across the three assistants, the average correct answer rate is 85.3%. Alexa has the widest gap between understanding and answering, at 20.1 points. Google’s speech recognition itself is right about 95% of the time.
The table below compares how well each assistant understood and answered questions.
| Voice assistant | Questions understood | Answered correctly | Gap |
|---|---|---|---|
| Google Assistant | 100% | 92.9% | 7.1 points |
| Siri | 99.8% | 83.1% | 16.7 points |
| Alexa | 99.9% | 79.8% | 20.1 points |
How Accents, Age, and Noise Affect Accuracy
Speech recognition works best with clean audio, with a word error rate of about 3.5%. The error rate rises to about 12% in noisy places and about 15% with strong accents.
Background noise raises errors by about 3.4 times. Speech systems make more mistakes with Indian, Australian, and British accents than with standard American English, but accent training lowers these errors.
Accuracy is also much lower for adults aged 60 to 81 than for adults aged 28 to 36. Newer models such as Whisper and AssemblyAI now reach match error rates of about 0.054 to 0.063 on accented speech.
The table below shows average word error rates under different speaking conditions.
| Speaking condition | Average word error rate |
|---|---|
| Clean speech | 3.5% |
| Noisy environment | 12% |
| Strong accent | 15% |
(Source: VoiceToNotes, ResearchGate, ACM, arXiv)
Voice Search and Generative AI
Voice search and AI chatbots are merging. Nearly 1 in 3 voice assistant users have used ChatGPT in the past month.
These users want connected tools. Voice assistant users are 59% more likely than average to say integration with other apps and services is key to how they use AI. Among Gen Z AI users, more than 1 in 10 say voice integration is the most important feature, more than any other generation.
The big platforms are moving the same way. Google is replacing Google Assistant with Gemini as its main assistant on mobile. Real-time voice APIs from OpenAI and Vapi can now respond to spoken input in under 300 milliseconds, which makes voice conversations with AI feel close to natural speech.
(Source: GWI 1, Google 2, Vapi)
Voice Search Challenges
Accuracy is the biggest barrier to voice technology adoption, named by 73% of respondents. Accent and dialect recognition problems come second at 66%.
Recognition problems outrank cost by a wide margin. Accuracy is named 1.9 times as often as cost, which sits at 39%. Data security and privacy is named by only 5%.
The table below shows the main challenges in adopting voice technology.
| Challenge | Share of respondents |
|---|---|
| Accuracy | 73% |
| Accent or dialect recognition issues | 66% |
| Cost | 39% |
| Language coverage | 38% |
| End-user expectations | 38% |
| Complex deployment and integration | 29% |
| Flexibility to meet the use case | 25% |
| Operational support | 21% |
| Data security and privacy | 5% |
| Other | 4% |
(Source: Statista 4)
Voice Search Myths vs Reality
Many popular voice search predictions did not come true. The clearest example is smart speaker ownership, which stayed near 35% instead of reaching the predicted 75% of US households by 2025.
Several other widely shared claims also do not match the data. The table below compares common voice search claims with what the numbers actually show.
| Popular claim | What the data shows |
|---|---|
| 75% of US households will own a smart speaker by 2025 | 35% of Americans aged 12 and older owned one in 2025 |
| Voice search use grows every year | Global use peaked at 22.5% in Q2 2022 and has stayed near 20% since |
| Most voice searches are “near me” searches | 16% of users name “near me” as their main use, and 22% of voice queries are local |
| Voice answers mostly come from featured snippets | 40.7% did in 2018, while about 80% come from the top three results |
| People mainly use voice to buy products | 22% of voice shoppers buy by voice, while 51% only research |
(Source: Keywords Everywhere, Edison Research 2, DataReportal 1, UpCity, G2, Backlinko, Narvar)
Final Thoughts
Voice search is now a steady habit, not a fast-growing trend. About 1 in 5 internet users use it, and that share has held near 20% since 2022.
The hardware side has also leveled off, with US smart speaker ownership flat at about 35% for four years.
The real value of voice sits in a few clear areas. It is strongest for quick answers, local searches, and product research.
People who find a business by voice often call it, and calls are worth far more than web leads. Voice shopping is growing, but most people still use voice to research and then buy another way.
Assistants are being rebuilt on large language models, and voice users are already heavy users of AI chatbots. This will likely make voice answers longer and more conversational.
Our verdict is simple. Voice search will not replace typing, but it rewards the same basics as good SEO. Rank in the top three results, keep your local listings complete, answer common questions directly, and make sure your site loads fast on mobile. Brands that do this well will be ready for both voice search and AI search.
FAQs
What is the difference between voice search and a voice assistant?
Voice search is the act of searching by speaking. A voice assistant, such as Siri, Alexa, or Google Assistant, is the software that listens to the request and returns an answer or completes a task.
Does voice search work without an internet connection?
Most voice searches need an internet connection to find answers. Some phones can handle basic commands, like setting an alarm, offline.
Are voice searches longer than typed searches?
Yes. People speak in full sentences and questions, so voice queries are usually longer and more conversational than typed ones.
Can I delete my voice search history?
Yes. Google, Amazon, and Apple let you review and delete your voice history in your account or privacy settings.
Does voice search support Hindi and other Indian languages?
Yes. Google voice search and Google Assistant support Hindi and several other Indian languages.
Do voice search results show ads?
Voice searches on a phone usually open a results page that can include ads. Smart speakers usually read out a single answer without showing ads.
