

Marketers spend about 12 hours a week on keyword research, yet Google Keyword Planner, the tool most of them use, overestimates search volume for 91.45% of keywords.
Most teams still build lists around broad, high-volume terms that overstate demand and understate difficulty.
Meanwhile, close to 70% of real search traffic sits in specific long-tail phrases they skip. The result is wasted hours, misread demand, and content that ranks for terms no one converts on.
Plan a smarter keyword strategy for 2026. This article provides essential data on Keyword research demand, intent, difficulty, and performance to help you focus on what really matters.
Let’s quickly get into it.
Keyword Research Stats (2026): Key Highlights
- 63% of marketers use Google Keyword Planner as their primary keyword research tool.
- Google Trends’ Trending Now section refreshes in every 10 minutes.
- Google Keyword Planner overestimates search volume for 91.45% of keywords, per an Ahrefs study of 72,635 terms, leaving it roughly accurate only 45.55% of the time.
- Marketers spend an average of 12 hours a week on keyword research.
- 68% of businesses track competitor keywords in 2026, up from 45% in 2021.
- Long-tail keywords account for roughly 70% of all search traffic.
- 45% of keywords carry medium difficulty (KD 30 to 70), and only 25% are low difficulty.
- Long-tail keywords face about 80% less competition than short-tail terms.
- The top three organic results capture about 75% of all clicks, and the number one result averages a 27.6% click-through rate.
- About 46% of all Google searches carry local intent.
- 27% of keywords have zero recorded search volume.
- The global search ad market is projected to reach $227 billion by the end of 2026.
Keyword Search Volume And Scale Statistics
Keyword research starts with demand, and demand runs at a massive scale. Google handles about 5.9 million searches a minute, close to 8.5 billion a day, and 3.1 trillion a year.
Search is also where most journeys begin, since 93% of online experiences start with a search engine. Every keyword list is really a map of where that demand sits. 8 out of 10 SEO experts consider keyword research one of the most important parts of SEO.
15% Of Daily Google Searches Are Brand New
About 15% of daily Google searches are brand new queries that have never been searched before. Roughly 80% of queries are unique in a given month, so the same user rarely repeats the exact phrase.
This churn is the reason keyword research is an ongoing task rather than a one-time project. It is also why 27% of keywords in most tools show zero recorded volume even when real people search them.
60% Of Google Searches Happen On Mobile
About 60% of Google searches happen on mobile devices. Phone users phrase queries differently from desktop users, so the same intent often produces shorter or more conversational keywords.
A research list built only for desktops can miss half the demand. The most searched keyword worldwide and in the US is “YouTube,” with youtube.com pulling the most traffic from Google.
Daily, Per-minute, And Yearly Google Query Volume
Google processes roughly 8.5 billion searches every day. That figure rose from the widely cited 3.5 billion a few years ago, an increase of about 143%.
To hold that much demand, Google’s search index now spans more than 100 million gigabytes of data. Google holds about 91% of the global search market.
Organic search alone drives 53% of all website traffic. That is why keyword research sits at the center of most growth plans.
(Source: Statista 1, StatCounter, Search Engine Journal, Keywords Everywhere, Embryo)
Keyword Length And Long-Tail Statistics
Most searches are longer and more specific than marketers assume, with long-tail keywords making up about 70% of all search traffic. Half of all queries run four words or longer.
That is the single biggest reason a research list of short head terms leaves most demand on the table. The breakdowns below show how query length is distributed and why the long tail wins engagement.
Distribution Of Queries By Word Count
Three to four-word queries are the most common length, used in 38.2% of US desktop searches and 39.9% of mobile searches. Shorter one to two-word queries make up 31.6% of desktop and 31% of mobile searches.
The table below lays out the full split, with the five-or-more-word share derived from the reported figures.
| Query length | Desktop share | Mobile share |
|---|---|---|
| 1 to 2 words | 31.6% | 31.0% |
| 3 to 4 words | 38.2% | 39.9% |
| 5 or more words (derived) | 30.2% | 29.1% |
Long-tail Keywords Drive 70% Of Search Traffic
Long-tail keywords drive the majority of searches, accounting for around 70% of all search traffic. About half of all search queries are four words or longer, which signals users looking for specific answers rather than broad topics.
Ahrefs found that even among high-volume terms, more than 29% of keywords with over 10,000 monthly searches contain three or more words.
Search demand splits sharply toward the tail, with long-tail phrases making up 70% of searches per Experian. Fat-head keywords, the top 100 to top 10,000 terms with tens of thousands to millions of monthly searches, account for just 18.5%, and chunky middle keywords add 11.5%.
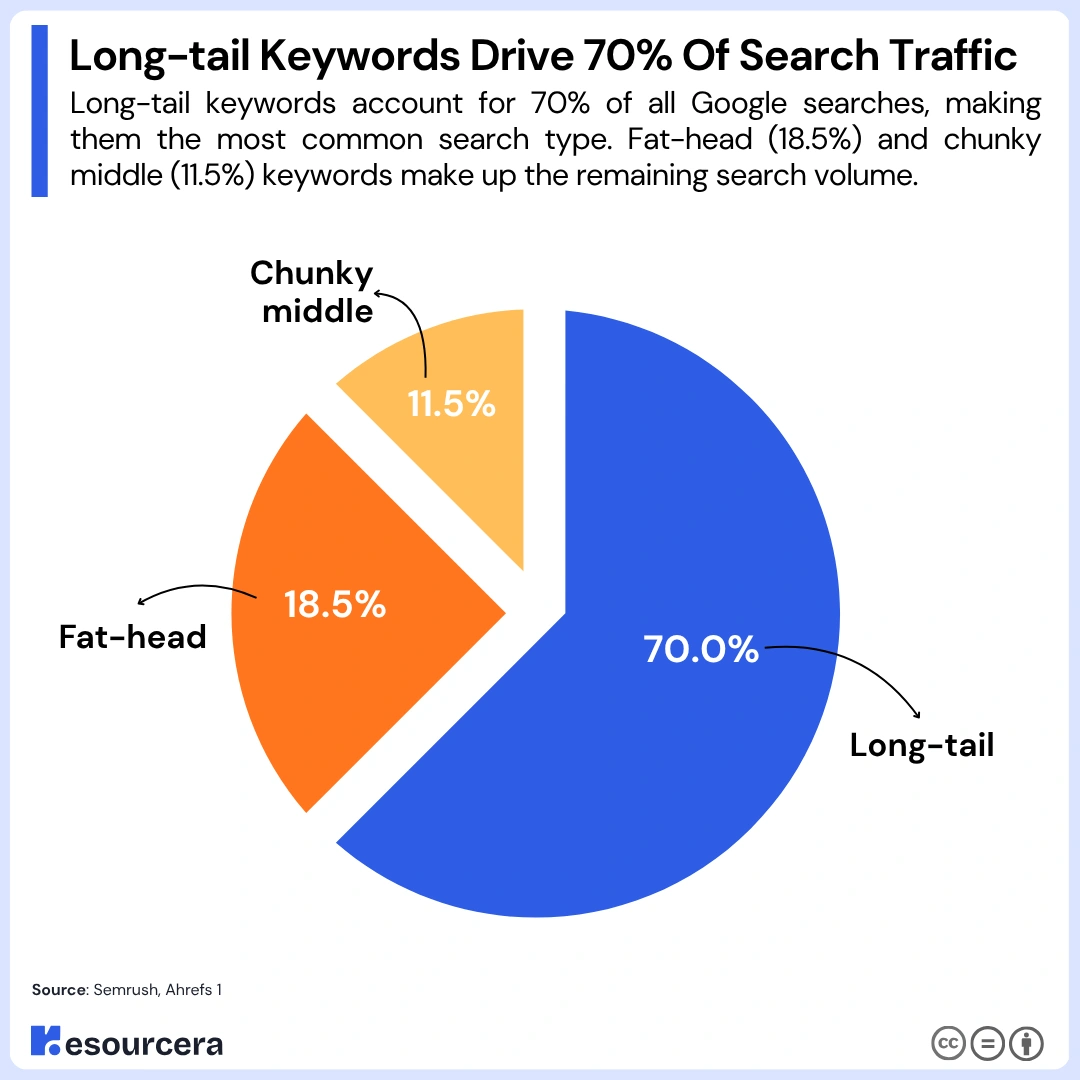
Combined, fat-head and chunky middle terms make up only 30% of all searches, leaving 70% of demand in specific long-tail phrases.
| Keyword type | Share of searches |
|---|---|
| Long-tail | 70.0% |
| Fat-head | 18.5% |
| Chunky middle | 11.5% |
Click-through Rate By Keyword Length
Long-tail terms draw about 1.76 times more click-throughs than very short keywords in organic results. Keywords that run 10 to 15 words receive 2.62 times more clicks than one-word keywords.
Among long-tail phrases, four-word keywords post the highest click-through rate at 31.8%, followed by five to nine-word keywords at 31.0%.
| Keyword length | Click-through rate |
|---|---|
| 4 words | 31.8% |
| 5 to 9 words | 31.0% |
(Source: Semrush, Ahrefs 1, Backlinko 1, Experian, BrightEdge, Embryo)
Keyword Types And Search Intent Statistics
Most keywords carry either informational or transactional intent, and the two together cover about 81% of queries. Matching a keyword to the right page roughly doubles the chance a user converts.
Commercial keywords, the ones that show buying research, make up roughly 22% of all search queries. Nearly half of users, about 45%, begin a search with a question word like how, what, or why.
That is why sorting a research list by intent matters more than sorting it by volume.
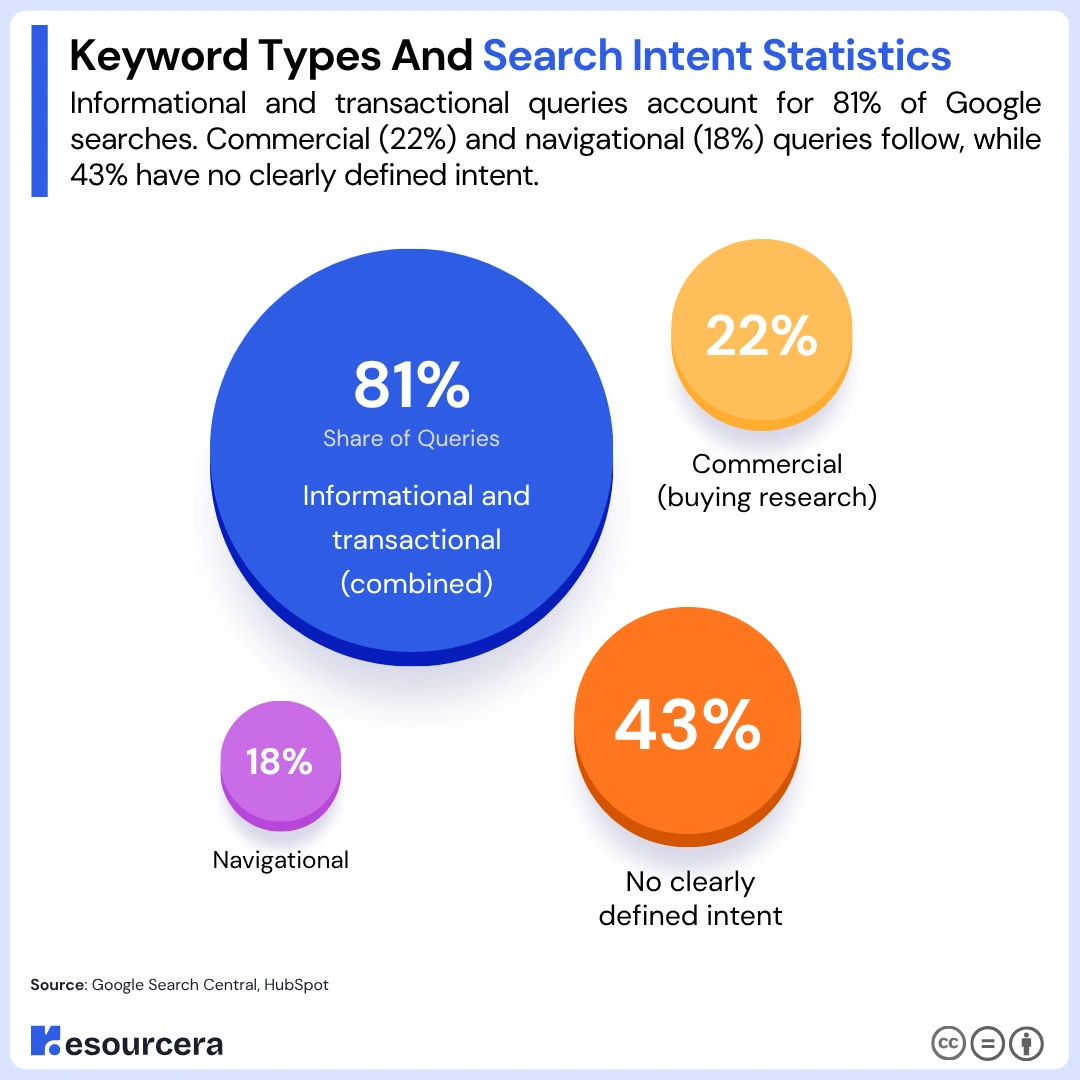
The table below shows how the main intent signals are split.
| Intent signal | Share of queries |
|---|---|
| Informational and transactional (combined) | 81% |
| Commercial (buying research) | 22% |
| Navigational | 18% |
| No clearly defined intent | 43% |
A large share of keywords resist easy classification, with about 43% having no clearly defined search intent. That gap makes research harder, since a page built for the wrong intent tends to lose the click.
Trending Keywords
- Google’s Trending Now section refreshes every 10 minutes, giving marketers up to 144 updates per day to identify fast-growing search topics.
- A keyword labeled “Breakout” in Google Trends has increased by more than 5,000% compared with the previous period, signaling a sudden surge in search demand.
- In 2025, searches beginning with “Tell me about” grew 70% year over year, showing that users increasingly want detailed explanations rather than short answers.
- Searches starting with “How do I” increased 25% in 2025 and reached an all-time high, highlighting strong demand for tutorials, guides, and problem-solving content.
- For historical analysis, Google provides 5 years of daily US trending-keyword data and 1 year of hourly data, helping marketers compare short-term spikes with long-term search patterns.
Evergreen Keywords
Evergreen keywords continue attracting searches long after content is published. Their value is reflected in Google’s search results, where 72.9% of top-10 pages are more than three years old and the average number-one result is five years old.
Older content can also generate a significant share of website performance. HubSpot found that posts published before the current month produced 76% of its monthly blog views and 92% of its blog leads. Just 30 older posts accounted for 46% of all monthly blog leads.
However, evergreen content still requires maintenance. Marketers should monitor search demand over several years and review data-heavy evergreen pages every six to 12 months to replace outdated statistics, examples, and sources.
45% Of Users Start Searches With A Question
About 45% of all users open a search with a question word like how, what, or why. Around 90% of voice queries are conversational.
Keywords framed as questions also earn about 22% higher click-through rates than statement-style keywords. Pulling question phrases into a research list is one of the fastest ways to lift engagement.
How Buying Intent Changes Keyword Value
“Buy” keywords convert about 9% higher than informational keywords. Those same purchase terms show a 30% lower lead-to-customer rate, since many buyers compare before committing.
Users are about twice as likely to convert when a keyword matches the intent of the landing page.
(Source: Google Search Central, HubSpot, WordStream 1, Embryo)
Keyword Competition And Difficulty Statistics
Keyword competition is heavily skewed, with 45% of keywords sitting at medium difficulty and only 25% ranked as low. Authority decides most top spots, as three in four leading results for hard keywords come from strong domains.
Reading difficulty scores before drafting saves months of effort on terms a site cannot win. The breakdowns below show where the competition sits and what it takes to rank.
Keywords By Difficulty Level
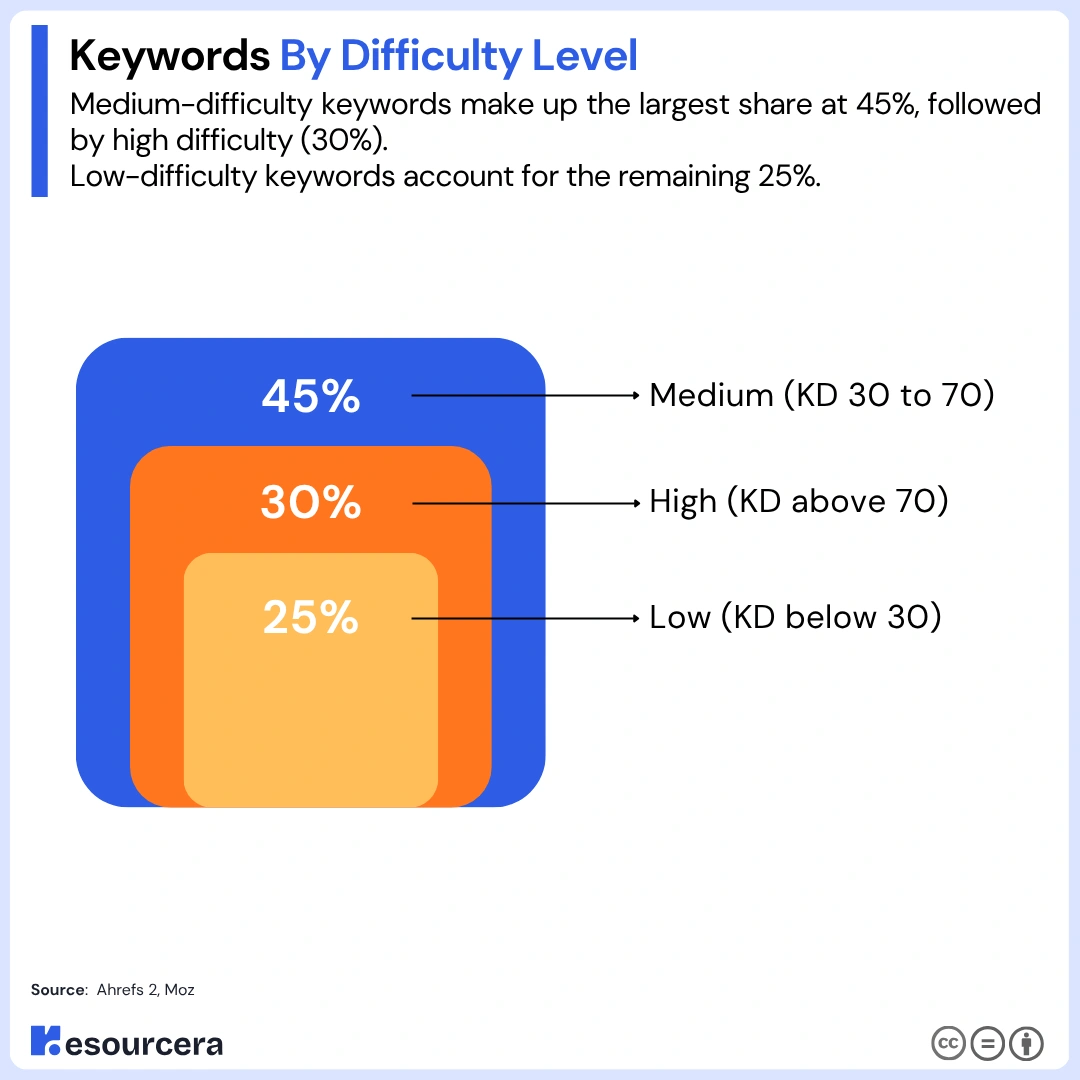
Most keywords fall in the medium band, with 45% carrying difficulty scores between 30 and 70. High-difficulty keywords above 70 make up 30%, and low-difficulty terms below 30 account for the remaining 25%.
| Keyword Difficulty | Share of keywords |
|---|---|
| High (KD above 70) | 30% |
| Medium (KD 30 to 70) | 45% |
| Low (KD below 30) | 25% |
75% Of Top Results for Hard Keywords Have a DA of 40 or Higher
For competitive terms scoring KD 70 to 100, 75% of top results come from domains with a Domain Authority of 40 or higher. Domain Rating and Domain Authority are third-party metrics from tools like Moz and Ahrefs, not Google scores, so treat them as directional.
The link between authority and rank is clear either way. The number one result carries about 3.8 times more backlinks than results ranked two through ten.
Long-tail Keywords Face 80% Less Competition
Long-tail keywords face about 80% lower competition than short-tail terms. Very great difficulty keywords, those scoring 80 to 100, have only about a 1% chance of ranking in the top 10.
That gap is why smaller sites win faster on specific phrases. A research list weighted toward the tail tends to outperform one built on volume alone.
Branded Keywords Face 95% Lower Competition
Branded keywords run about 95% lower difficulty than non-branded terms, because they target an audience that already knows the brand. Non-branded terms fight far harder for the same positions.
This is also shaped by Google’s ranking system, which weighs more than 200 factors and updates 500 to 600 times a year. A research list has to be revisited as those signals shift.
(Source: Ahrefs 2, Moz, Backlinko 2)
Keyword Click-Through Rate Statistics
Clicks cluster at the very top, with the top three organic results capturing about 75% of all clicks and the number one result earning a click-through rate near 27.6%. Almost no one moves past the first page.
So a keyword is only worth researching if a site can realistically reach the top of it. The sections below show how clicks fall by position, device, and keyword type.
CTR By Organic Ranking Position
The first result earns a click-through rate close to 27.6%, about 27.5% higher than the second position. On mobile, the top result draws 22.4%, dropping to 13% for second, 10% for third, and just 2.3% by tenth place.
The second page barely registers. Only 0.63% of users click through to it, and those results see click-through rates under 2.4%.
| Mobile Organic Position | Click-through rate |
|---|---|
| 1st | 22.4% |
| 2nd | 13.0% |
| 3rd | 10.0% |
| 10th | 2.3% |
Desktop Versus Mobile Organic CTR
Desktop keywords earn more clicks per search than mobile, at an average organic click-through rate of 2.51% against 1.72%. The smaller screen and heavier ad space on phones push organic links further down the page.
Even so, three in four users never scroll past the first page, and first-page sites capture about 91.5% of all search traffic.
CTR By Keyword Type
Keyword type changes click behavior as much as position does. Branded keywords earn about 60% higher click-through rates than non-branded terms, and long-tail keywords earn roughly twice the rate of short-tail terms.
Question-style keywords pull about 22% higher click-through rates than statement keywords. Users also decide fast, with half clicking within 9 seconds and an average of 14.6 seconds to the first click.
| Keyword Type | Click-through rate lift |
|---|---|
| Branded vs non-branded | +60% |
| Question vs statement | +22% |
| Long-tail vs short-tail | About 2x |
(Source: Backlinko 1, Semrush, Search Engine Journal, Embryo)
Keyword Conversion And Performance Statistics
Specific keywords convert better than broad ones, with long-tail terms driving 55% of all e-commerce conversions despite being lower-volume phrases. A top-ranking position also converts far better than a mid-page one.
So a research list should be judged on conversion potential, not just traffic. A portfolio of many long-tail phrases often outperforms a few broad head terms on revenue.
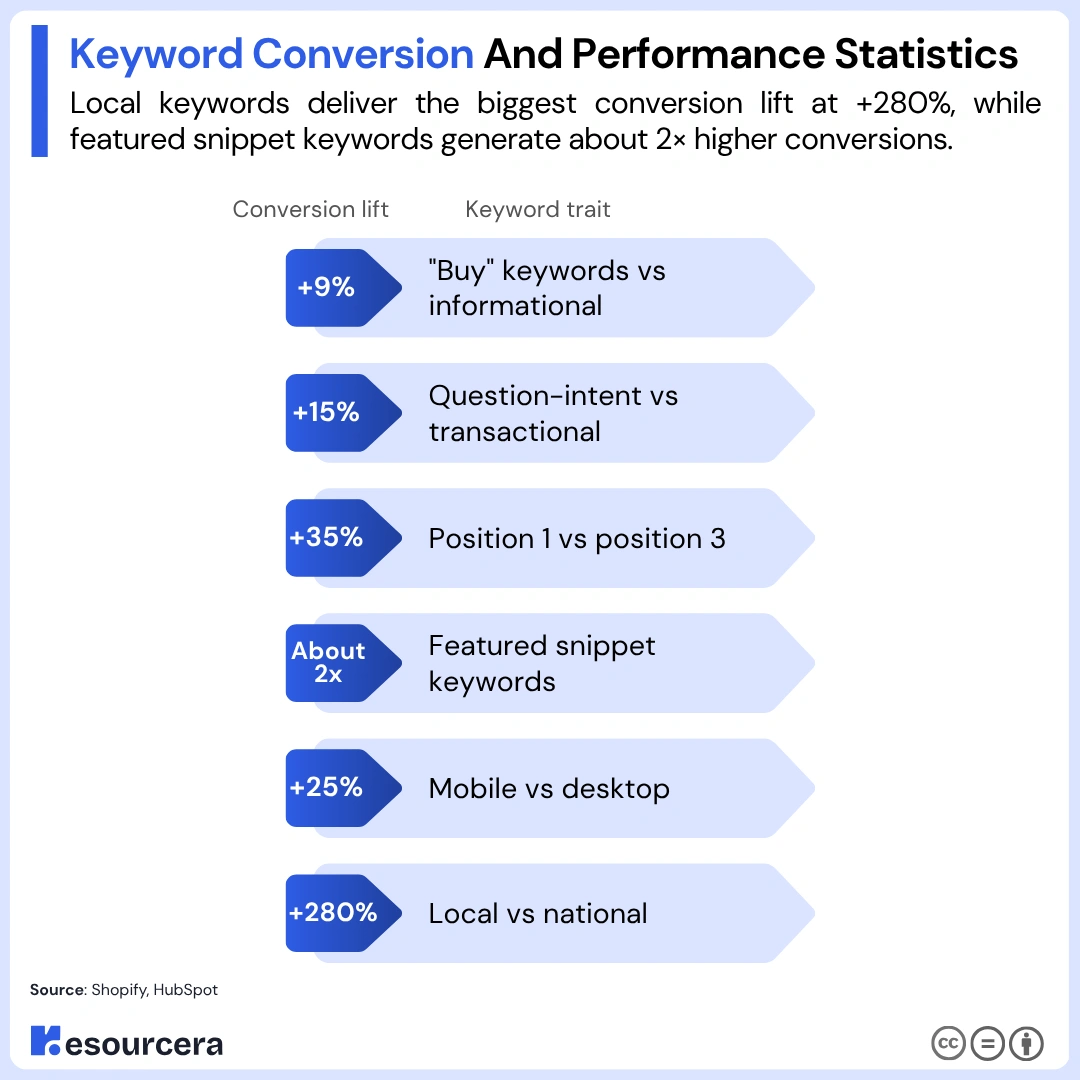
The table below sums up how different keyword traits lift conversions.
| Keyword Trait | Conversion Lift |
|---|---|
| “Buy” keywords vs informational | +9% |
| Question-intent vs transactional | +15% |
| Position 1 vs position 3 | +35% |
| Featured snippet keywords | About 2x |
| Mobile vs desktop | +25% |
| Local vs national | +280% |
Position And Intent Shape Conversions
“Buy” keywords convert about 9% higher than informational keywords, and question-intent keywords convert about 15% higher than plain transactional keywords. The trade-off is that high-intent buy terms show a 30% lower lead-to-customer rate as shoppers compare options.
Keywords ranking in position one convert about 35% higher than those in position three. Featured snippet keywords convert about twice as well, since they pull extra visibility above the standard results.
Device And Locality Shift Outcomes
Mobile keywords convert about 25% higher than desktop keywords, thanks to stronger on-the-go intent. Local keywords convert roughly 280% better than national terms.
Google Ads users report an average return on investment of 212% from keyword targeting, rising to 275% in B2B industries.
(Source: Shopify, HubSpot, BrightLocal, Google Ads)
Local And Near Me Keyword Statistics
Nearly half of all searches are local, with about 46% of Google queries showing local intent and 77% of people turning to Google for local business details. Around 21% of US consumers use the internet daily to find local businesses, and another 32% do so several times a week.
Any research list for a business with a physical location needs city and “near me” modifiers built in.
Local phrasing has surged, with “near me” searches growing by about 150%, and about 88% of local business searches are now using the phrase.
Google earlier reported a 200% jump in mobile searches using “where to buy” and “near me.” These modifiers make intent obvious, which is why local pages built around them tend to convert well.
Local Search To Store Visit And Purchase Behavior
About 88% of consumers who run a local search visit or call a store within 24 hours. Around 18% of local searches on smartphones lead to a purchase within one day, compared with just 7% for non-local searches.
Around 60% of smartphone users also contact a local business directly from the search results, often through a click-to-call link.
| Local search action | Share of users |
|---|---|
| Visit or call a store within 24 hours | 88% |
| Purchase within one day (local search) | 18% |
| Purchase within one day (non-local search) | 7% |
| Contact a business directly from results | 60% |
63.6% Check Google Reviews Before Visiting
About 63.6% of people say they are likely to check Google reviews before visiting a business. A complete Google Business Profile makes a company appear 2.7 times more reputable to searchers.
Businesses with a complete profile are 70% more likely to earn visits and 50% more likely to be considered for a purchase.
(Source: Statista 2, Think with Google, BrightLocal, ReviewTrackers, WebFX, Keywords Everywhere)
Voice Search Keyword Statistics
Voice search now accounts for about 20% of all mobile searches, and about 33.6% of US internet users aged 16 to 64 use voice assistants each week. Over 145 million people in the US are expected to use voice assistants, led by smartphones.
A research list that ignores spoken phrasing misses a growing slice of demand.
Voice keywords are longer and more conversational than typed searches, with about 90% phrased as natural, spoken questions. That pushes research toward full-sentence, question-based phrases instead of short head terms.
Most voice queries cover everyday needs like weather, music, and news. In the US, more than half of voice search users have used it for food delivery.
Voice Assistant Adoption And Growth
Voice usage is highest among younger generations, with 61.9% of US Millennials using voice assistants each month. Gen Z follows at 55.2%, Gen X at 51.9%, and Baby Boomers well behind at 31.5%.
About 38.8 million people in the US, or 13.6% of the population, use smart speakers for shopping tasks like researching or adding items to a cart.
| Generation | Monthly voice assistant use (US) |
|---|---|
| Millennials | 61.9% |
| Gen Z | 55.2% |
| Gen X | 51.9% |
| Baby Boomers | 31.5% |
(Source: Backlinko 3, eMarketer, Keywords Everywhere)
Keyword Research Practices And Tools Statistics
Keyword research is a regular, tool-driven task, with 63% of marketers using Google Keyword Planner as their main tool and teams spending about 12 hours a week on it.
It is also central to content, since 75.5% of marketers use keyword research to shape what they publish, and 78% of B2B marketers build content around it.
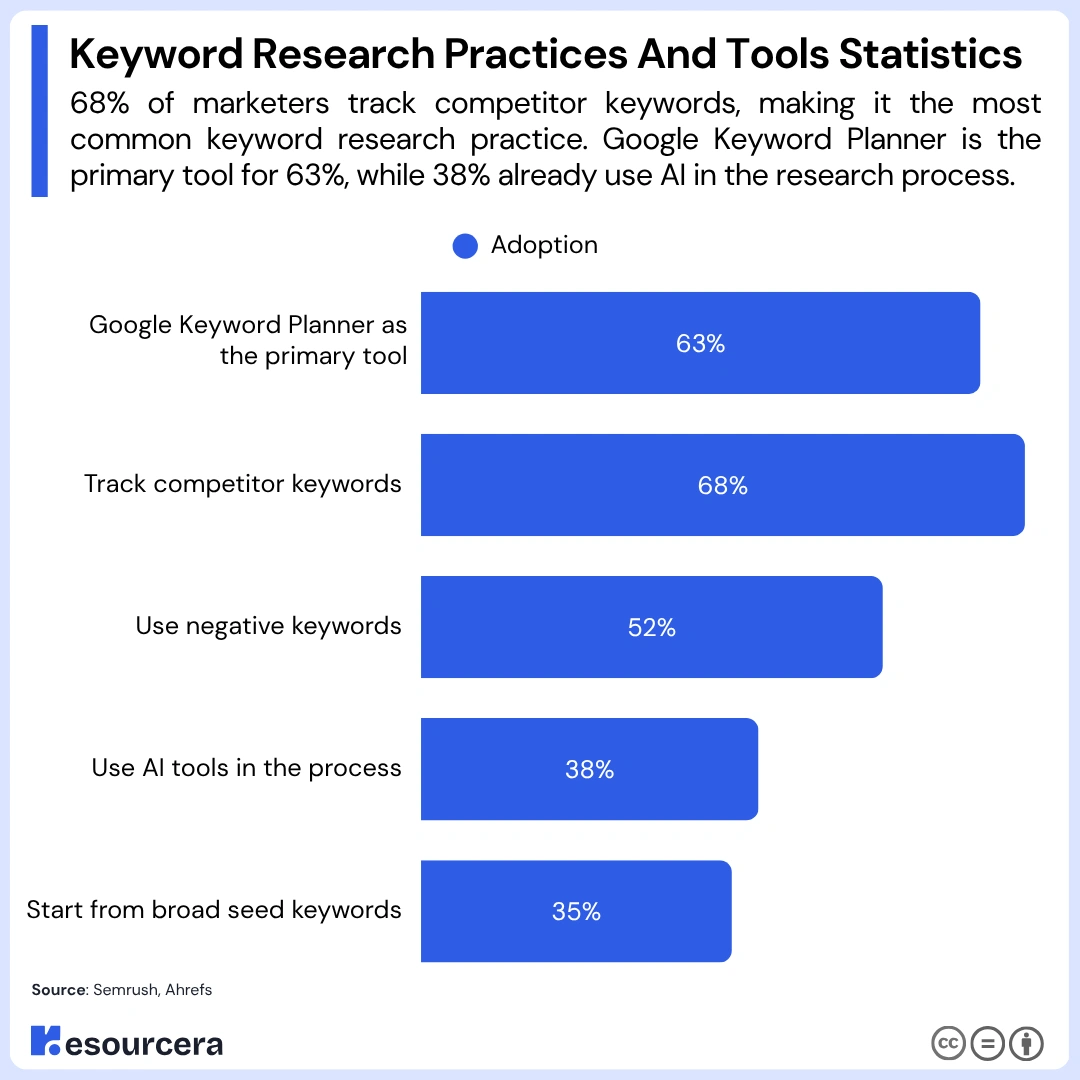
The table below shows how common the main research practices have become.
| Keyword Research Practice | Adoption |
|---|---|
| Google Keyword Planner as the primary tool | 63% |
| Track competitor keywords | 68% |
| Use negative keywords | 52% |
| Use AI tools in the process | 38% |
| Start from broad seed keywords | 35% |
Competitor tracking has climbed fast, reaching 68% of businesses, up from 45% in 2021, a rise of 23 percentage points in two years. About 35% of brands start from broad seed keywords, and 89% of the resulting terms turn out to be targetable.
Google Keyword Planner Overestimates Volume 91.45% Of The Time
The most-used tool is also the least precise on volume. An Ahrefs study of 72,635 keywords found that Google Keyword Planner overestimates search volume for 91.45% of terms and drastically overestimates 54.28% of them.
That leaves the tool roughly accurate only about 45.55% of the time, since it groups similar keywords and reports pooled figures. Many researchers cross-check its estimates against Google Search Console impressions, which track actual queries.
This is also why 27% of keywords showing zero volume can still attract real, specific searches. The study dates from earlier years, so treat the exact split as directional, though the grouping issue behind it still holds.
Marketers Spend 12 Hours A Week On Keyword Research
Marketers spend an average of 12 hours a week on keyword research, and about 38% now use AI tools as part of the process. Content depth matters alongside keyword choice, since the average Google first-page result runs about 1,890 words.
Filtering out waste is now standard, with 52% of brands using negative keywords to exclude irrelevant searches, led by e-commerce and SaaS teams. Combined with the 68% tracking competitor keywords, the data shows research has shifted from finding terms to managing a full keyword portfolio.
Common Keyword Research Mistakes
Over-optimization is the most common pitfall, with 39% of marketers struggling with keyword stuffing and 61% of Google penalties tied to over-optimization. About 27% of keywords have zero search volume, so chasing them without checking demand wastes effort.
Around 46.08% of Google Search Console clicks come from hidden queries, so visible reports show only part of a site’s search performance.
Marketers should also avoid outdated tactics such as meta keywords, keyword stuffing, and exact-match domains. Google gives the meta keywords tag no ranking value, and repeating keywords excessively can reduce content quality or violate its spam policies. There is also no ideal keyword density that guarantees higher rankings.
Content quality still helps, since pages with at least one image tend to rank higher than plain text.
(Source: Semrush, Ahrefs, Content Marketing Institute, WordStream 1, Backlinko 2)
Paid Search And Keyword Cost Statistics
Paid keywords are a large and growing market, with global search ad spend projected to reach $227 billion by the end of 2026 and an average cost per click of $4.66. Google Ads returns an estimated 700%, or about $8 in profit for every $1 spent across search and ads.
So paid data is a useful read on which keywords carry real commercial value. That return is the reason keyword bidding stays central to paid strategy.
The Average Google Ads CPC Is $4.66
The average Google Ads cost per click is $4.66 across all industries, with legal keywords the most expensive. Attorneys and legal services average $8.94 per click, followed by home and improvement at $6.96 and dental services at $6.82.
The table below combines the main benchmarks and the highest-cost or highest-performing categories.
| Google Ads metric | Average | Highest categories |
|---|---|---|
| Click-through rate | 6.42% | Entertainment and Arts 13.04%, Sports and Recreation 9.66%, Real Estate 9.20% |
| Cost per click | $4.66 | Attorneys and Legal $8.94, Home and Improvement $6.96, Dental $6.82 |
| Conversion rate | 6.96% | Automotive Repair 12.96%, Animals and Pets 12.03%, Physicians 11.08% |
Google Ads Convert At 6.96% On Average
The average Google Ads conversion rate is 6.96%, against an average click-through rate of 6.42%. Google also wins the click, since 63% of people are likely to click a paid ad on Google, compared with 15% on Amazon, 9% on YouTube, and 5% on Bing.
That makes Google ads about four times more likely to be clicked. Still, 55% of searchers skip paid ads entirely and go straight to organic results.
Long-tail Keywords And Lower Ad Costs
Long-tail keywords lower paid costs while improving relevance, since they draw less advertiser competition and cheaper clicks. Their specificity means the traffic that does arrive is closer to a purchase, which lifts return on ad spend.
Adding long-tail terms as negative keywords in broad campaigns also cuts wasted impressions on searches that never convert.
(Source: WordStream 2, Clutch, Google, Smart Insights, Keywords Everywhere)
Final Thoughts
The data points in one clear direction. Keyword research pays off when it favors specific over broad and accuracy over volume.
Long-tail keywords make up about 70% of all searches, face roughly 80% less competition, earn nearly twice the click-through rate, and drive 55% of e-commerce conversions. A research list weighted toward the tail beats one chasing head terms.
The SEO tools themselves need a skeptical eye, since Google Keyword Planner overestimates volume for 91.45% of keywords and 27% of terms show no recorded volume at all. Cross-checking demand is part of the job, not an extra step.
Layer on the shift to mobile, local, and voice, where 46% of searches are local, and 88% of local searchers act within a day, and the winning approach becomes clear. Group keywords by intent, read difficulty before you draft, build authority to hold the top spots, and treat research as an ongoing habit, since about 15% of daily searches are brand new.
Marketers who research how people actually search, rather than around the biggest numbers, will capture the traffic that converts in 2026.

