In digital marketing, visibility means nothing without clicks. And the numbers prove just how dramatic the difference can be. On Google’s organic search results, the #1 position captures as much as 39.8% to 43.3% of all clicks, meaning nearly half of searchers choose the very first result.
At the same time, on social media, CTRs typically range between 0.5% and 1.5%, but platform and format make a massive difference.
Across every channel, organic search, paid ads, email, social media, and e-commerce, one pattern is clear: small improvements in position, targeting, quality, and personalization can create exponential gains in clicks.
In this article, we break down the latest CTR statistics for 2026 across every major digital channel, highlighting benchmarks, industry differences, and the factors that truly drive engagement in 2026.
Key Click-Through Rate Statistics (2026)
- The number 1 Google result captures 39.8% to 43.3% of all clicks.
- Ads in Position 1 average 7.94% CTR, and high Quality Score ads (8 to 10) can reach 9.8%.
- The average email CTR sits around 2.62%. AI-powered personalization can increase CTR by 13% or more, pushing campaigns beyond the 4 to 5% range.
- TikTok’s high-impact TopView ads can achieve up to 14% CTR, significantly outperforming the typical 0.5% to 1.5% range across most social platforms.
- Google Search ads for e-commerce average 2.7% CTR, but well-optimized organic product listings can exceed more than 3%.
Organic Search CTR Statistics (Google)
According to FirstPage, the #1 result captures 39.8% of all clicks.

This is nearly two out of every five searchers clicking the very first link.
While a study by Resourcera, which analyzed over 4 million Google search results, puts the figure at 27.6%. The difference comes down to methodology and the searches analyzed, but both studies agree on the core takeaway: the top spot dominates click share by a wide margin.
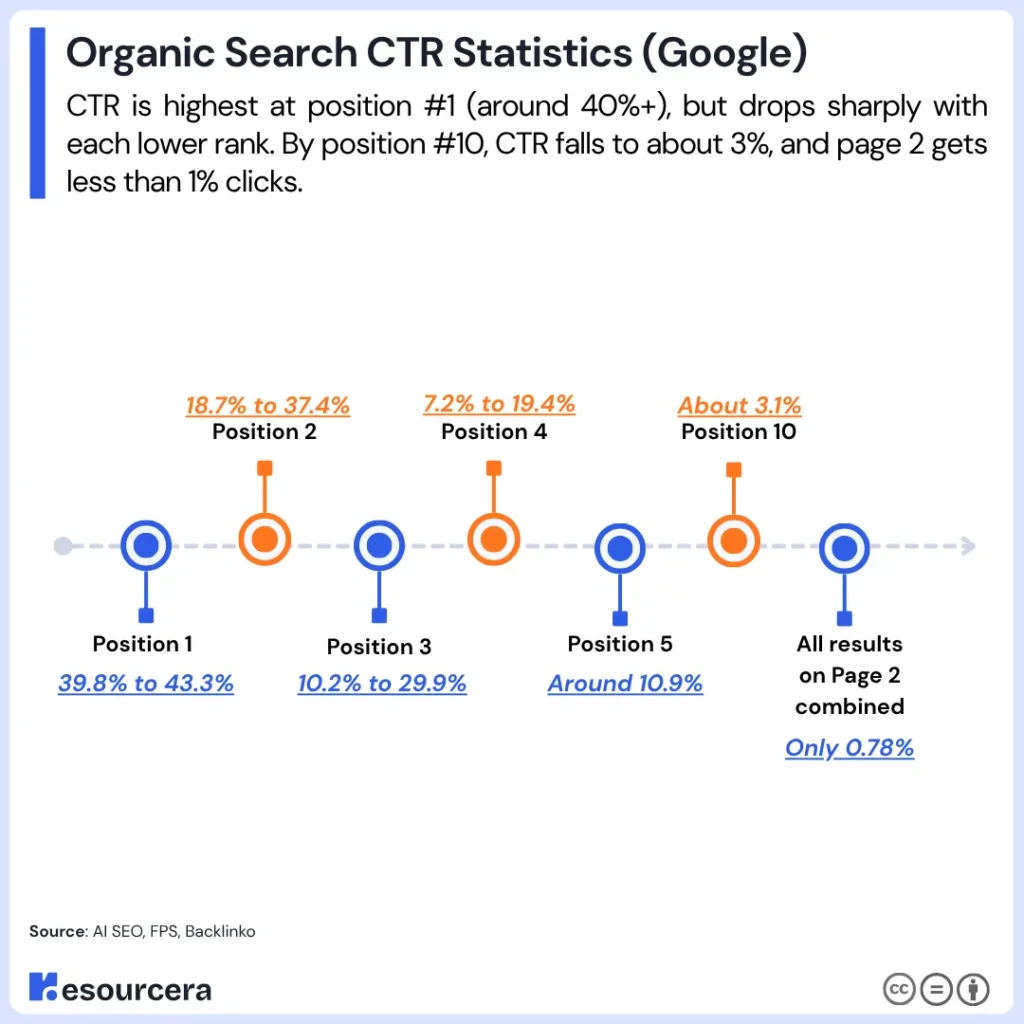
From there, traffic drops off sharply. The second position draws around 18.7% of clicks, and the third pulls in roughly 10.2%. By the time you reach Position 10, that figure falls to just 3.1%. And if your page sits on Page 2? All results combined capture only 0.78% of clicks, essentially invisible.
Interestingly, positions 8 through 10 perform almost identically, meaning small upward movements at the bottom of page one may not significantly increase traffic. However, on average, climbing just one position in rankings can improve CTR by 2.8%, though the impact is far greater when moving into the top three compared to shifting between lower spots.
Looking at the average CTR by position:
| Position | Average CTR |
|---|---|
| Position 1 | 39.8% – 43.3% |
| Position 2 | 18.7% – 37.4% |
| Position 3 | 10.2% – 29.9% |
| Position 4 | 7.2% – 19.4% |
| Position 5 | ~10.9% |
| Position 10 | ~3.1% |
| All of Page 2 combined | 0.78% |
This clearly shows how sharply CTR drops as rankings go down. Moving from position #2 to position #1 can increase clicks by 74.5%, which highlights the huge value of reaching the top spot.
CTR also varies by industry. Across industries, the average organic CTR is around 1.51%. However, some sectors perform better. For example, Automotive averages 3.5%, while Travel & Leisure averages 2.58%.
Device type also affects CTR. In Q3 2024, short search queries (one to three words) saw slightly higher CTR on mobile. However, both desktop and mobile CTRs have generally declined in recent reports, sometimes falling between 0.74% and 1.02% overall.
AI-powered overviews and direct answers are increasingly reducing CTRs, as users often find what they need without clicking through to a website.
To improve performance, it is important to optimize for rich results, such as featured snippets, images, review stars, and other enhanced listings.
Sources: AI SEO, FPS, Backlinko
Paid Search CTR Statistics (Google Ads)
Google Ads click-through rates vary widely depending on the industry and the level of user intent. Overall, the average Google Search campaign CTR in 2025 is 3.17%, but top performers achieve nearly double that.
Top-Performing Industries
Among all industries analyzed, Arts & Entertainment stands out as the strongest performer, with an impressive 10.67% search CTR and 1.55% display CTR, making it the clear leader.
Consumer Services follows with a strong 6.64% search CTR and 0.65% on display, while Dating & Personals achieve 6.05% on search and 0.72% on display. These industries tend to see higher clicks because users typically have a specific, urgent intent.
| Industry | Search CTR | Display CTR |
|---|---|---|
| Arts & Entertainment | 10.67% | 1.55% |
| Consumer Services | 6.64% | 0.65% |
| Dating & Personals | 6.05% | 0.72% |
Above-Average Performers
Several other sectors also perform above average. Travel & Hospitality records a 4.68% search CTR, while Advocacy sees 4.41%, and Automotive averages 4.00%. Education comes in at 3.78%, and Real Estate performs well with 3.71% search CTR and a relatively strong 1.08% display CTR, one of the highest display rates across industries. Health & Medical campaigns average 3.27% on search.
Average and Below-Average Performers
Industries categorized as average performers typically fall within the 2 to 3% range on search. For example, Legal (2.93%), Finance & Insurance (2.91%), E-commerce (2.69%), Industrial Services (2.61%), Home Goods (2.44%), Employment Services (2.42%), and B2B (2.41%) all sit within this mid-range performance band. At the lower end, Technology records a 2.09% search CTR and 0.39% display CTR, making it one of the worst-performing sectors in terms of engagement.
| Industry | Search CTR |
|---|---|
| Legal | 2.93% |
| Finance & Insurance | 2.91% |
| E-commerce | 2.69% |
| Industrial Services | 2.61% |
| Home Goods | 2.44% |
| Employment Services | 2.42% |
| B2B | 2.41% |
| Technology | 2.09% |
One of the most important findings in digital marketing and search engine optimization is the clear gap between search and display performance. On average, search network CTRs are 680% higher than display CTRs across industries, highlighting the stronger user intent behind search queries and search engine otimazation-driven traffic.
Additionally, industries that serve immediate or urgent needs, such as Consumer Services, Dating, and Auto, consistently generate higher engagement. In contrast, sectors with longer research and consideration cycles, such as Technology, B2B, and Home Goods, tend to see lower click-through rates.
Source: AgencyAnalytics Performance Report, First Page Sage, Varos Benchmarks, WordStream
CTR Statistics by Ad Position and Quality Score
Ads shown in Position 1 achieve an average CTR of 7.94%, making it the most valuable placement. However, performance within this position varies depending on Quality Score. Ads with a high Quality Score (8 to 10) reach an impressive 9.8% CTR, while those with a mid-range score (4 to 7) average 7.2%. Low-quality ads (scores 1 to 3) drop to 5.1%, showing how relevance and optimization directly influence engagement.
In Position 2, the average CTR declines to 5.23%. High-quality ads in this position still perform relatively well at 6.8%, but low-quality ads fall to just 3.2%, reinforcing the importance of maintaining strong ad relevance.
Performance continues to decrease in lower placements. Position 3 records an average CTR of 3.41%, while ads appearing in Position 4 or lower see CTR drop further to 1.92%.
The data highlights several important insights. First, ads in Position 1 generate 52% higher CTR than Position 2, proving the premium value of top placement. Second, Quality Score acts as a multiplier.
At Position 1, high-quality ads generate 92% higher CTR than low-quality ads. Finally, even ads in lower positions can remain competitive if they maintain strong keyword relevance, compelling ad copy, and high-quality landing pages.
Sources: Focus Digital, Varos Benchmarks
Email Marketing CTR Statistics
Email marketing performance in 2026 remains relatively consistent across industries, with the average click-through rate (CTR) ranging between 2.4% and 2.62%. While this is considered a standard benchmark, high-performing campaigns regularly exceed 4 to 5% CTR, proving that strategic optimization can significantly improve engagement.
Mobile behavior continues to shape performance metrics. With 86% of users checking emails on their smartphones, mobile campaigns can generate CTRs up to three times higher than desktop. On the flip side, 42.3% of recipients delete emails that are not optimized for mobile, making responsive design a necessity rather than an option.

Below is a snapshot of general email CTR benchmarks for 2025 to 2026:
| Metric | Benchmark |
|---|---|
| Average CTR | 2.62% |
| Common CTR Range | 0.77% to 4.36% |
| Click-to-Open Rate (CTOR) | 20% to 30% |
| AI-Driven CTR Lift | 13%+ increase |
| Mobile CTR vs Desktop | Up to 3x higher |
CTR performance also varies significantly by industry. Sectors with more targeted or relationship-based audiences typically see stronger engagement compared to highly competitive markets.
| Industry | Average CTR |
|---|---|
| Manufacturing | 4.29% |
| Real Estate, Design & Construction | 3.6% |
| Non-profits | 3.27% |
| Education & Training | 3.02% |
| Business & Finance | 2.0% to 2.78% |
| Retail | 0.7% to 1.74% |
| Technology | 1.1% to 1.3% |
In terms of optimization strategies, segmented and personalized campaigns frequently achieve 3 to 4% CTR or higher. Incorporating AI-driven personalization can further improve results by over 13%. Timing also plays a role, as emails sent on Mondays and Tuesdays generally record stronger engagement. Additionally, maintaining a 60/40 balance between text and images is commonly recommended for better performance.
Overall, while the average email CTR sits just above 2.5%, brands that prioritize personalization, segmentation, timing, and mobile optimization can push well beyond industry norms.
Sources: CodeCrew, ActiveCampaign, Click Dimensions, InCrev
Social Media Ads CTR Statistics
Social media advertising click-through rates (CTRs) in 2025 and 2026 typically range from 0.5% to 1.5% across major platforms. However, performance varies significantly depending on the platform, ad format, audience targeting, and industry.
Meta platforms continue to deliver steady engagement. On Facebook and Instagram, average CTRs range from 0.9% to 1.5%. Facebook feed ads tend to perform slightly better, often reaching 1.5% to 1.7%, while Instagram Reels featuring user-generated content (UGC) can push engagement as high as 3.8%.
TikTok stands out for high-impact placements. While average CTRs vary, TopView ads, which appear prominently when users open the app, can achieve CTRs of up to 14%, especially when paired with highly engaging video content.
LinkedIn typically records lower CTRs due to its niche, professional audience. The platform averages between 0.44% and 0.65%, reflecting its more targeted B2B focus rather than broad consumer engagement.
On X (formerly Twitter), ad CTRs generally range from 1% to 2%. Promoted tweets perform better, averaging 1% to 3%, compared to organic posts, which typically generate 0.5% to 1.5% CTR. Meanwhile, YouTube ads record an average CTR of approximately 0.65%, although video quality and targeting play a major role in performance.
Sources: Quimby, Marketing LTB, Ignite Visibility
E-Commerce & Product CTR Statistics
When looking at e-commerce click-through rates across different channels, performance varies significantly depending on where and how products are promoted.
On Google Search, e-commerce ads average around a 2.7% CTR, giving brands a reliable benchmark for paid product visibility. These text-based search ads benefit from strong purchase intent, which generally results in higher engagement compared to other advertising formats.
In contrast, Google Shopping ads typically generate less than 1% CTR. Although Shopping ads are visually appealing and display product images and prices directly in search results, competition is intense, and click share is spread across multiple listings. That said, certain product categories consistently outperform others.
For organic search results, e-commerce product pages usually see CTRs ranging between 1.8% and 3.2%, depending on ranking position and optimization quality. Well-optimized listings with compelling titles, meta descriptions, and rich snippets can exceed 5.5% CTR, especially when they appear near the top of search results.
Email marketing tells a slightly different story. E-commerce email campaigns often record CTRs below 2%, particularly for standard promotional newsletters. However, automated campaigns such as abandoned cart reminders and personalized product recommendations can drive significantly higher engagement.
On social media platforms, product ad CTRs generally fall below search benchmarks. While performance depends heavily on targeting and creative quality, social ads typically capture lower click-through rates because users are browsing rather than actively searching to buy.
Sources: WifiTalents, AmraandElma, SmartBuy, Mailmend