
Hulu has 64.1 million subscribers, and that number is frozen. It comes from the quarter ended September 27, 2025, the last time Disney published a Hulu subscriber count before deciding the metric was no longer worth reporting.
Hulu went out on its best quarter ever. It added 8.6 million subscribers in three months, more than twice what it had added across the previous nine, then the disclosure stopped.
Since then, the live TV arm has been merged into Fubo, and the app itself is being folded into Disney+.
So 2026 is a strange year to write about Hulu. The service is larger than it has ever been and harder to see than it has ever been.
This report covers what the final numbers showed and what has replaced them. You will find Hulu’s subscriber history, revenue, ARPU, market share, pricing, demographics, engagement, web traffic, and where the platform goes from here.
Key Highlights From Hulu Statistics 2026
- Hulu reached 64.1 million subscribers in its final reported quarter, up 23.27% year over year.
- 8.6 million subscribers joined in a single quarter, the largest three-month gain in Hulu’s history.
- Hulu SVOD accounts for 93.1% of all Hulu subscriptions, with live TV making up the remaining 6.9%.
- Hulu makes up 32.7% of Disney’s 196 million streaming subscriptions.
- Hulu generated an estimated $12.6 billion in revenue in 2025.
- A Hulu live TV subscriber is worth 8.2 times an on-demand subscriber, at $100.02 per month against $12.20.
- Hulu holds 11% of the US SVOD market, down from a peak of 27% in 2019.
- 78% of Hulu subscribers are on the ad-supported plan.
- Hulu.com received 143.1 million visits in May 2026, with 99.31% of that traffic coming from the United States.
- Disney’s streaming operating income grew from $143 million in fiscal 2024 to roughly $1.33 billion in fiscal 2025.
Hulu Overview 2026
Here are the headline Hulu numbers for 2026, covering subscribers, revenue, pricing, and reach in one place.
| Metric | Data |
|---|---|
| Total subscribers (final reported) | 64.1 million |
| Hulu SVOD subscribers | 59.7 million |
| Hulu live TV subscribers | 4.4 million |
| Last quarter with subscriber disclosure | Q4 fiscal 2025 (Sept 27, 2025) |
| Estimated annual revenue (2025) | $12.6 billion |
| Estimated ad revenue (2025) | $5.2 billion |
| SVOD average monthly revenue per subscriber | $12.20 |
| Live TV average monthly revenue per subscriber | $100.02 |
| US SVOD market share | 11% |
| Entry price | $11.99 per month |
Sources: Disney Q4 FY2025 Results, Business of Apps, Antenna, Similarweb, Ampere Analysis
Hulu sits in an unusual position among major streamers. It is a single-country service that still ranks among the ten largest paid platforms in the world, and it earns more per subscriber than most of them because of its live TV tier.
Hulu Users And Subscribers 2026
Hulu ended its reporting life with 64.1 million subscribers after the fastest growth quarter it ever recorded. The service spent most of the 2020s adding a million or two per quarter, then jumped 8.6 million in one.
How Many Paid Subscribers Does Hulu Have?
Hulu has 64.1 million subscribers as of its final disclosed quarter, which ended September 27, 2025. That breaks down into 59.7 million on the on-demand service and 4.4 million on the live TV package.
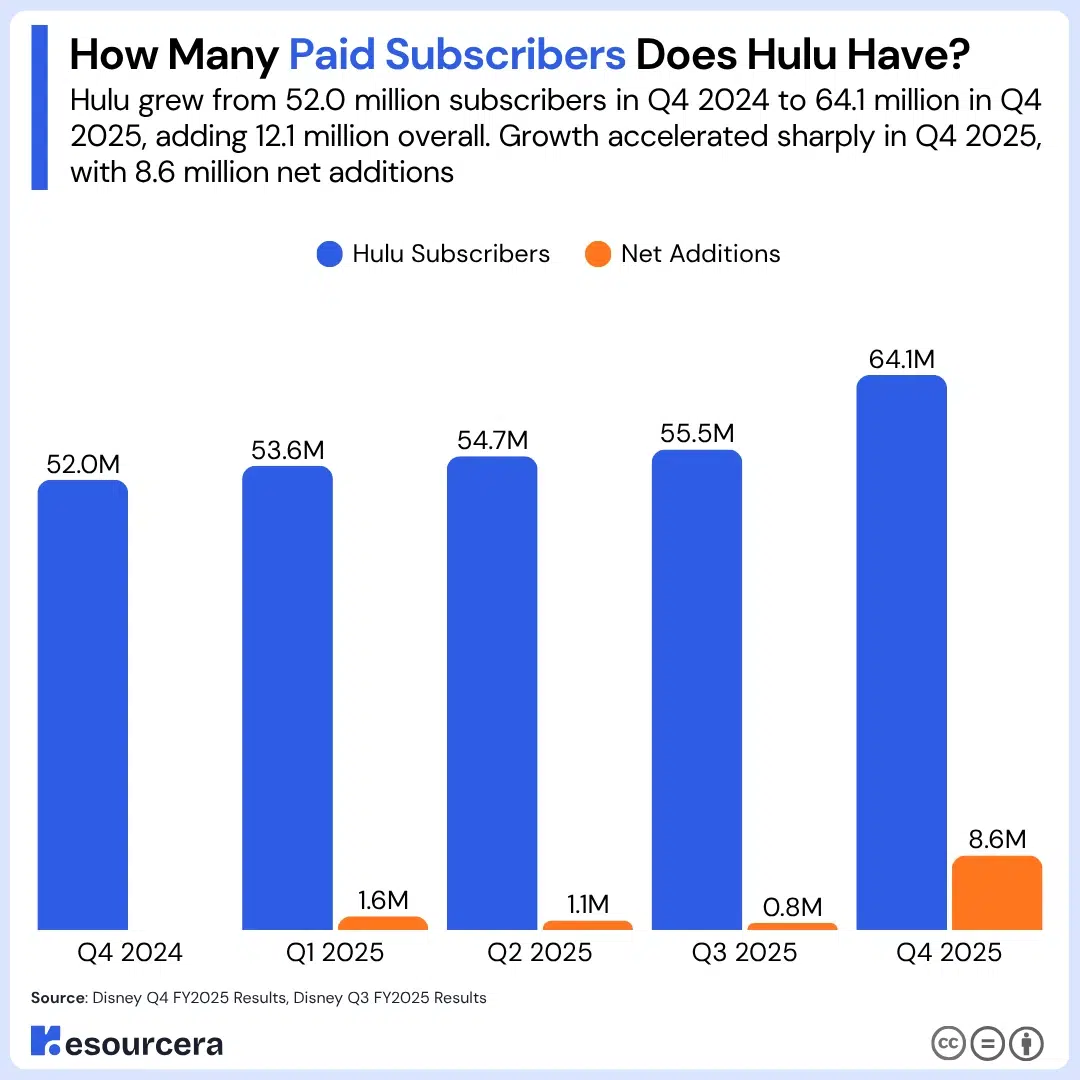
The jump that produced it was extraordinary by Hulu’s standards. Subscribers grew 15.5% in a single quarter, from 55.5 million to 64.1 million, driven by an expanded distribution deal with Charter that pushed Hulu into millions of existing pay TV households.
The table below shows how Hulu’s subscriber count moved through fiscal 2025.
| Quarter | Hulu Subscribers | Net Additions |
|---|---|---|
| Q4 2024 | 52.0 million | — |
| Q1 2025 | 53.6 million | +1.6 million |
| Q2 2025 | 54.7 million | +1.1 million |
| Q3 2025 | 55.5 million | +0.8 million |
| Q4 2025 | 64.1 million | +8.6 million |
Hulu’s first three quarters of fiscal 2025 produced 3.5 million net additions between them. The fourth quarter produced 8.6 million on its own, 2.46 times the combined total of the nine months before it.
That single quarter also flattered the annual figure. Hulu grew 23.27% across fiscal 2025, its strongest year since 2019, and almost all of that came in the final three months.
Hulu Subscribers Over The Years
Hulu has grown from 300,000 paying subscribers at the end of 2010 to 64.1 million in 2025, a compound annual growth rate of 42.99% across fifteen years. Growth was steep through the 2010s, flattened badly between 2022 and 2024, then spiked at the end.
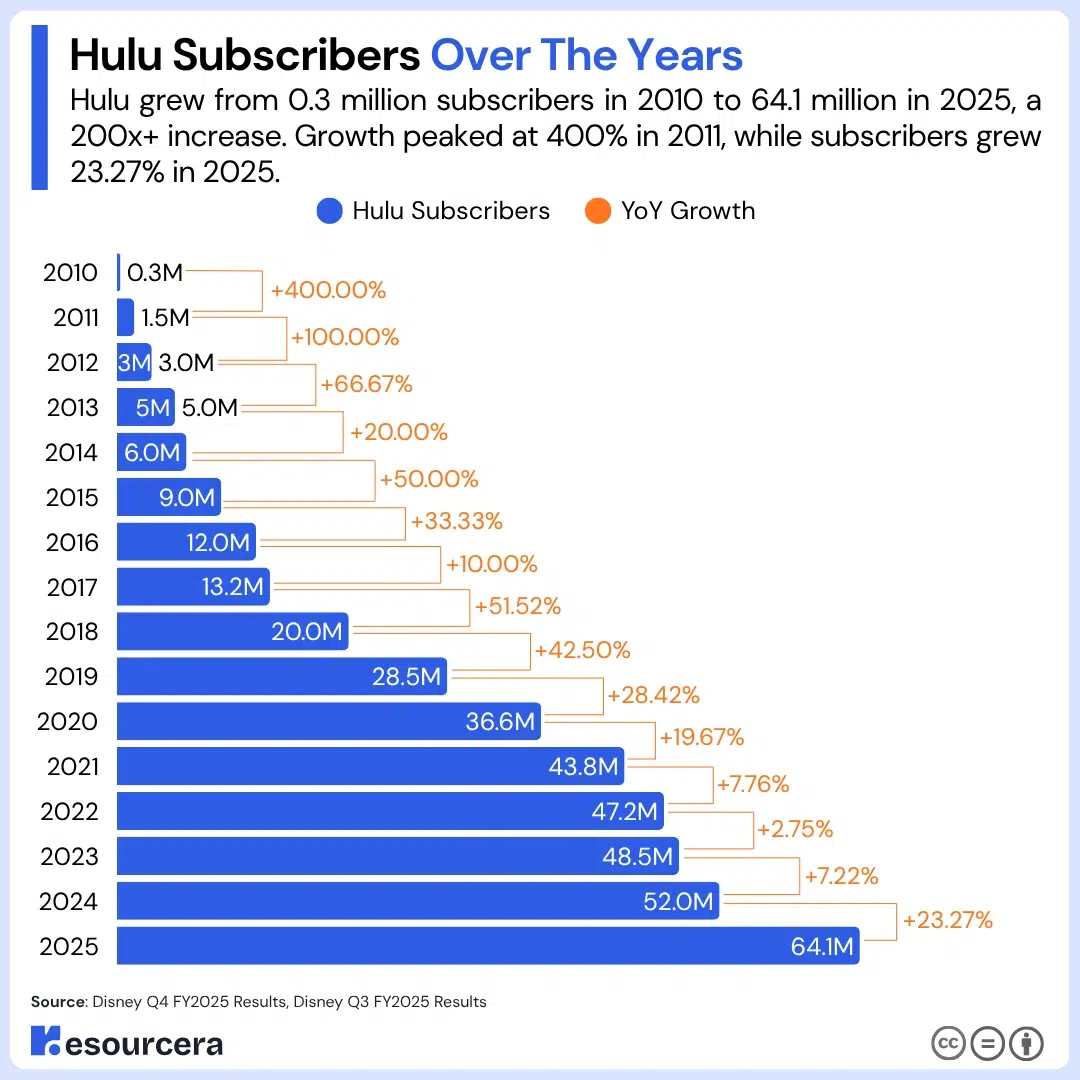
The table below tracks Hulu’s paid subscriber base year by year alongside the annual change.
| Year | Hulu Subscribers | YoY Growth |
|---|---|---|
| 2010 | 0.3 million | — |
| 2011 | 1.5 million | +400.00% |
| 2012 | 3.0 million | +100.00% |
| 2013 | 5.0 million | +66.67% |
| 2014 | 6.0 million | +20.00% |
| 2015 | 9.0 million | +50.00% |
| 2016 | 12.0 million | +33.33% |
| 2017 | 13.2 million | +10.00% |
| 2018 | 20.0 million | +51.52% |
| 2019 | 28.5 million | +42.50% |
| 2020 | 36.6 million | +28.42% |
| 2021 | 43.8 million | +19.67% |
| 2022 | 47.2 million | +7.76% |
| 2023 | 48.5 million | +2.75% |
| 2024 | 52.0 million | +7.22% |
| 2025 | 64.1 million | +23.27% |
The 2023 figure is the one worth pausing on. Hulu added 1.3 million subscribers that year, growth of 2.75%, its weakest ever.
Over the previous decade, it had never grown by less than 7%. That stall is the backdrop for everything Disney did next, from the Comcast buyout to the Fubo merger to the decision to stop reporting Hulu at all.
Measured from 2015 instead of 2010, Hulu’s compound annual growth rate is 21.69%. That is the more honest number for a mature service, since growth off a 300,000 base inflates the longer figure.
Hulu SVOD And Hulu Live TV Subscribers
Hulu SVOD accounts for 93.1% of all Hulu subscriptions. The live TV package has held between 4.3 million and 4.6 million subscribers for four straight years, which means every net subscriber Hulu has added since 2022 came from the on-demand side.
The table below shows the split by quarter from the end of 2022 through Hulu’s final reported quarter.
| Quarter | Hulu SVOD Only | Hulu Live TV + SVOD | Total | SVOD Share |
|---|---|---|---|---|
| Q4 2022 | 42.8 million | 4.4 million | 47.2 million | 90.7% |
| Q1 2023 | 43.5 million | 4.5 million | 48.0 million | 90.6% |
| Q2 2023 | 43.7 million | 4.5 million | 48.2 million | 90.7% |
| Q3 2023 | 44.0 million | 4.3 million | 48.3 million | 91.1% |
| Q4 2023 | 43.9 million | 4.6 million | 48.5 million | 90.5% |
| Q1 2024 | 45.1 million | 4.6 million | 49.7 million | 90.7% |
| Q2 2024 | 45.8 million | 4.4 million | 50.2 million | 91.2% |
| Q3 2024 | 46.7 million | 4.4 million | 51.1 million | 91.4% |
| Q4 2024 | 47.4 million | 4.6 million | 52.0 million | 91.2% |
| Q1 2025 | 49.0 million | 4.6 million | 53.6 million | 91.4% |
| Q2 2025 | 50.3 million | 4.4 million | 54.7 million | 92.0% |
| Q3 2025 | 51.2 million | 4.3 million | 55.5 million | 92.3% |
| Q4 2025 | 59.7 million | 4.4 million | 64.1 million | 93.1% |
Of the 8.6 million subscribers Hulu added in its final quarter, 8.5 million were on-demand only. Live TV moved by 100,000.
That flat line matters more than it looks. Live TV is where Hulu makes its money per head, and it has not grown in four years. The on-demand side grows; the profitable side does not.
Hulu Total Viewership
Hulu reaches an estimated 130.7 million viewers in the United States, roughly double its paid subscriber count. The gap is due to account sharing, household members, and wholesale distribution deals that entitle people to Hulu without them choosing it.
Among US streaming platforms, Hulu ranks third by total viewership, behind Netflix at 173.3 million and Amazon Prime Video at 163.6 million. For a service that operates in one country, sitting third on that list is a stronger showing than the subscriber rankings suggest.
Sources: Disney Q4 FY2025 Results, Disney Q3 FY2025 Results, Statista 1, eMarketer 1, Backlinko
Hulu User Demographics
Hulu’s audience skews young, slightly female, and toward lower and middle incomes. It also reaches further into rural America than any other major streaming service.
Hulu Users By Age
33.66% of Hulu users are aged 25 to 34, making millennials the platform’s largest age group by a wide margin. The average Hulu subscriber is 31 years old.
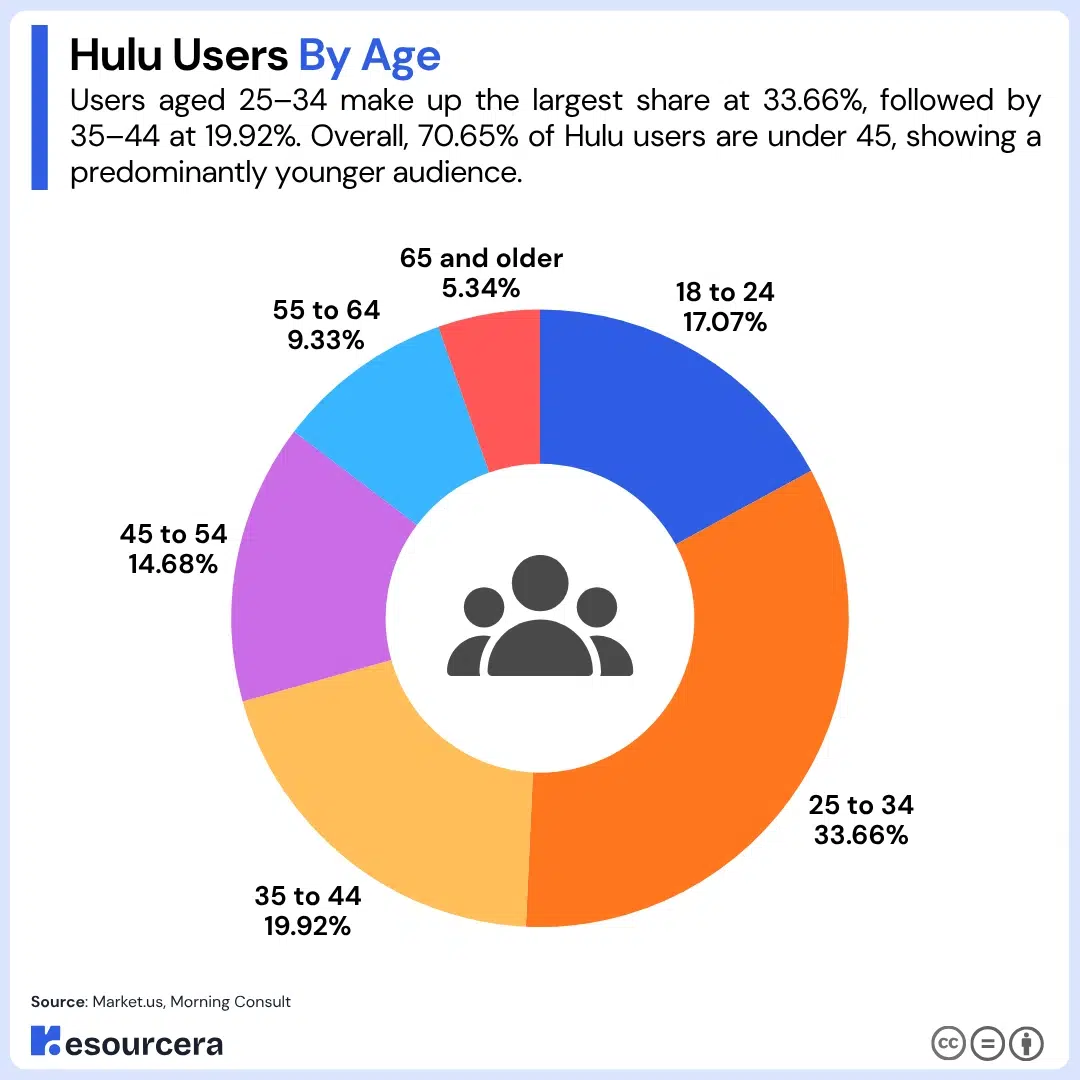
The table below shows Hulu’s user base by age bracket.
| Age Group | Share Of Hulu Users |
|---|---|
| 18 to 24 | 17.07% |
| 25 to 34 | 33.66% |
| 35 to 44 | 19.92% |
| 45 to 54 | 14.68% |
| 55 to 64 | 9.33% |
| 65 and older | 5.34% |
70.65% of Hulu’s audience is under 45, and just 14.67% is 55 or older. More than half of all Hulu subscribers are either millennials or Gen Z.
That age profile is the commercial argument for the platform. Hulu’s audience sits squarely in the demographic that has largely stopped watching linear television, which is precisely the audience advertisers cannot reach through cable.
Hulu Users By Gender
52% of Hulu subscribers are female, and 48% are male. Among major streaming services, only Netflix reports a comparably even split.
Web analytics show a slightly wider gap. Visitors to hulu.com are 54.84% female and 45.16% male, though that measures site visits rather than account holders and picks up browsing behavior the subscriber data does not.
Hulu Users By Income And Location
Half of Hulu subscribers earn under $50,000 a year, and only 19% earn more than $100,000. That income profile is closest to Netflix among major streamers, and well below Max or Apple TV+.
25% of Hulu subscribers live outside towns and cities, the largest rural share of any major streaming platform. The remaining 75% live in urban or suburban communities.
The rural figure is the one marketers tend to miss. Hulu is usually positioned as a young urban service, and it is, but it also reaches a quarter of its base in places where broadband options are thinner, and cable substitution matters more.
Sources: Market.us, Morning Consult, Similarweb
Hulu Revenue Statistics 2026
Hulu generated an estimated $12.6 billion in revenue in 2025, growth of 5% on the prior year.
Disney has never broken out Hulu revenue in its filings, so every figure in this section is a third-party estimate rather than a disclosed number.
Hulu Revenue Over The Years
Hulu revenue has grown from an estimated $200 million in 2010 to $12.6 billion in 2025, a compound annual growth rate of 31.81%. Growth has slowed sharply since 2021, running in single digits for three of the last four years.
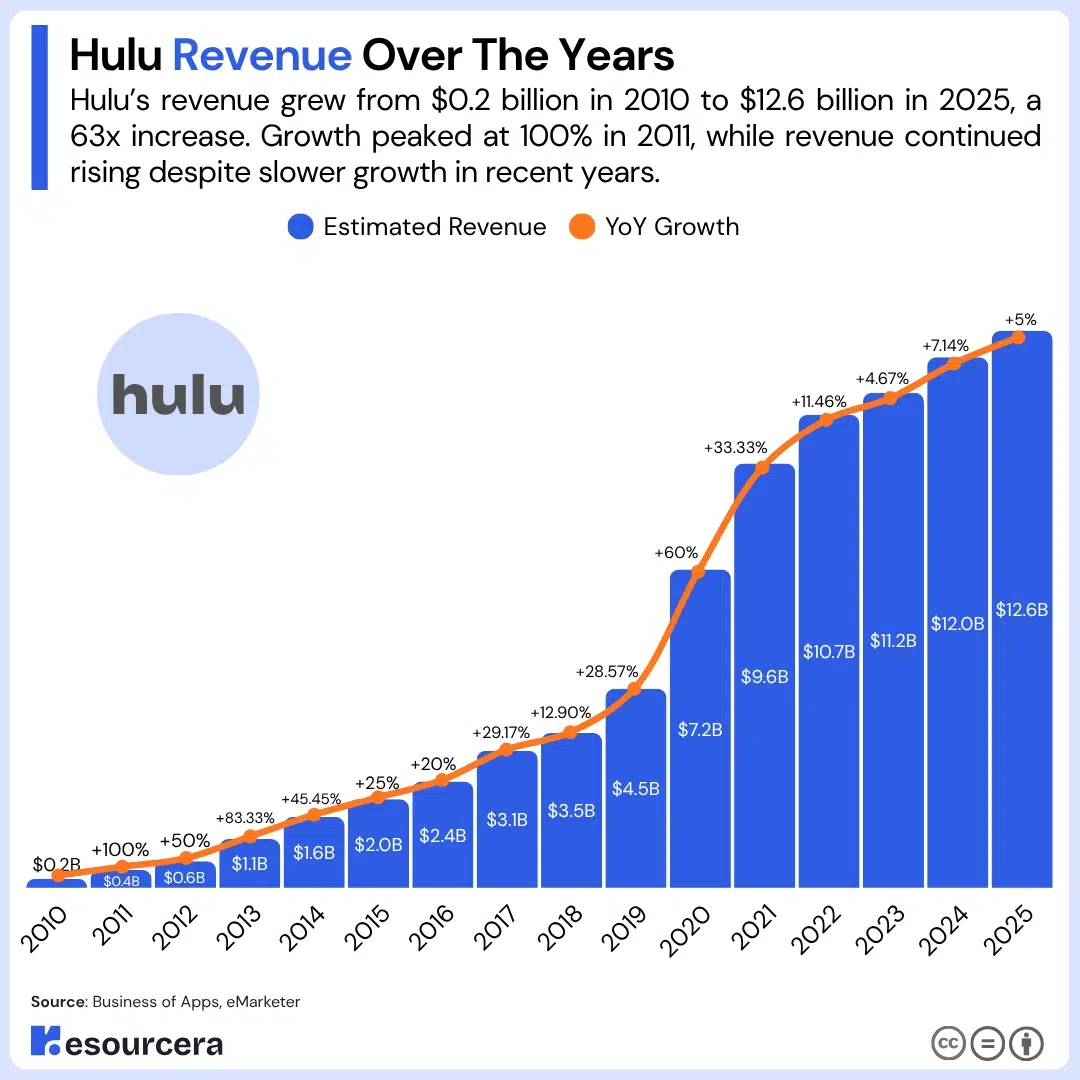
The table below tracks estimated Hulu revenue year by year with the annual change.
| Year | Estimated Revenue | YoY Growth |
|---|---|---|
| 2010 | $0.2 billion | — |
| 2011 | $0.4 billion | +100.00% |
| 2012 | $0.6 billion | +50.00% |
| 2013 | $1.1 billion | +83.33% |
| 2014 | $1.6 billion | +45.45% |
| 2015 | $2.0 billion | +25.00% |
| 2016 | $2.4 billion | +20.00% |
| 2017 | $3.1 billion | +29.17% |
| 2018 | $3.5 billion | +12.90% |
| 2019 | $4.5 billion | +28.57% |
| 2020 | $7.2 billion | +60.00% |
| 2021 | $9.6 billion | +33.33% |
| 2022 | $10.7 billion | +11.46% |
| 2023 | $11.2 billion | +4.67% |
| 2024 | $12.0 billion | +7.14% |
| 2025 | $12.6 billion | +5.00% |
Across 2025, Hulu generated roughly $196.57 of revenue per subscriber. Measured over the last six years, revenue has compounded at 18.72% a year while subscribers compounded at 14.5%, which means Hulu has been extracting more from each account, not just adding accounts.
Hulu Streaming Revenue And Live TV Revenue
Hulu’s on-demand service produced an estimated $7.1 billion in 2025, and live TV produced $5.1 billion. On-demand is the larger business, but live TV grew faster over the last five years, compounding at 12.74% versus 10.04%.
The table below splits Hulu’s estimated revenue between the two products.
| Year | Streaming Revenue | Live TV Revenue | Streaming Share |
|---|---|---|---|
| 2020 | $4.4 billion | $2.8 billion | 61.1% |
| 2021 | $5.8 billion | $3.7 billion | 61.1% |
| 2022 | $6.3 billion | $4.4 billion | 58.9% |
| 2023 | $6.3 billion | $4.8 billion | 56.8% |
| 2024 | $6.8 billion | $5.2 billion | 56.7% |
| 2025 | $7.1 billion | $5.1 billion | 58.2% |
The imbalance here is the whole story of Hulu’s economics. Live TV carried 4.4 million subscribers in 2025 and produced 41.8% of the revenue. On-demand carried 59.7 million and produced 58.2%. Roughly 7% of the subscriber base generated more than four dollars in every ten.
2025 was also the first year live TV revenue fell, dropping from $5.2 billion to $5.1 billion. That decline lines up with the Fubo transaction closing in October of that year.
Hulu Advertising Revenue
Hulu generated an estimated $5.2 billion in advertising revenue in 2025, which works out to 41.3% of its total revenue. Advertising has compounded at 21.45% per year since 2019, faster than the business as a whole.
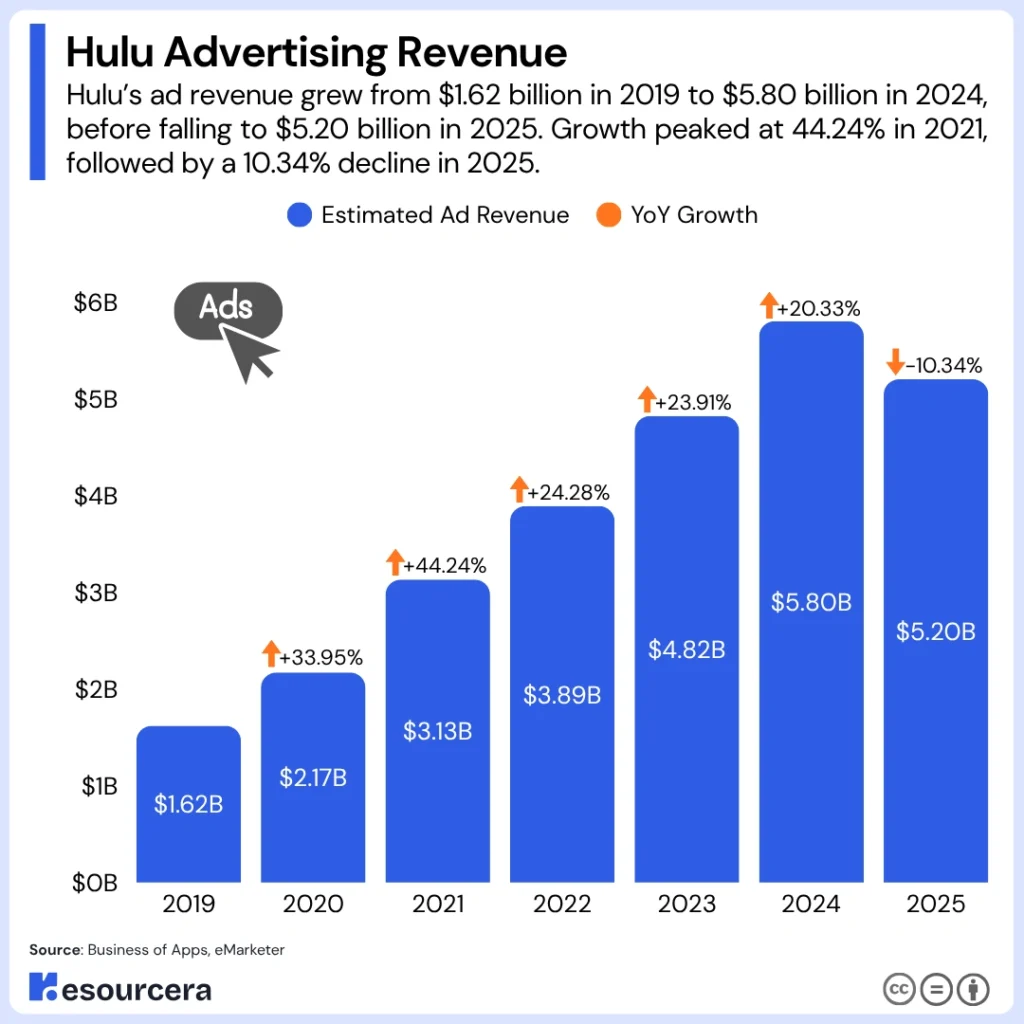
The table below shows estimated Hulu connected TV advertising revenue by year.
| Year | Estimated Ad Revenue | YoY Growth |
|---|---|---|
| 2019 | $1.62 billion | — |
| 2020 | $2.17 billion | +33.95% |
| 2021 | $3.13 billion | +44.24% |
| 2022 | $3.89 billion | +24.28% |
| 2023 | $4.82 billion | +23.91% |
| 2024 | $5.80 billion | +20.33% |
| 2025 | $5.20 billion | -10.34% |
2025 broke a six-year run of growth, with ad revenue falling 10.34% after peaking at $5.8 billion. The pressure has continued into 2026. Disney’s combined streaming advertising revenue grew just 2.53% in the June 2026 quarter, and the composition explains why.
Impressions rose 8% while rates fell 4%, which is what an oversupplied connected TV ad market looks like from the seller’s side.
Advertising now makes up 15.38% of Disney’s Entertainment SVOD revenue, against 84.62% from subscriptions. For a platform where nearly four in five subscribers watch ads, that ratio suggests the ad business is still underweight relative to the audience it has.
Sources: Business of Apps, eMarketer 2, Disney Q3 FY2026 Results
Hulu ARPU And Streaming Profitability
Hulu’s final reported average revenue per subscriber was $12.20 a month for on-demand and $100.02 for live TV. The gap between those two figures is the single most important number in Hulu’s business.
Hulu Average Revenue Per Subscriber
Hulu SVOD ARPU was $12.20 in its final reported quarter, down 2% from the quarter before because of subscriber mix shifts. Live TV ARPU was $100.02, having crossed $100 for the first time one quarter earlier.
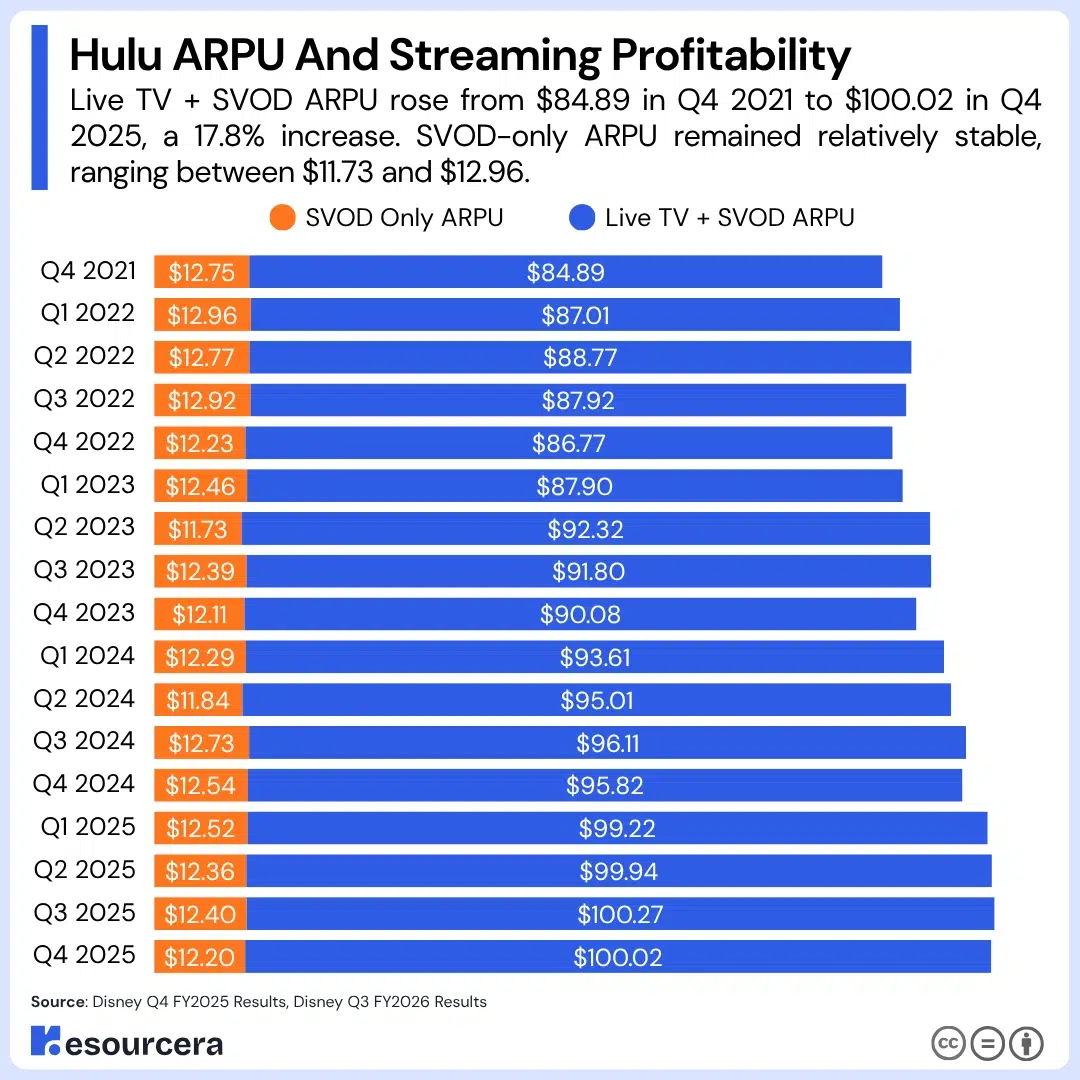
The table below tracks both figures across sixteen quarters.
| Quarter | SVOD Only ARPU | Live TV + SVOD ARPU |
|---|---|---|
| Q4 2021 | $12.75 | $84.89 |
| Q1 2022 | $12.96 | $87.01 |
| Q2 2022 | $12.77 | $88.77 |
| Q3 2022 | $12.92 | $87.92 |
| Q4 2022 | $12.23 | $86.77 |
| Q1 2023 | $12.46 | $87.90 |
| Q2 2023 | $11.73 | $92.32 |
| Q3 2023 | $12.39 | $91.80 |
| Q4 2023 | $12.11 | $90.08 |
| Q1 2024 | $12.29 | $93.61 |
| Q2 2024 | $11.84 | $95.01 |
| Q3 2024 | $12.73 | $96.11 |
| Q4 2024 | $12.54 | $95.82 |
| Q1 2025 | $12.52 | $99.22 |
| Q2 2025 | $12.36 | $99.94 |
| Q3 2025 | $12.40 | $100.27 |
| Q4 2025 | $12.20 | $100.02 |
Over those four years, Hulu’s on-demand ARPU fell 4.31% while live TV ARPU rose 17.82%.
Repeated price increases on the on-demand tier produced no net gain in revenue per head, because each increase pushed more subscribers toward the cheaper ad-supported plan and toward bundles that split revenue across three services.
Hulu Live TV Subscribers Are Worth Eight Times More
A Hulu Live TV subscriber generates 8.2 times the monthly revenue of an on-demand subscriber. Annualized, that is $1,200.24 against $146.40, a difference of $1,053.84 per subscriber per year.
The practical effect is that Hulu’s 4.4 million live TV subscribers were worth roughly $5.3 billion a year while its 59.7 million on-demand subscribers were worth roughly $8.7 billion. One live TV account carried the same annual revenue as eight on-demand accounts.
This is also why the live TV business ended up inside a joint venture rather than inside Disney+. It is a cable business wearing streaming clothes, with cable margins and cable costs, and it does not fit the model Disney is building around Disney+.
Disney’s Streaming Operating Income And Margin
Disney’s entertainment streaming business earned roughly $1.33 billion in operating income in fiscal 2025, against $143 million the year before. That is a 9.28-fold increase in twelve months, the steepest one-year profitability swing among major US streamers in recent memory.
Momentum carried into 2026. Streaming operating income more than doubled again in the June 2026 quarter, rising 116.4% to $712 million, at a 12.9% operating margin.
The table below shows how quickly that margin has moved.
| Period | Streaming Revenue | Operating Income | Operating Margin |
|---|---|---|---|
| Q3 fiscal 2025 | $4.97 billion | $329 million | 6.62% |
| Q4 fiscal 2025 | $6.25 billion | $352 million | 5.63% |
| Q3 fiscal 2026 | $5.53 billion | $712 million | 12.87% |
Disney has guided to a double-digit operating margin for full-year fiscal 2026, and the June quarter cleared that bar. The company noted the result benefited from favorable timing on marketing and programming spend, so 12.87% is a high-water mark rather than a run rate.
Note that Q4 fiscal 2025 covers a wider direct-to-consumer segment including live TV, which is why its margin reads lower. The two quarters labeled fiscal 2026 and Q3 fiscal 2025 are on the narrower SVOD basis.
Sources: Disney Q4 FY2025 Results, Disney Q3 FY2026 Results, Statista 2
Hulu Market Share 2026
Hulu holds 11% of the US subscription streaming market and ranks ninth worldwide by subscriber count. Both figures have moved in the same direction for six years, and not the direction Hulu would want.
Hulu’s Share Of The US SVOD Market
Hulu holds 11% of US SVOD subscriptions, down from a peak of 27% in the third quarter of 2019. That is a loss of 16 percentage points, or a 59.3% relative decline, across six years.
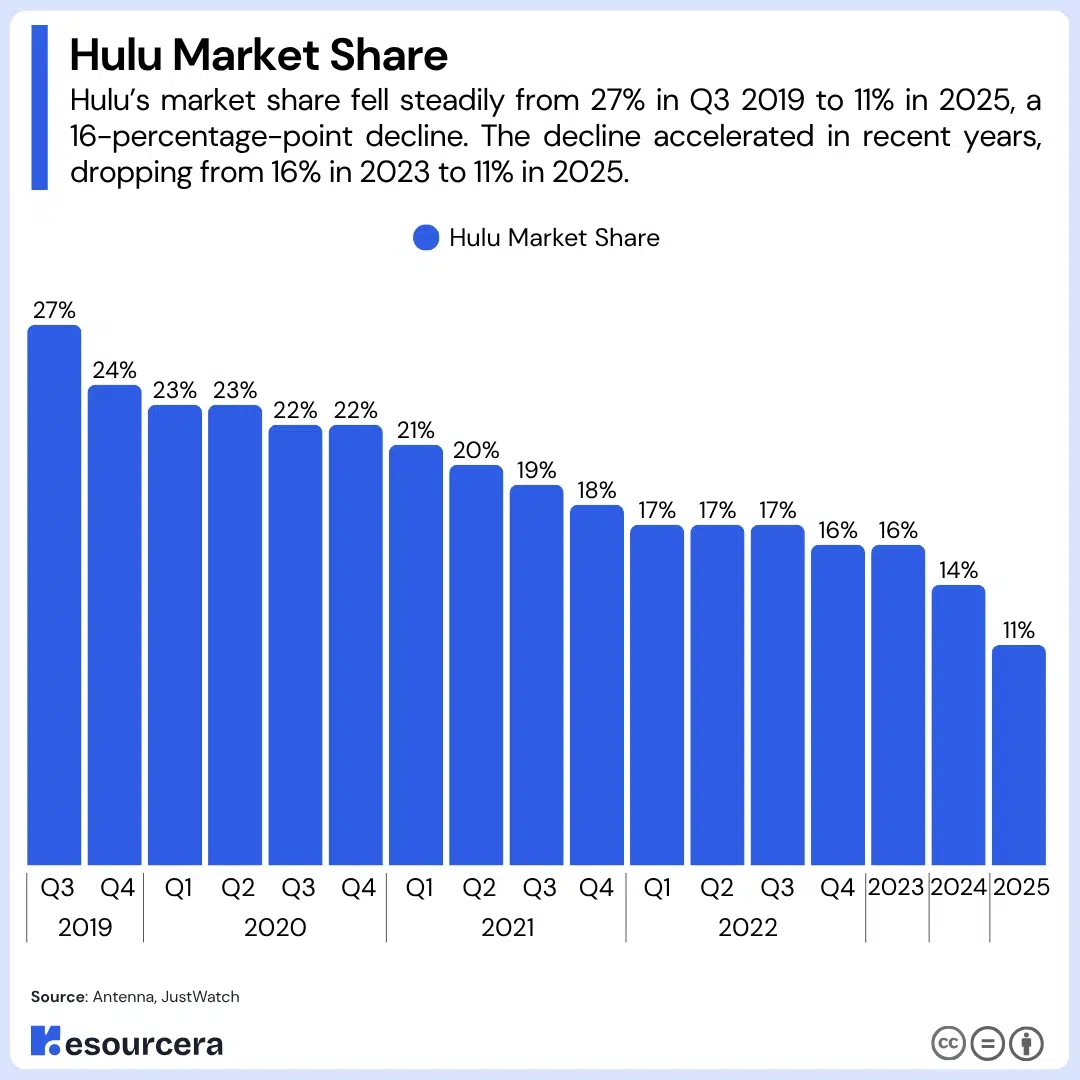
The table below tracks Hulu’s share of US subscription video on demand.
| Period | Hulu Market Share |
|---|---|
| Q3 2019 | 27% |
| Q4 2019 | 24% |
| Q1 2020 | 23% |
| Q2 2020 | 23% |
| Q3 2020 | 22% |
| Q4 2020 | 22% |
| Q1 2021 | 21% |
| Q2 2021 | 20% |
| Q3 2021 | 19% |
| Q4 2021 | 18% |
| Q1 2022 | 17% |
| Q2 2022 | 17% |
| Q3 2022 | 17% |
| Q4 2022 | 16% |
| 2023 | 16% |
| 2024 | 14% |
| 2025 | 11% |
Hulu did not shrink. It grew from 28.5 million subscribers in 2019 to 64.1 million in 2025 while its market share more than halved.
What happened is that Disney+, HBO Max, Paramount+, Peacock, and Apple TV+ all either launched or scaled in the same window, and the market grew faster than Hulu did.
The steepest single-year drop came in 2025, when share fell three points from 14% to 11%. That happened in a year Hulu added 12.1 million subscribers, which shows how quickly the denominator is still moving.
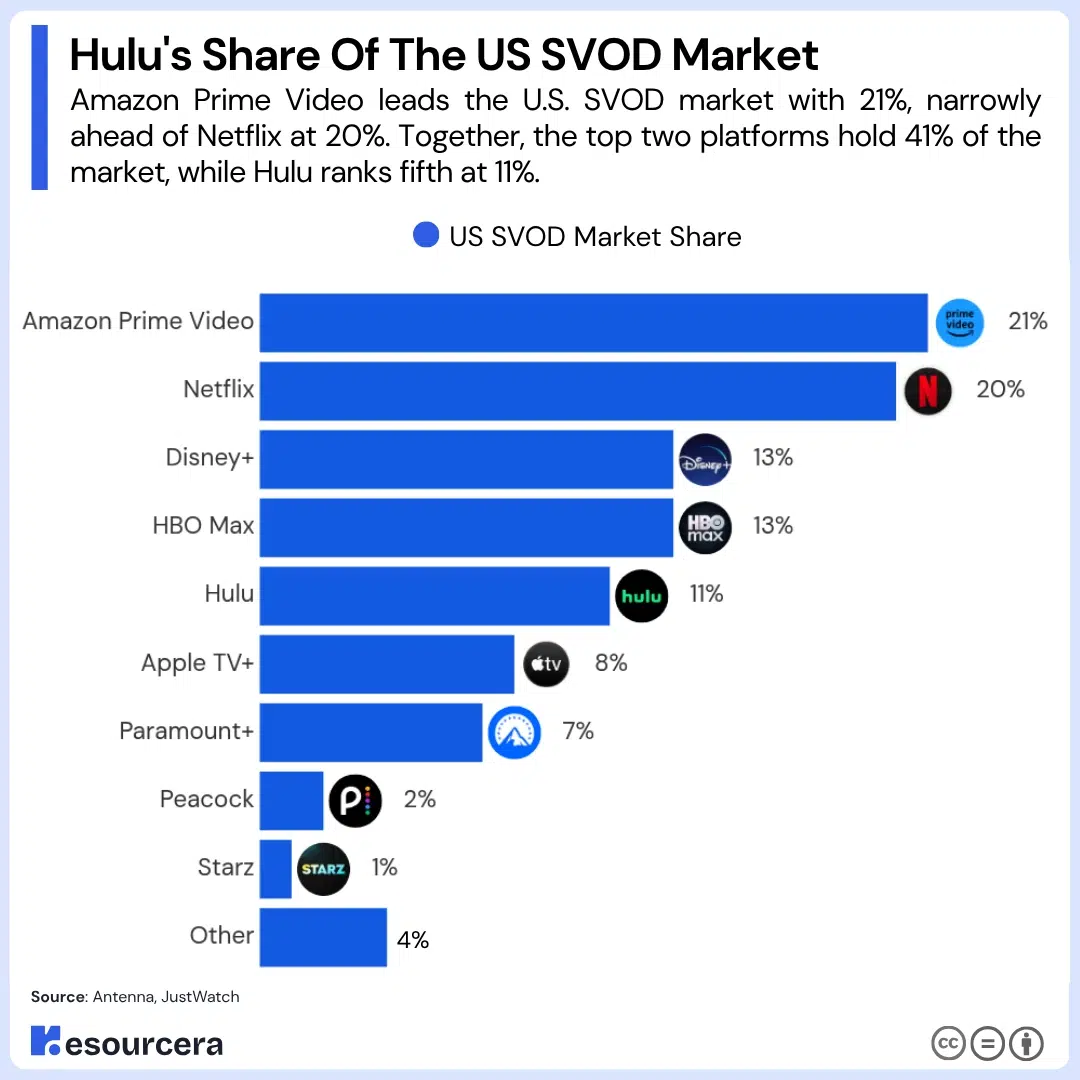
Against the wider field, Hulu now sits fifth in the US behind Amazon Prime Video, Netflix, Disney+, and HBO Max.
| Platform | US SVOD Market Share |
|---|---|
| Amazon Prime Video | 21% |
| Netflix | 20% |
| Disney+ | 13% |
| HBO Max | 13% |
| Hulu | 11% |
| Apple TV+ | 8% |
| Paramount+ | 7% |
| Peacock | 2% |
| Starz | 1% |
| Other | 4% |
Disney’s own services now hold 24% between Disney+ and Hulu, more than any single competitor. That combined position is one of the arguments for merging them into a single app.
Hulu Against Other Streaming Platforms By Subscribers
Hulu ranks ninth among global streaming platforms with 64.1 million subscribers. Every platform above it operates in multiple countries, and most operate in dozens.
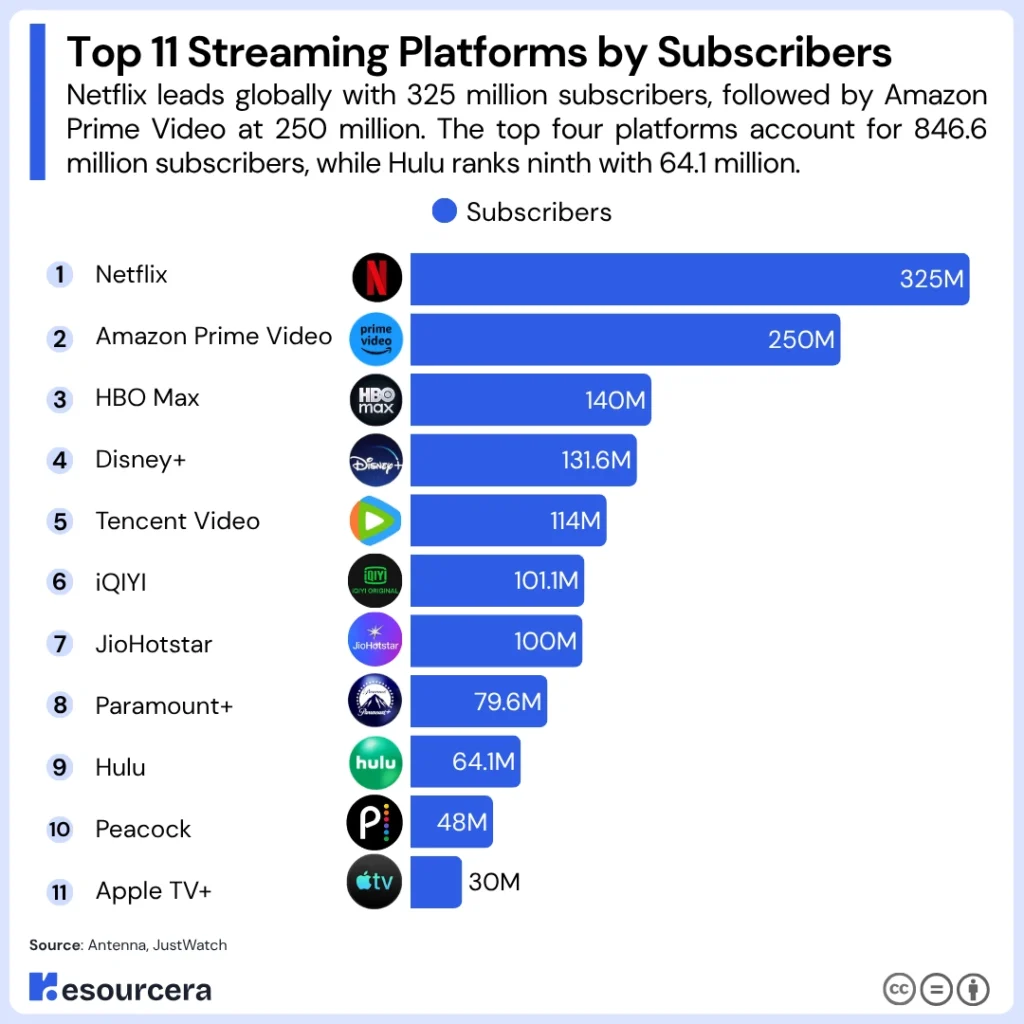
The table below ranks the leading subscription streaming services by subscriber count.
| Rank | Platform | Subscribers |
|---|---|---|
| 1 | Netflix | 325 million |
| 2 | Amazon Prime Video | 250 million |
| 3 | HBO Max | 140 million |
| 4 | Disney+ | 131.6 million |
| 5 | Tencent Video | 114 million |
| 6 | iQIYI | 101.1 million |
| 7 | JioHotstar | 100 million |
| 8 | Paramount+ | 79.6 million |
| 9 | Hulu | 64.1 million |
| 10 | Peacock | 48 million |
| 11 | Apple TV+ | 30 million |
Hulu and Peacock are the only two platforms on this list confined to a single market. Read against that constraint, ninth place from one country of roughly 130 million television households is a stronger result than the ranking implies.
Hulu also accounts for 32.7% of Disney’s 196 million combined streaming subscriptions, with Disney+ making up the other 67.14%. Roughly one in three Disney streaming subscriptions is a Hulu subscription.
Source: OTT Subscribers
Hulu’s Share Of US TV Viewing Time
Hulu no longer has a standalone television viewing share. Nielsen now folds Disney+, Hulu, and ESPN+ into a single Disney Streaming bucket, which represented 4.7% of total US TV viewing in December 2025.
The measurement change mirrors Disney’s own. Two of the three organizations that tracked Hulu separately stopped doing so within months of each other.
What can still be measured is the category Hulu competes in, and it keeps expanding. Streaming reached 48.6% of all US television watch time in May 2026, a record, while cable and broadcast fell to 20.4% and 19.2%.
The table below shows how Americans watched television in May 2026.
| Viewing Type | Share Of US TV Watch Time |
|---|---|
| Streaming | 48.6% |
| Cable | 20.4% |
| Broadcast | 19.2% |
| Other | 11.8% |
Streaming is now 9 percentage points ahead of cable and broadcast combined. Among individual platforms, YouTube leads with 13.8% and Netflix follows at 8.0%. Measured as a whole company rather than by platform, Disney holds the second largest share of American television at 10.0%.
Sources: Antenna 1, JustWatch, FlixPatrol, Nielsen
Hulu Plans And Pricing 2026
Hulu costs $11.99 a month with ads and $18.99 without. The ad-supported plan has risen 50.06% since 2015, while the ad-free plan has risen 58.38%, and Hulu is now more expensive to enter than Netflix or Paramount+.
Hulu Plans And Bundle Prices
Hulu sells two on-demand tiers, one live TV package, and a set of bundles that fold in Disney+, ESPN, and HBO Max. The bundles are where most of Hulu’s pricing complexity sits.
The table below lists every Hulu plan and bundle available in 2026.
| Plan | Monthly Price |
|---|---|
| Hulu (With Ads) | $11.99 |
| Hulu (No Ads) | $18.99 |
| Hulu + Live TV | $89.99 |
| Disney+, Hulu Bundle (With Ads) | $12.99 |
| Disney+, Hulu Bundle Premium | $19.99 |
| Disney+, Hulu, ESPN Select Bundle | $21.99 |
| Disney+, Hulu, HBO Max Bundle | $19.99 |
| Disney+, Hulu, HBO Max Bundle Premium | $32.99 |
| Disney+, Hulu, ESPN Unlimited Bundle | $35.99 |
| Disney+, Hulu, ESPN Unlimited Premium | $44.99 |
The Disney+ and Hulu bundle at $12.99 costs one dollar more than standalone Hulu with ads. Disney is effectively giving away Disney+ access to anyone willing to take the bundle, which tells you how much it values getting Hulu subscribers into the Disney+ ecosystem before the two apps merge.
Hulu also sells an annual ad-supported plan at $119.99, which works out to roughly $10 a month, and a verified student rate of $1.99.
Ad-Supported And Ad-Free Subscribers
78% of Hulu subscribers are on the ad-supported plan, leaving 22% ad-free. That makes Hulu one of the most ad-heavy major streaming services in the United States, second only to Peacock.
The shift has been fast. In early 2024, 62% of Hulu’s new sign-ups chose ads. Two years later, 78% of the entire base is on that tier, which means the ad-free plan is losing subscribers to the cheaper option faster than it is gaining new ones.
That split explains the ARPU picture from the previous section. Hulu raised its ad-free price by seven dollars between 2021 and 2026, and its revenue per on-demand subscriber still fell, because subscribers responded to every increase by moving down a tier.
Sources: Hulu Help Center, Disney+, Antenna 2, TechCrunch
Hulu Engagement And Content Library
Hulu users watch 53 minutes a day, and the platform holds 7,250 titles. Both figures place it firmly in the second tier behind Netflix, but its retention numbers are stronger than its scale suggests.
Time Spent On Hulu
Hulu users spend an average of 53 minutes per day on the platform. That puts Hulu second among US streaming services on daily watch time, behind Netflix at roughly 1 hour and 3 minutes.
Ten minutes a day may sound like a small gap. Across a year, it is more than 60 hours per user, which is the difference between a service people default to and one they visit for specific shows.
Hulu Subscriber Retention
65% of Hulu’s ad-free subscribers are still on the platform after six months, against 63% of ad-supported subscribers. The two-point gap is unusually narrow.
Most streaming services see much wider retention gaps between paid tiers, because ad-supported subscribers tend to be more price-sensitive and churn faster.
Hulu’s near-parity suggests its ad tier is holding subscribers for content reasons rather than price reasons, which matters a great deal for a platform where 78% of the base watches ads.
Hulu’s Content Library
Hulu’s library holds 7,250 titles, counting distinct movies and television seasons. The platform also carries 16 of the 100 most popular titles in the United States.
That second number is the more useful one. A library can be padded with volume, but holding 16% of the country’s most-watched titles from a single-market service is a genuine content position, and it is the main asset Disney is moving into Disney+.
Sources: eMarketer 1, Second Measure, Ampere Analysis
Hulu Website Traffic Statistics
Hulu.com received 143.1 million visits in May 2026 and ranks fourth among US streaming and online TV websites. Visitors stay longer on Hulu than on most streaming sites, at 11 minutes and 25 seconds per session.
Hulu.com Monthly Visits And Engagement
Hulu.com drew 143.1 million visits in May 2026, up 4.36% from the previous month. Its global rank improved from 320 to 314 across the preceding three months.
The table below summarizes Hulu’s web performance.
| Metric | Value |
|---|---|
| Monthly visits | 143.1 million |
| Month-over-month change | +4.36% |
| Global rank | #314 |
| US country rank | #83 |
| Category rank (Streaming & Online TV, US) | #4 |
| Bounce rate | 36.38% |
| Pages per visit | 3.71 |
| Average visit duration | 11 minutes 25 seconds |
| Total organic keywords | 227,700 |
A 36.38% bounce rate paired with 3.71 pages per visit is a strong combination for any site. Visitors spend roughly three minutes per page, which is consistent with people browsing a catalog rather than landing and leaving.
Hulu’s 143.1 million monthly visits work out to about 2.23 visits per subscriber per month, and roughly 1.72 billion visits annualized.
A second measurement puts the figure lower. Semrush recorded 107.57 million monthly visits in July 2026 with a US rank of #90. The gap reflects different panel methodologies rather than a change in traffic, and both tools agree on the direction.
Where Hulu’s Traffic Comes From
99.31% of Hulu’s web traffic comes from the United States, leaving 0.69% for the rest of the world combined. That is close to the theoretical maximum for a geographically restricted service.
The table below shows Hulu’s top traffic sources by country.
| Country | Share Of Traffic |
|---|---|
| United States | 99.31% |
| Canada | 0.09% |
| United Kingdom | 0.07% |
| Iraq | 0.06% |
| India | 0.04% |
| All others | 0.43% |
By channel, 77.21% of Hulu’s desktop visits arrive directly, with organic search second and organic social third. Of the traffic that does come from search, 92.16% is organic and 7.84% is paid.
A 77.21% direct share is what brand maturity looks like. People type hulu.com rather than searching for it, and Hulu’s top organic keywords are almost entirely navigational, led by “hulu,” “hulu login,” and “hulu sign in.”
Sources: Similarweb, Semrush
Final Thoughts
Hulu ended its public life at 64.1 million subscribers, an estimated $12.6 billion in revenue, and 11% of the US streaming market. It grew larger every single year of its existence and lost more than half its market share in the process.
Hulu’s on-demand business grew 8.5 million subscribers in a quarter while earning less per head than it did in 2021. Its live TV business earned eight times as much per subscriber and did not grow at all for four years.
Advertising revenue fell for the first time in 2025 and has barely grown since. None of those are the numbers of a service with an independent future.
Expect Hulu to keep growing as a brand and disappear as a number. Disney’s combined Disney+ and Hulu base was 196 million at the last count, and streaming operating income is running above a 12% margin, so the merged entity has momentum.
What ends in 2026 is the ability to say how much of that belongs to Hulu.
For anyone tracking this, the metric to follow now is Disney’s Entertainment SVOD line. It is the only place Hulu still appears.