


Netflix remains the world’s largest streaming platform, with 325 million paid subscribers spread across 190 countries in 2026. Its ad-supported plan alone now has over 250 million monthly active viewers worldwide.
But the growth story is not as straightforward as the numbers suggest. Netflix spent most of the last decade adding subscribers year after year without interruption. Then in 2022, it lost subscribers for the first time ever, and its stock dropped 35% in a single day.
Today, it is bigger than ever, but the streaming market it operates in is far more competitive than it used to be.
This article breaks down the key Netflix numbers for 2026, from subscriber growth and regional trends to ad-tier performance, watch time, and how it compares against every major competitor.
Netflix Subscribers Statistics 2026: Key Highlights
- Netflix has 325 million paid subscribers globally as of 2026.
- Netflix’s ad-supported tier now reaches over 250 million monthly active viewers.
- The United States has approximately 87.75 million paid subscribers.
- EMEA became Netflix’s largest region with 101.3 million subscribers.
- APAC subscriber growth surged 442% between 2018 and 2024.
- Netflix’s Standard plan with Ads now drives 60% of new sign-ups.
- On average, Netflix users spend 1 to 2 hours per day streaming on the platform.
Netflix Overview 2026
Here are the key Netflix numbers for 2026: subscribers, revenue, ad users, and market reach, all in one place.
| Metric | Data |
|---|---|
| Global Paid Subscribers 2026 | 325 million |
| Ad-Tier Monthly Active Viewers | 250 million+ (May 2026) |
| Largest Region by Subscribers | EMEA – 101.3 million |
| Top Single Market | United States – 87.75 million |
| Countries Available | 190+ |
| US TV Viewing Share | 9% (Nielsen, December 2025) |
| Content Spend (2025) | $18 billion |
| Content Spend (2026 projected) | $20 billion |
| Full-Time Employees (2025) | 16,000 |
Sources: Netflix 1, Nielsen, FlixPatrol, Statista 1
Netflix reached its biggest scale yet in 2026. It holds 9% of all US TV viewing time, earned $45 billion in 2025, and now reaches over 250 million people through its ad-supported tier alone.
EMEA has overtaken the US as Netflix’s largest region. Content spend is rising toward $20 billion in 2026, while the ad plan now drives most new sign-ups in supported markets.
Number of Netflix Subscribers Worldwide in 2026
Netflix crossed 325 million paid subscribers globally in Q4 2025, reaching a record high.
With over 70% of subscribers coming from outside the US and the password-sharing crackdown still driving conversions, Netflix’s growth remains strong.
Netflix grew without interruption from 2013 to 2021. It started that period with 41 million subscribers and ended it with 221.84 million. The pandemic year of 2020 accelerated the growth, with Netflix adding over 36 million subscribers in twelve months as people stayed home and streamed more.
But the first quarter of 2022 broke the streak. Netflix reported a loss of 200,000 subscribers over those three months. The following day, its stock fell by more than 35%, the single largest one-day drop in the company’s history.
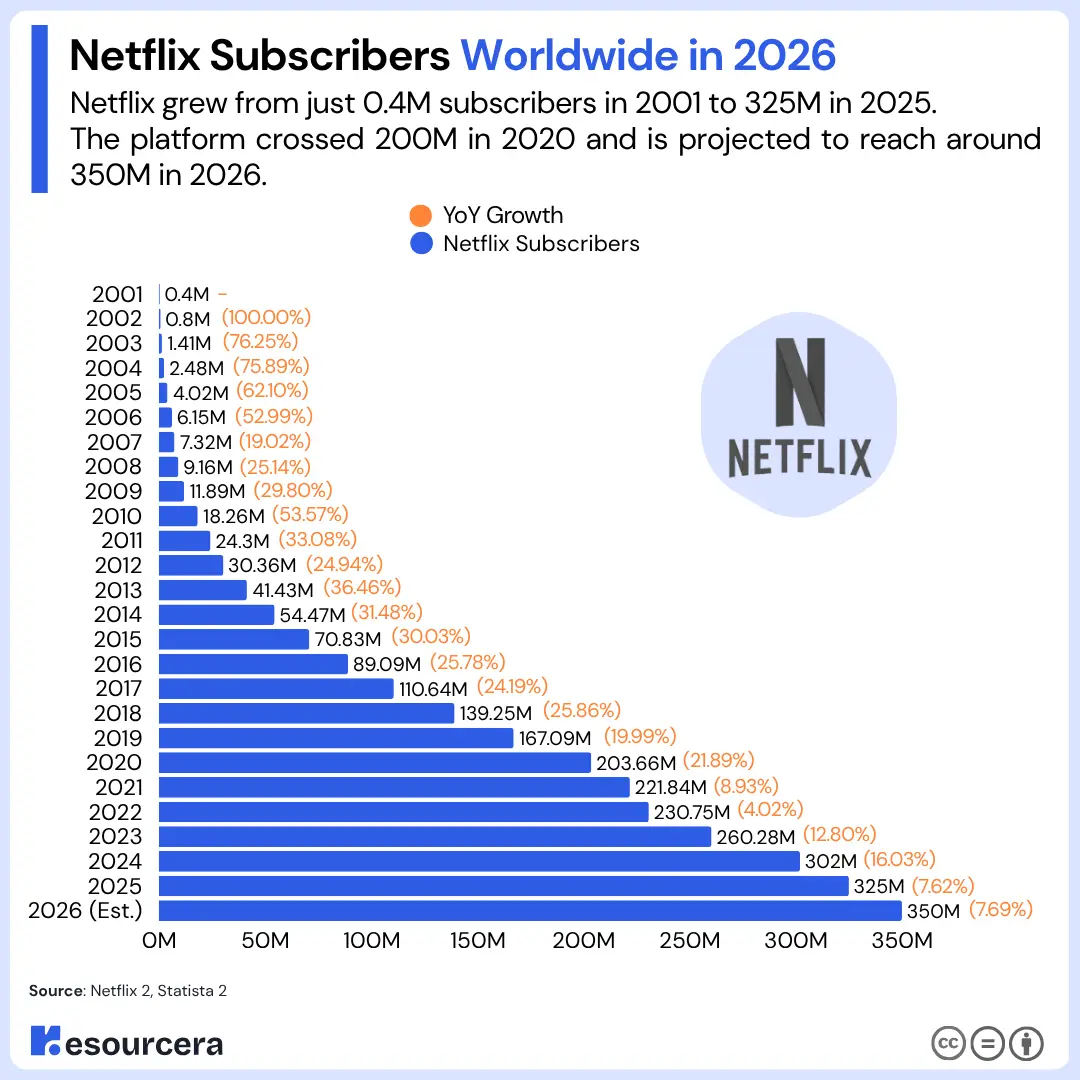
The table below tracks Netflix’s paid subscriber count every year from 2001 to 2026:
| Year | Netflix Subscribers | YoY Growth |
|---|---|---|
| 2001 | 0.4 million | — |
| 2002 | 0.8 million | 100.00% |
| 2003 | 1.41 million | 76.25% |
| 2004 | 2.48 million | 75.89% |
| 2005 | 4.02 million | 62.10% |
| 2006 | 6.15 million | 52.99% |
| 2007 | 7.32 million | 19.02% |
| 2008 | 9.16 million | 25.14% |
| 2009 | 11.89 million | 29.80% |
| 2010 | 18.26 million | 53.57% |
| 2011 | 24.30 million | 33.08% |
| 2012 | 30.36 million | 24.94% |
| 2013 | 41.43 million | 36.46% |
| 2014 | 54.47 million | 31.48% |
| 2015 | 70.83 million | 30.03% |
| 2016 | 89.09 million | 25.78% |
| 2017 | 110.64 million | 24.19% |
| 2018 | 139.25 million | 25.86% |
| 2019 | 167.09 million | 19.99% |
| 2020 | 203.66 million | 21.89% |
| 2021 | 221.84 million | 8.93% |
| 2022 | 230.75 million | 4.02% |
| 2023 | 260.28 million | 12.80% |
| 2024 | 302 million | 16.03% |
| 2025 | 325 million | 7.62% |
| 2026 (Estimated) | 350 million | 7.69% |
Sources: Netflix 2, Statista 1
Moreover, approximately 41% of all people who actively watch Netflix are not paying for it themselves. About 14% use the account of a friend or family member outside their household.
Another 27% watch through a paid subscription within their household, meaning they consume the service but contribute no direct revenue.
This means that for every ten people watching Netflix at any given moment, only around six are accountable to a paying account. The other four are effectively invisible to the revenue model.
Netflix began cracking down on password sharing in 2023, and that effort contributed to the subscriber gains seen that year as account borrowers converted into paying customers. But the 27% who share within a household are harder to target.
Netflix Subscribers by Region
Netflix operates across four regions: UCAN, EMEA, LATAM, and APAC. The table below shows how its 302 million paid subscribers broke down by region as of 2024, the most recent full-year data available.
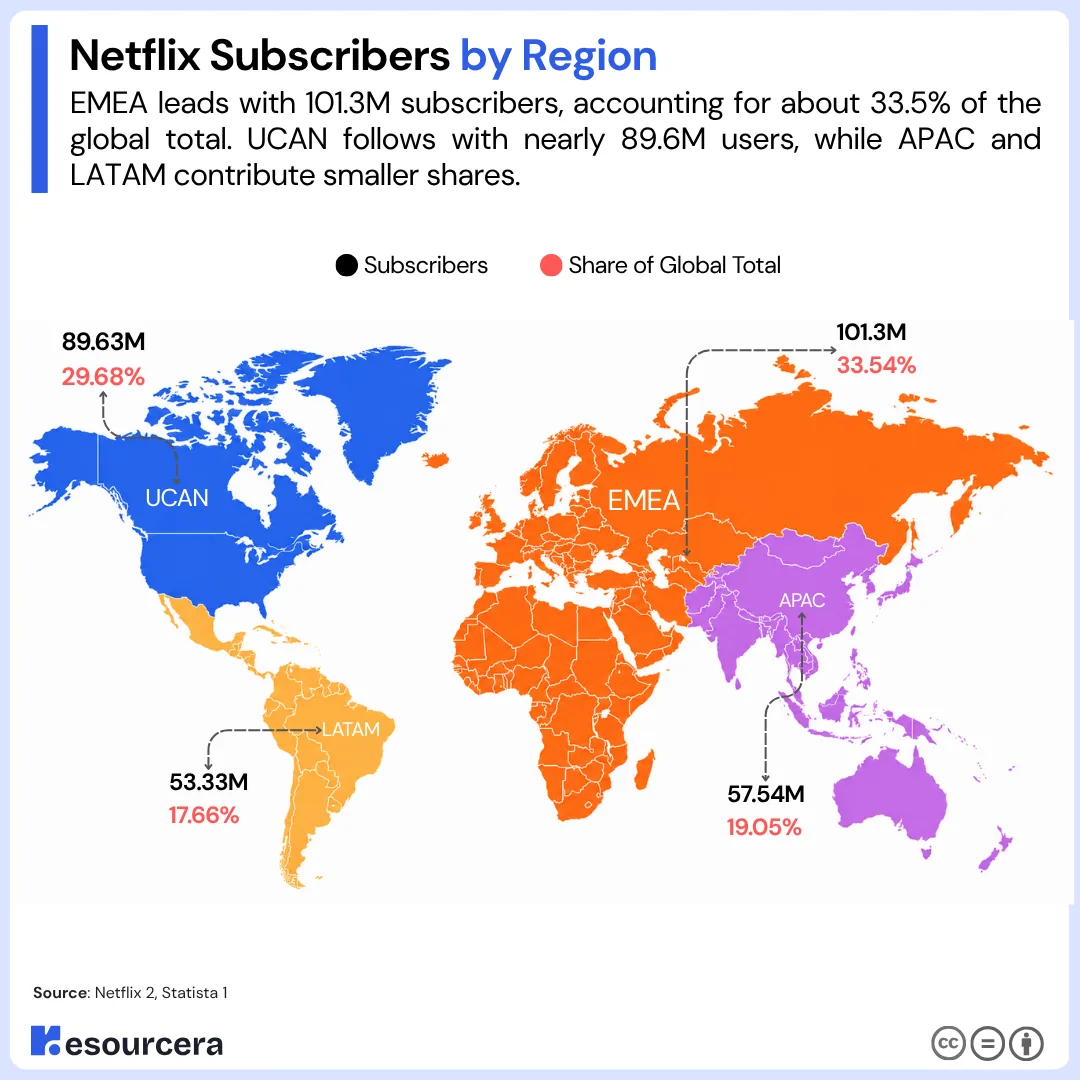
| Region | Subscribers | Share of Global Total |
|---|---|---|
| UCAN (US & Canada) | 89.63 million | 29.68% |
| EMEA (Europe, Middle East & Africa) | 101.3 million | 33.54% |
| LATAM (Latin America) | 53.33 million | 17.66% |
| APAC (Asia-Pacific) | 57.54 million | 19.05% |
Source: Netflix 2, Statista 1
(Note: The regional subscriber breakdown in this report covers data up to 2024. Netflix has not publicly released region-wise figures for 2025 yet. We will update this section as soon as the numbers are available.)
EMEA is Netflix’s largest region by subscribers, edging out UCAN despite the US being its single biggest individual market. APAC is the fastest-growing region, adding nearly 47 million members since 2018, a 442% increase. LATAM more than doubled in the same period, showing Netflix’s expansion into lower-cost markets outside North America.
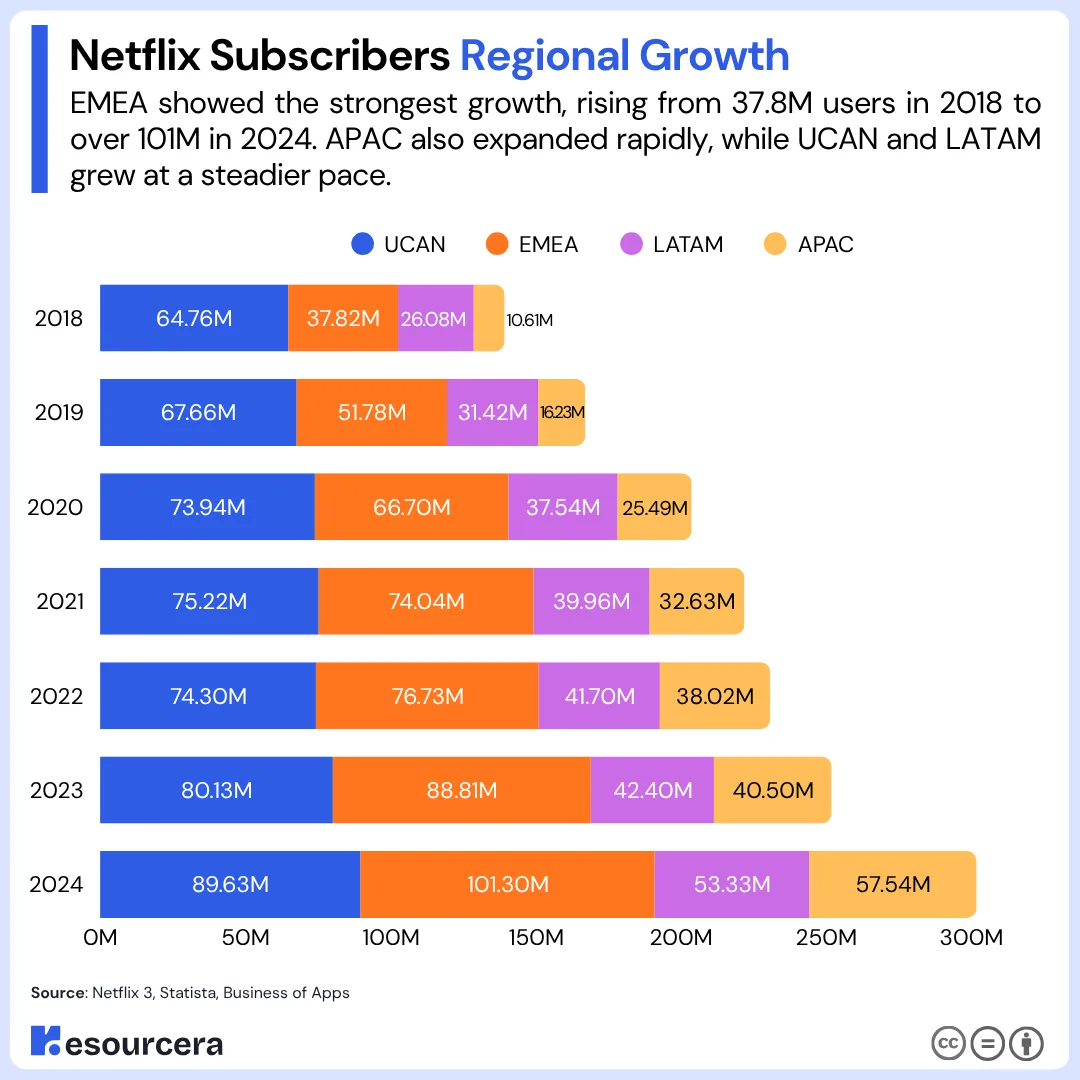
Here is how each region has grown since 2018:
| Year | UCAN | EMEA | LATAM | APAC |
|---|---|---|---|---|
| 2018 | 64.76M | 37.82M | 26.08M | 10.61M |
| 2019 | 67.66M | 51.78M | 31.42M | 16.23M |
| 2020 | 73.94M | 66.7M | 37.54M | 25.49M |
| 2021 | 75.22M | 74.04M | 39.96M | 32.63M |
| 2022 | 74.30M | 76.73M | 41.70M | 38.02M |
| 2023 | 80.13M | 88.81M | 42.40M | 40.50M |
| 2024 | 89.63M | 101.3M | 53.33M | 57.54M |
Source: Netflix 3, Statista 1, Business of Apps
Two things stand out. UCAN growth has been the flattest of all four regions, rising from 64.76 million in 2018 to 89.63 million in 2024, a 38% increase. APAC grew 442% in the same period, making it the region where Netflix’s next hundred million subscribers are most likely to come from.
Netflix Subscribers by Country
Netflix is available in 190+ countries, though subscriber density varies sharply by market. The US alone accounts for roughly 27% of global subscribers.
The US leads with nearly 88 million subscribers, more than four times the second-ranked UK at 19.8 million.
India and South Korea rank lower by raw numbers, but both are high-growth markets where Netflix has invested heavily in local original content. Brazil and Mexico together account for the bulk of Netflix’s Latin American subscriber base.
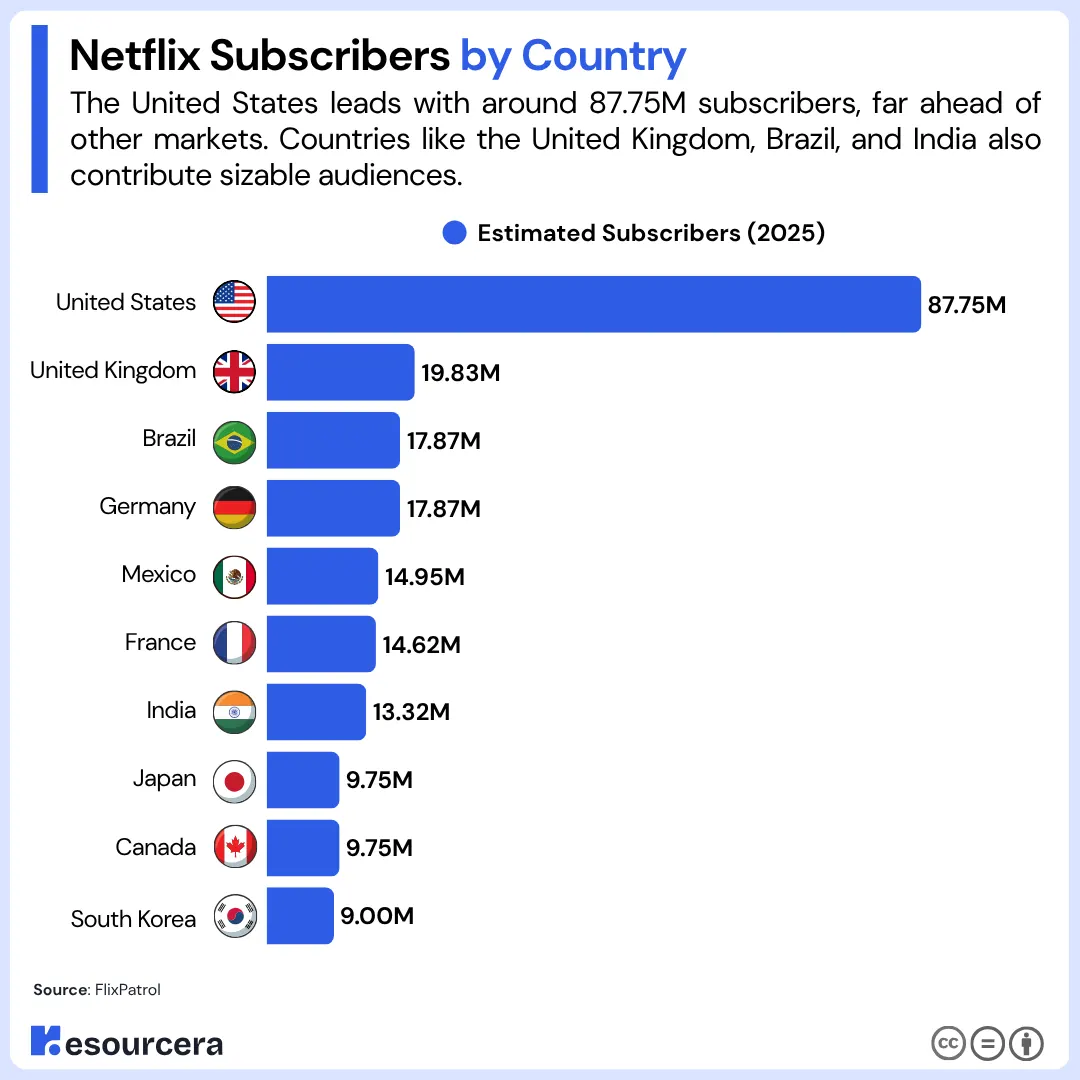
The table below shows the top 10 countries by estimated count as of 2026.
| Country | Estimated Subscribers (2026) |
|---|---|
| United States | 87.75 million |
| United Kingdom | 19.83 million |
| Brazil | 17.87 million |
| Germany | 17.87 million |
| Mexico | 14.95 million |
| France | 14.62 million |
| India | 13.32 million |
| Japan | 9.75 million |
| Canada | 9.75 million |
| South Korea | 9.00 million |
Source: FlixPatrol
Netflix Ad Tier Statistics 2026
Netflix launched its ad-supported plan in November 2022. By May 2026, it had grown into one of the largest ad-supported audiences in streaming worldwide.
| Year | Ad Tier Monthly Active Viewers |
|---|---|
| 2022 | ~1M (launch) |
| 2023 | 15M |
| 2024 | 70M |
| 2025 | 94M |
| 2026 | 250M+ |
szzNote: The 2026 figure uses Netflix’s revised “monthly active viewers” metric, which counts all people in a subscribing household who watched at least one minute of ad-supported content per month. Netflix changed its reporting metric from users to viewers.
Source: Netflix Upfront presentations, Deadline, The Verge
Netflix’s ad tier grew from 94 million to 250 million monthly active viewers in a single year, a 166% jump. 60% of new sign-ups now choose the ad-supported plan, and more than 80% of ad-tier viewers sign in weekly.
Netflix plans to expand the ad tier to 15 more countries in 2027, including Austria, Belgium, Colombia, Denmark, and Indonesia, among others.
Netflix User Demographics
Netflix’s audience spans generations, genders, and devices. The data below shows clear patterns in who subscribes, how the user base breaks down by gender, and how people access the platform online.
Netflix Subscribers by Age
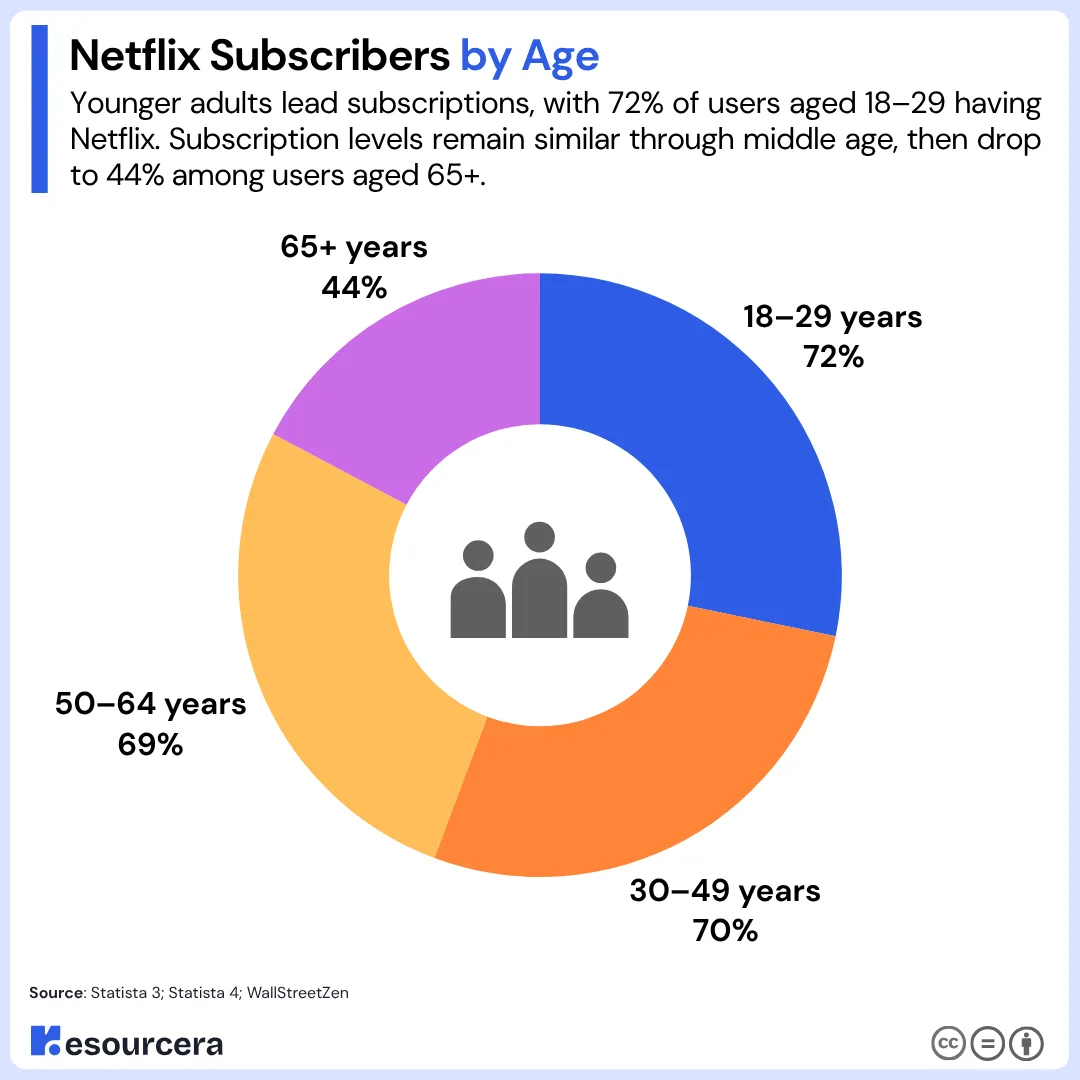
Netflix subscription rates are highest among younger adults and drop with age. The figures below show what share of each US age group holds a Netflix subscription.
| Age Group | Share with a Netflix Subscription |
|---|---|
| 18–29 years | 72% |
| 30–49 years | 70% |
| 50–64 years | 69% |
| 65+ years | 44% |
Sources: Statista 3, Statista 4; WallStreetZen
(Note: These figures show the percentage of people in each age group who subscribe to Netflix, not each group’s share of the total subscriber base.)
The drop from 69% among 50–64 year olds to 44% among those 65 and over is the sharpest age-related decline Netflix faces. Every other group sits between 69% and 72%, showing similar adoption rates across working-age adults.
Netflix Subscribers by Gender
Netflix’s user base is split almost evenly between men and women. According to widely cited industry data, women account for a slim majority of users globally.
| Gender | Share of Netflix Users |
| Women | 51% |
| Men | 49% |
Source: Search Logistics
A near-even gender split is uncommon among streaming services. It reflects the range of content Netflix carries, from drama and true crime to action and comedy. Competitors that rely heavily on one content category tend to skew more heavily toward one gender.
Time Spent on Netflix
Netflix users spend an average of 1 hour and 3 minutes per day on the platform in the US, more than users of any other streaming service tracked in 2026. Netflix’s own global data puts per-member viewing even higher, at around 2 hours per day on average across all paid members worldwide.
Plus, on average, a Netflix user also spends around 18 minutes browsing before deciding what to watch.
Here is how Netflix users engaged with the platform over the years:
| Year | Average Daily Time Spent by Users (Global) |
|---|---|
| 2009 | 6 minutes |
| 2010 | 24 minutes |
| 2011 | 48 minutes |
| 2012 | 1 hour 12 minutes |
| 2013 | 1 hour 24 minutes |
| 2014 | 1 hour 36 minutes |
| 2015 | 1 hour 48 minutes |
| 2016 | 1 hour 52 minutes* |
| 2017 | 1 hour 56 minutes* |
| 2018 | 1 hour 58 minutes* |
| 2019 | 2 hours |
| 2020 | 3 hours 12 minutes |
| 2025 | 1 to 2 hours |
Sources: eMarketer, Netflix 3
How Netflix Daily Watch Time Compares to Other Platforms
The table below shows the average daily time spent per user across major streaming platforms. Netflix leads every platform on this list.
| Platform | Average Daily Time Spent |
|---|---|
| Netflix | 1 hr 3 min (US, eMarketer) |
| Hulu | 56 min |
| Amazon Prime Video | ~49 min |
| Disney+ | ~40 min |
| Max (HBO Max) | ~38 min |
| Peacock | ~35 min |
Sources: eMarketer; Resourcera survey
Among streaming services only, Netflix holds a clear lead over Hulu by 7 minutes per day. Social media platforms, Instagram, X, and Facebook, all fall at least 28 minutes behind Netflix, which reflects a simple behavioural difference: people who open Netflix tend to stay for a full episode or more, while social media usage is more fragmented.
Netflix Market Share 2026
Netflix remains the world’s largest streaming platform by subscriber count (325 million), ahead of every competitor by a wide margin.
No other service comes close in raw subscriber count. Amazon Prime Video sits at around 250 million, while HBO Max sits at 140 million, and everyone else trails further behind.
Amazon Prime Video has a 22% share of the US streaming market, while Netflix sits at 21%. That one-point gap exists mainly because Prime Video comes bundled with Amazon Prime, so millions of Americans get it automatically without specifically choosing it as their streaming service.
Despite that, 47% of Americans say Netflix is their first choice when it comes to streaming. No other platform comes close to that number.
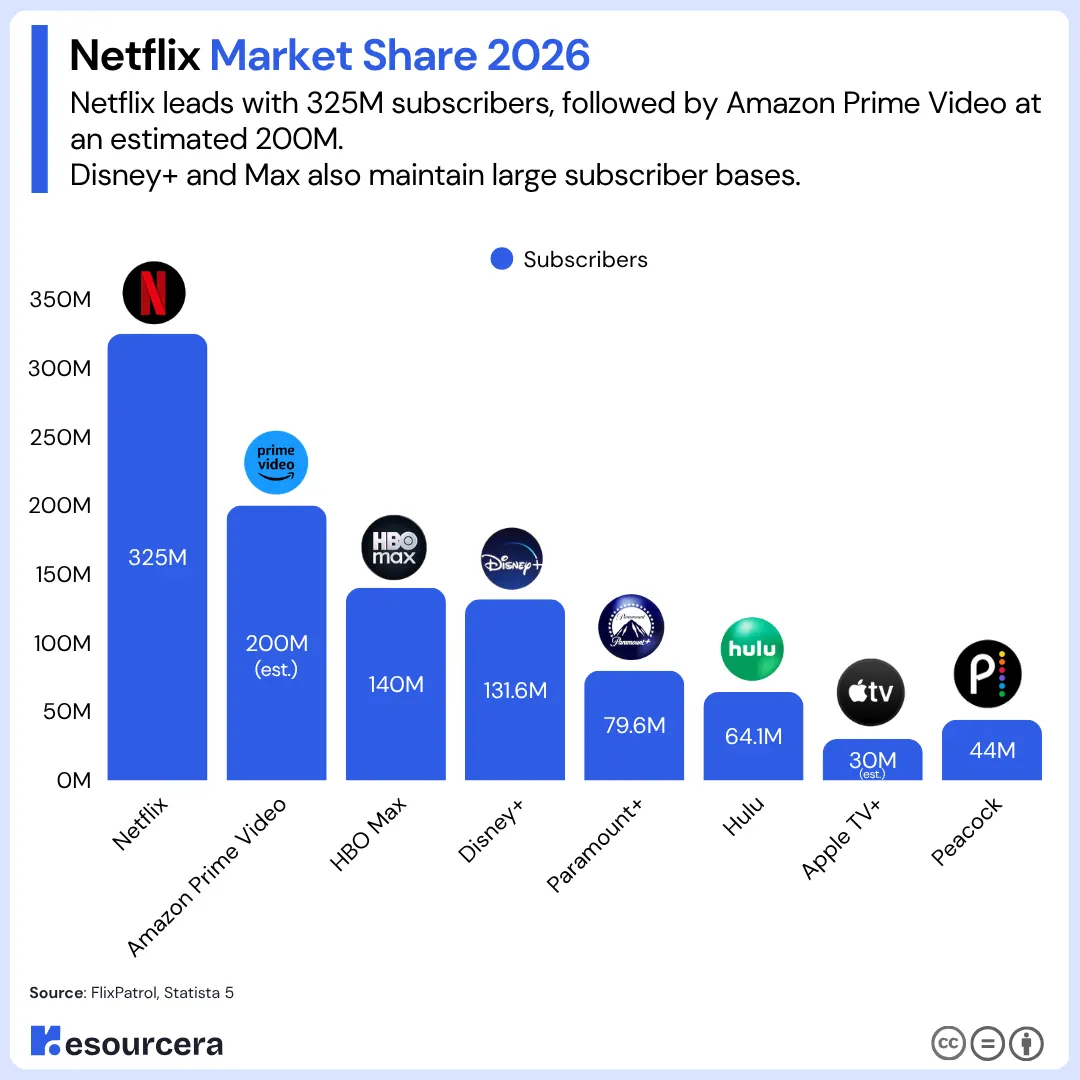
According to OTT subscribers, Here are the top Streaming Platforms by Subscribers;
| Platform | Subscribers | US SVOD Market Share |
|---|---|---|
| Netflix | 325 million | 21% |
| Amazon Prime Video | 250 million | 22% |
| HBO Max | 140 million | 13% |
| Disney+ | 131.6 million | 12% |
| Paramount+ | 79.6 million | 9% |
| Hulu | 64.1 million | 10% |
| Apple TV+ | 30 million (est.) | 8% |
| Peacock | 44 million | 1% |
Sources: FlixPatrol, Statista 5
(Note: The US SVOD market share percentages in the table above reflect each platform’s share of the US subscription video-on-demand market specifically, not global market share. The data for the global market share of OTT platforms is not currently available. We will update the post once we get the latest figures.)
What Do Users Watch on Netflix?
Wednesday Season 1 remains the most-watched series in Netflix history with 25.21 million views, while KPop Demon Hunters tops the all-time movie list with 32.51 million views.
Most-Watched Netflix Content (All the Time)
Here are the most-watched shows and movies on Netflix over the past two years:
| Most Watched Netflix Content (All the time) | Show/Movie | Views |
|---|---|---|
| KPop Demon Hunters | Movie | 325.1 million |
| Wednesday: Season 1 | Series | 252.1 million |
| Red Notice | Movie | 230.9 million |
| Carry-On | Movie | 172.1 million |
| Don’t Look Up | Movie | 171.4 million |
| The Adam Project | Movie | 157.6 million |
| Adolescence: Limited Series | Series | 142.6 million |
| Stranger Things 4 | Series | 140.7 million |
| Stranger Things 5 | Series | 133.8 million |
| Wednesday: Season 2 | Series | 119.3 million |
Sources: Netflix 1; Netflix 4, Shareholder Letter, Netflix Tudum
Recent releases are keeping that engagement going. In Q1 2026, Bridgerton Season 4 reached 94 million views in its first 91 days, and Netflix’s internal engagement quality metric hit an all-time high. As of Q2 2026, Lady with an Ermine and Berlin are among the titles picking up the most views.
Live events are also becoming a bigger part of what Netflix offers. In Q1 2026 alone, the World Baseball Classic drew 31.4 million viewers in Japan, and the BTS Comeback Live reached 18.4 million viewers globally. Netflix aired over 70 live titles in that quarter, a sign that the platform is moving well beyond on-demand content.
Are Netflix Subscribers Increasing or Decreasing?
Netflix subscribers are still growing, with the platform reaching a record subscriber count in Q4 2025.
- Netflix added 41.32 million subscribers in 2024, the largest single-year increase in its history.
- Subscriber count grew 7.62% in 2025, adding 23 million new paid members to reach 325 million.
- The ad-supported plan now drives most new sign-ups in supported markets.
Netflix now prioritises revenue reporting over regular subscriber updates and only reports subscriber milestones periodically.
Growth slowed to 7.62% in 2025 after a 16% surge the year before, but subscriber numbers continue to rise. The 2024 password-sharing crackdown converted account sharers into paying members and helped drive the platform’s strongest annual subscriber growth on record.
The ad plan is now Netflix’s main growth driver and accounts for most new sign-ups in supported markets. With APAC still under-penetrated and 15 more countries joining the ad tier in 2027, subscriber growth still has room to continue.
Netflix Updates 2026: What’s Actually Changing for Subscribers
Netflix had a turbulent few months. A major acquisition collapsed, its ad business hit a new scale milestone, and its password crackdown continued, converting users into paying customers.
Netflix’s Warner Bros. Bid Falls Apart
Netflix explored a deal to acquire Warner Bros. for $82.7 billion in late 2025, which would have brought HBO, Game of Thrones, and Succession to the platform. Netflix walked away on February 26, 2026, calling the deal financially unattractive at the required price. Paramount Skydance won the bid instead. Subscribers will not gain access to the HBO library through Netflix.
Source: Netflix 4
Password Sharing Crackdown: Still in Full Force
Since launching its paid sharing policy in May 2023, Netflix has added 50 million new subscribers, converting a user base that previously shared access for free. As of April 2026, Netflix has not reversed the policy; claims circulating on social media that the ban was rolled back are false. The platform continues to log out accounts used outside their registered household.
Source: Netflix 1
Netflix Upfront 2026: AI Ads, 250M Viewers, and Global Expansion
At its fourth annual Upfront on May 13, 2026, Netflix confirmed its ad-supported tier now reaches over 250 million global monthly active viewers, with more than 80% watching every week.
The company introduced AI agents that can manage, optimise, and buy ads autonomously, plus tools that help brands reformat existing assets into vertical video and pause ads without starting from scratch.
Netflix also confirmed its ad-supported plan will expand to 15 new countries from 2027, including Indonesia, the Philippines, Poland, and Thailand.
Source: Netflix Upfront
Read the complete Netflix Statistics report to explore key metrics, trends, and detailed insights about Netflix’s performance.
Wrap Up
325 million subscribers is the biggest Netflix has ever been, and the recovery from 2022 is one of the more underrated business turnarounds in recent memory.
But growth is slowing, the US market is competitive, and a large share of its viewer base still sits outside the paying subscriber count.
What happens next depends on how well Netflix converts its ad audience into real revenue and how deeply it can push into markets like India and Southeast Asia.

