Meta, formerly known as Facebook, earns a major portion of its revenue from digital advertising, which constitutes around 97% of its revenue.
With a total revenue of $164.4 billion, the platform continues to dominate the digital landscape.
Right from Digital Advertising and Reality Labs to the acquisition of WhatsApp and Instagram, Facebook has expanded its portfolio and shown significant growth.
To learn more about Facebook’s varied revenue sources, let’s dive into the details.
Facebook Revenue In 2025: Key Highlights
- As of 2024, Facebook’s total revenue is reported to be $164.4 billion, of which $91 billion is generated through the Facebook application.
- Facebook generated around $122 billion through advertising in 2024, and this number is expected to reach around $127 billion by 2027.
- One of the Major markets of Facebook’s Advertising platforms is estimated to generate revenue of $79.7 billion in 2025.
- Facebook generated $56 million through In-App purchases.
- The net profit of Facebook was $62.3 billion in 2024.
- Facebook’s growth over the past decade has been remarkable, with its revenue soaring by 2,20.
- North America, particularly the U.S. and Canada, remains Facebook’s biggest market, contributing 45.3% to its global revenue.
Facebook Revenue In 2025
Facebook continues to drive the digital revolution with 164.5 billion U.S. dollars of its annual advertising revenue, an increase of 21.87% from the previous year.
The remarkable growth in Meta’s revenue showcases its expansion of different advertising platforms, including Facebook, WhatsApp, and Instagram.
More than 200 million businesses opt for the use of Facebook to get in touch with their audiences, and over 10 million advertisers run Ad campaigns on Facebook.
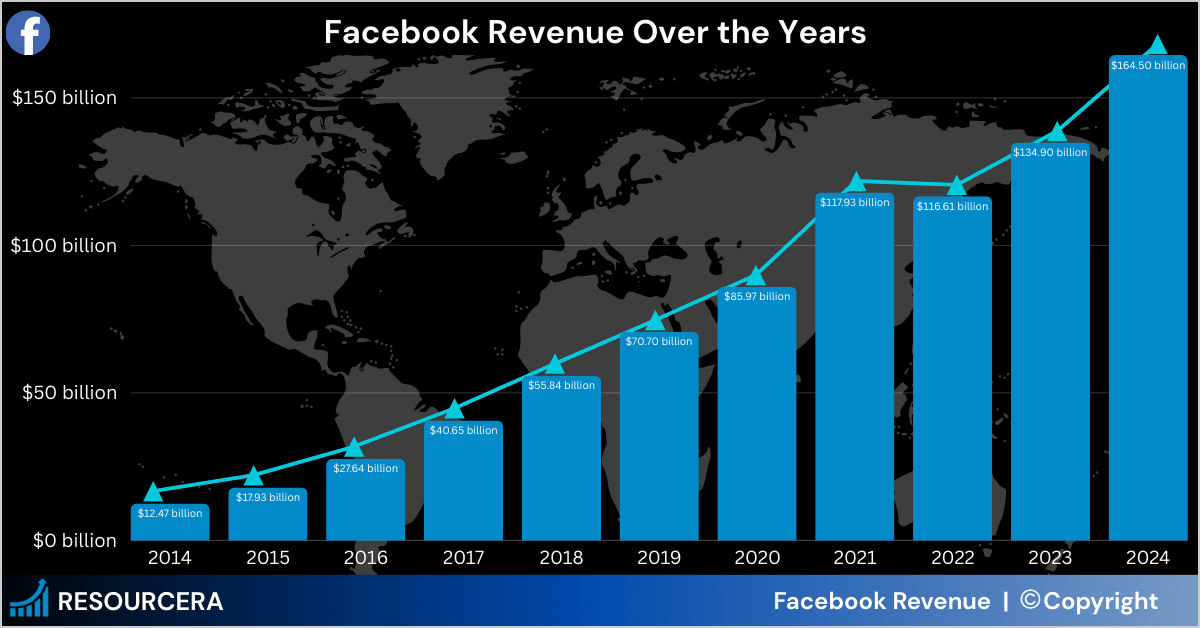
Below is the complete breakdown of the revenue generated by the Meta platform, formerly known as Facebook.
| Year | Facebook Revenue |
|---|---|
| 2014 | $12,466 million |
| 2015 | $17,928 million |
| 2016 | $27,638 million |
| 2017 | $40,653 million |
| 2018 | $55,838 million |
| 2019 | $70,697 million |
| 2020 | $85,965 million |
| 2021 | $117,929 million |
| 2022 | $116,609 million |
| 2023 | $134,902 million |
| 2024 | $164,501 million |
Source: Statista
Facebook Revenue by Region
The United States and Canada are the countries with the largest source of Facebook’s Revenue, constituting $72 billion in 2024.
After Canada and the U.S., Europe is considered to be the second-largest country, with the maximum Facebook revenue of $38.7 billion.
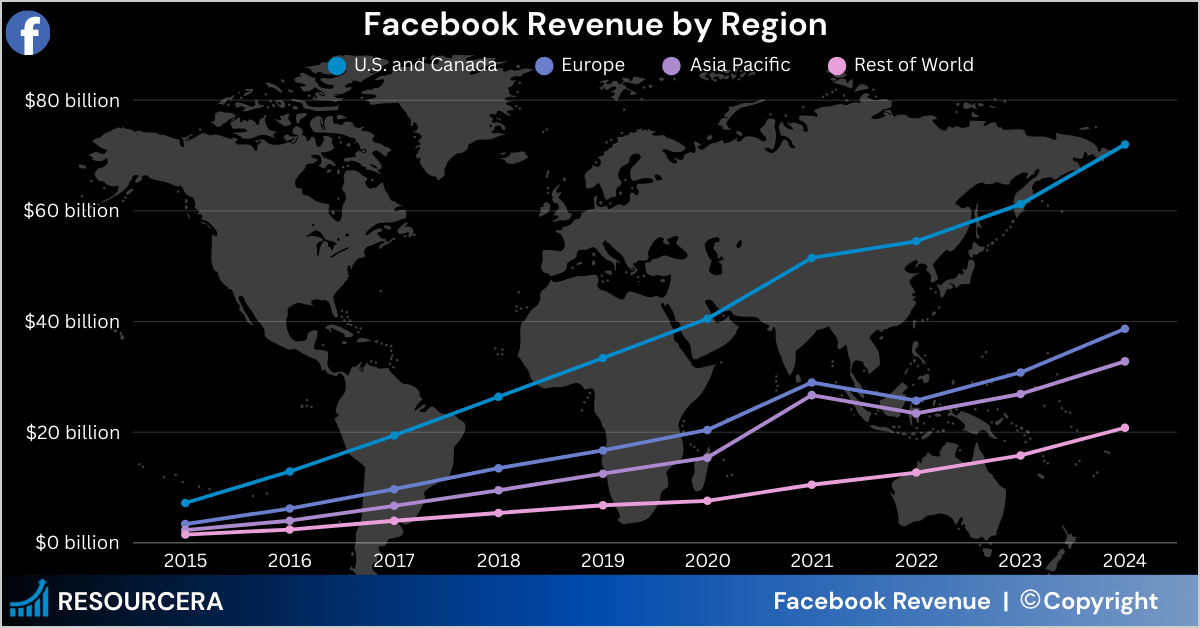
To get a detailed overview of Facebook’s Revenue across various regions, check out the Data below.
| Year | U.S. and Canada | Europe | Asia Pacific | Rest of World |
|---|---|---|---|---|
| 2015 | $7.2 billion | $3.4 billion | $2.3 billion | $1.5 billion |
| 2016 | $12.9 billion | $6.2 billion | $4 billion | $2.4 billion |
| 2017 | $19.4 billion | $9.7 billion | $6.7 billion | $4 billion |
| 2018 | $26.4 billion | $13.5 billion | $9.5 billion | $5.4 billion |
| 2019 | $33.4 billion | $16.7 billion | $12.5 billion | $6.8 billion |
| 2020 | $40.5 billion | $20.4 billion | $15.4 billion | $7.6 billion |
| 2021 | $51.5 billion | $29 billion | $26.7 billion | $10.5 billion |
| 2022 | $54.5 billion | $25.7 billion | $23.4 billion | $12.7 billion |
| 2023 | $61.2 billion | $30.8 billion | $26.9 billion | $15.8 billion |
| 2024 | $72 billion | $38.7 billion | $32.8 billion | $20.8 billion |
Source: Business of Apps
Facebook Advertising Revenue
The advertising revenue of Facebook was reported to be $121.80 billion in 2024 and is expected to hit $123.73 billion in 2025, reflecting a 1.6% increase from the previous year.
Facebook ads were more likely to reach women than men, reaching 74.6% of female users and only 66.8% of male users.
Facebook contributed around 23.5% of Digital Ad revenue in the United States.
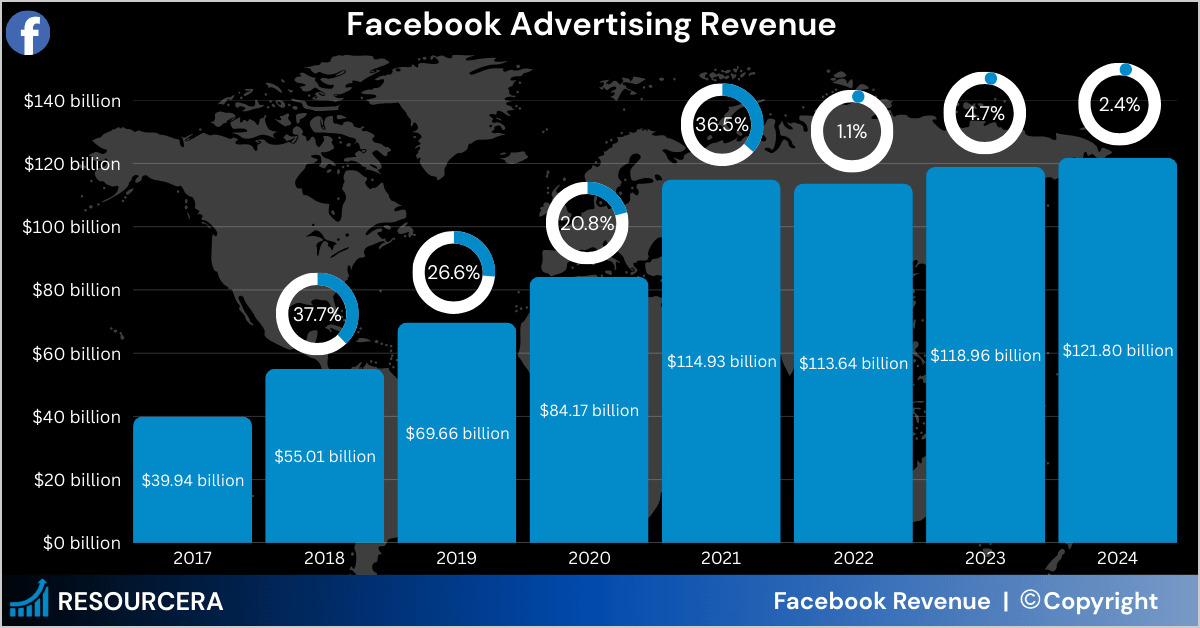
The following table represents Facebook’s Ad revenue from 2017 to 2024.
| Year | Facebook’s Ad revenue | Year-over-Year Change |
|---|---|---|
| 2017 | $39.94 billion | – |
| 2018 | $55.01 billion | +37.7% |
| 2019 | $69.66 billion | +26.6% |
| 2020 | $84.17 billion | +20.8% |
| 2021 | $114.93 billion | +36.5% |
| 2022 | $113.64 billion | -1.1% |
| 2023 | $118.96 billion | +4.7% |
| 2024 | $121.80 billion | +2.4% |
Source: Oberlo
Below is the forecasted Ad revenue of Facebook from 2025 to 2027.
| Year | Forecasted Ad revenue of Facebook | Expected yearly change |
|---|---|---|
| 2025 | $123.73 billion | +1.6% |
| 2026 | $125.37 billion | +1.3% |
| 2027 | $127.27 billion | +1.5% |
Considering the above data, it is clear that the Ad revenue of Facebook is expected to grow continuously, dominating the digital landscape.
Facebook in-app Purchases
Facebook primarily offers In-App purchases via its instant game platform. The purchase of these games is supported on Android, iOS, and the Web.
- The revenue per share for the games on Facebook constitutes around 70%/30%.
- A share of revenue is earned by Facebook through its in-app ads, which are supported by two formats, i.e., Audience Network Ads that are integrated with games, and Interstitial ads and rewarded videos.
- The messenger app of Facebook earned a revenue of 130 billion U.S. dollars.
- The In-App revenue of Facebook’s Messenger was demonstrated to be under $2 million across the app stores.
Revenue generated through Reality Labs
The Reality Labs of Meta comprises augmented and virtual-reality products. The division generated revenue of $2.1 billion.
| Year | Revenue generated by Meta’s Reality Labs |
|---|---|
| 2019 | $501 million |
| 2020 | $1139 million |
| 2021 | $2274 million |
| 2022 | $2159 million |
| 2023 | $1896 million |
| 2024 | $2146 million |
Source: Statista
Meta’s Reality Labs segment earned a revenue of $1.8 billion in the Fourth quarter of 2024. In spite of this revenue, the segment reported a loss of $4.97 billion in the same quarter due to heavy investment in technology.
Profit generated by Facebook
The driving force that contributes to Facebook’s profit is its advertising revenue.
The net profit generated by Facebook after deducting the overall expenses of the company was $62.3 billion in 2024.
The table below showcases Facebook’s net income over the years.
| Year | Facebook Revenue |
|---|---|
| 2010 | $0.37 billion |
| 2011 | $0.66 billion |
| 2012 | $0.03 billion |
| 2013 | $1.4 billion |
| 2014 | $2.9 billion |
| 2015 | $3.6 billion |
| 2016 | $10.1 billion |
| 2017 | $15.9 billion |
| 2018 | $22.1 billion |
| 2019 | $18.4 billion |
| 2020 | $29.1 billion |
| 2021 | $39.3 billion |
| 2022 | $23.1 billion |
| 2023 | $39 billion |
| 2024 | $62.3 billion |
Source: Business of Apps
Based on the data above, Facebook experienced an increase of 59.4% in its net income, which was $39 billion in 2023 to $62.3 billion in 2024.
Highest Earning Facebook Creators and Pages
Facebook has several pages and creators comprising a massive set of followers and substantial income.
Here’s a quick overview of the highest-earning Facebook pages and creators.
| Name of Page/Creator | Number of followers |
|---|---|
| 189 million | |
| Cristiano Ronaldo | 170 million |
| Samsung | 162 million |
| Mr. Bean | 141 million |
| 5-Minute Crafts | 126 million |
| Shakira | 123 million |
| CGTN | 122 million |
| Lionel Messi | 116 million |
| Will Smith | 116 million |
| Real Madrid C.F. | 114 million |
Source: Oberlo
