As of 2026, streaming accounts for 47.6% of all US television viewing, more than cable, which accounts for 21.6%, and broadcast, which makes up 19.9%.
Only 36% of American adults still pay for cable or satellite TV, down from 76% a decade ago!
The average cable TV bill sits at $147 per month, while the average cord-cutting household spends around $70 per month on streaming. That gap, worth roughly $900 a year, has pushed the pay-TV industry from a peak of around 100 million subscribers to about 62 million today, and only 41 million of those are on traditional cable, satellite, or telco TV.
This post covers the state of cord cutting in the United States as of 2026. We include data on cord-cutting households, remaining cable subscribers, streaming versus cable viewing share, costs, the reasons people cut (and the reasons some come back), demographics, and streaming subscription behaviour.
Highlights From Cord Cutting Statistics (2026)
- An estimated 80.7 million US households will have cut the cord by the end of 2026, against just 54.3 million pay-TV households.
- Only 36% of US adults subscribe to cable or satellite TV, down from 76% in 2015.
- Streaming takes 47.6% of US TV viewing time as of 2026, beating cable and broadcast combined (41.5%) by 6.1 percentage points.
- May 2025 was the first month in history that streaming out-viewed cable and broadcast combined (44.8% versus 44.2%).
- The average cable TV bill is $147 per month. The average cord cutter pays about $70 per month.
- US pay-TV providers lost about 2.03 million subscribers in Q1 2026 alone.
- Comcast is down to 10.67 million video subscribers, from 22.6 million in 2014, a loss of roughly 11.9 million.
- YouTube TV, with an estimated 9.4 million subscribers, is now the largest single pay-TV provider in America.
- 90% of US households have at least one paid streaming service, and the average subscribing household pays $69 per month for four services.
How Many Households Have Cut The Cord In The US?
Cord cutting has moved from a growing trend to the new normal in the United States. More households now live without traditional cable or satellite TV than those that still pay for it, and the gap continues to grow each year.
An Estimated 80.7 Million US Households Will Have Cut The Cord By The End Of 2026
By the end of 2026, an estimated 80.7 million US households will have no traditional pay-TV subscription, compared to just 54.3 million households that keep one.
Cord-cutting households first outnumbered pay-TV households in 2023, and the gap has widened every year since. Back in 2018, the picture was reversed: 90.3 million households paid for TV while only 37.3 million went without.
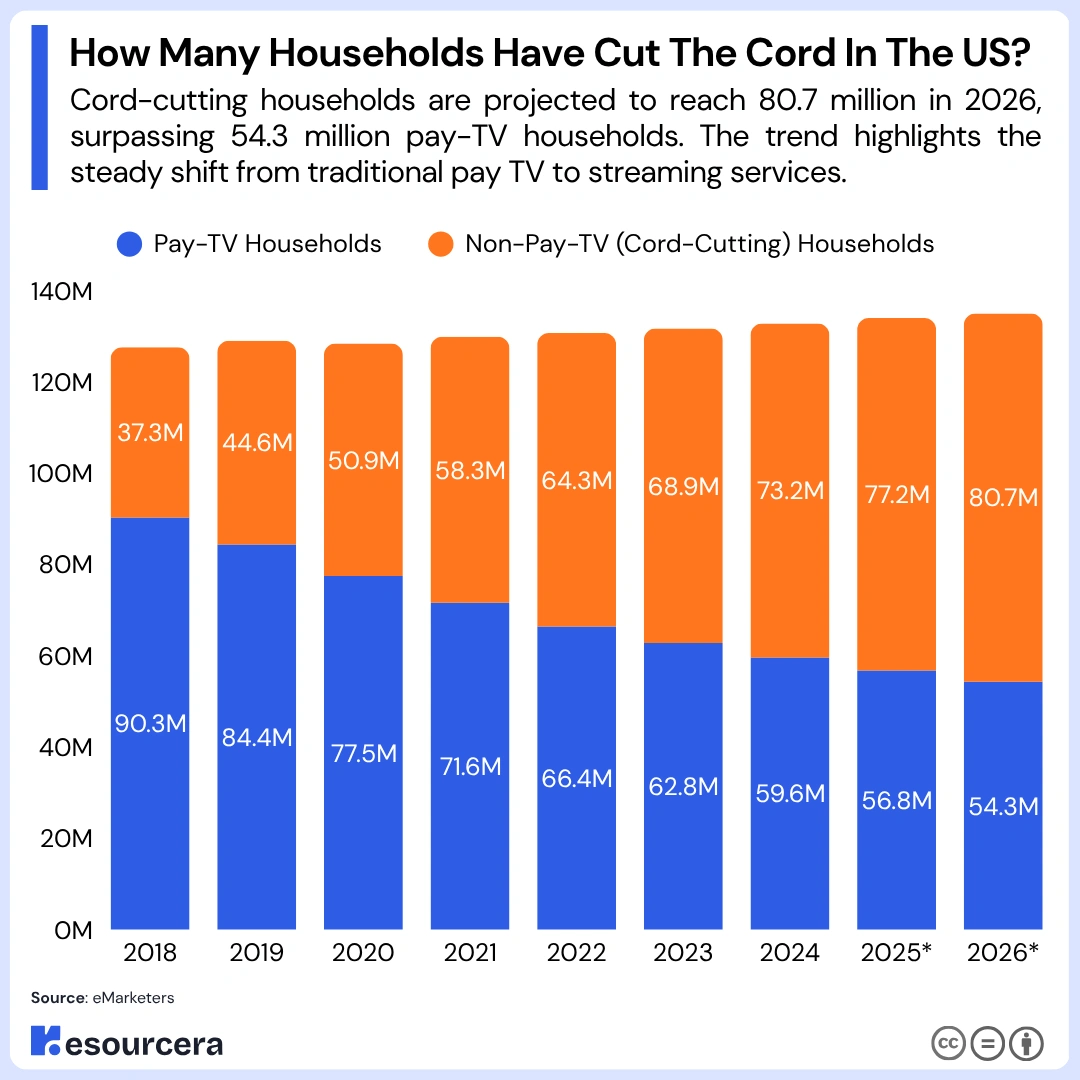
Here is a table showing pay-TV and non-pay-TV households in the US by year:
| Year | Pay-TV Households | Non-Pay-TV (Cord-Cutting) Households |
|---|---|---|
| 2018 | 90.3 million | 37.3 million |
| 2019 | 84.4 million | 44.6 million |
| 2020 | 77.5 million | 50.9 million |
| 2021 | 71.6 million | 58.3 million |
| 2022 | 66.4 million | 64.3 million |
| 2023 | 62.8 million | 68.9 million |
| 2024 | 59.6 million | 73.2 million |
| 2025 | 56.8 million | 77.2 million |
| 2026* | 54.3 million | 80.7 million |
Source: eMarketer
Only 36% of US Adults Still Subscribe to Cable or Satellite TV
As of July 2025, just 36% of American adults say they receive TV through cable or satellite, according to Pew Research Center. That is less than half the 76% who subscribed in 2015.
Pew’s decade of tracking shows one of the fastest consumer behaviour reversals ever measured. The share fell to 56% by 2021 and has continued sliding by roughly two to three points a year since.
Here is a table showing the share of US adults with a cable or satellite subscription over time:
| Year | Share Of US Adults With Cable Or Satellite TV |
|---|---|
| 2015 | 76% |
| 2021 | 56% |
| 2025 | 36% |
Source: Pew Research Center, CableCompare 1
How Many People Still Have Cable TV?
Millions of Americans still pay for live television, but the market now includes more than traditional cable and satellite services. Internet-based TV packages such as YouTube TV and Hulu + Live TV are helping support the total subscriber count as traditional providers continue to lose customers.
US Pay-TV Ended Q1 2026 With 62.23 Million Subscribers
The US pay-TV industry finished the first quarter of 2026 with 62.23 million subscribers, after losing about 2.03 million in the quarter, according to MoffettNathanson’s Cord-Cutting Monitor.
Of that total, only 40.90 million subscribers are on traditional providers (cable, satellite, and telco TV). The remaining 21.33 million subscribe through internet-delivered vMVPD services such as YouTube TV, Hulu + Live TV, Sling TV, and Fubo. At its peak in the early 2010s, US pay-TV counted roughly 100 million subscribers, meaning the industry has surrendered close to 40% of its base.
Source: Light Reading 1.
Q3 2025 Delivered Pay-TV’s First Quarterly Gain Since 2017, Thanks Entirely To Streaming Bundles
Pay-TV as a category added roughly 282,000 net subscribers in Q3 2025, its first quarterly gain in about eight years. The gain came entirely from vMVPDs, led by YouTube TV, which added an estimated 750,000 subscribers in the quarter.
Traditional cable and satellite providers still lost subscribers, just fewer of them. The category slipped back into losses in Q4 2025 and Q1 2026, which suggests the gain was a seasonal spike around the start of the NFL season rather than a reversal of the trend.
Source: Light Reading.
YouTube TV, With Around 9.4 Million Subscribers, Is Now America’s Largest Pay-TV Provider
YouTube TV reached an estimated 9.4 million subscribers in late 2025, overtaking Comcast to become the largest single provider of paid live TV in the United States.
The symbolism is hard to overstate. The biggest “cable company” in America is now a streaming app owned by Google. Traditional satellite tells the opposite story: DISH TV ended 2024 with 5.69 million subscribers, having lost 785,000 in the year, and its Sling TV streaming arm counted 2.09 million.
Source: CableCompare 2, DISH DBS 10-K FY2024.
Pay-TV Providers Lost About 5 Million Subscribers a Year During The Worst of The Decline
The largest US pay-TV providers lost about 5.04 million net video subscribers in 2023, the worst year on record, following losses of about 4.6 million in 2022 and roughly 5 million in 2020.
The acceleration is stark against the start of the trend. In 2014, the industry lost just 126,000 subscribers all year. Between the end of 2018 and the end of 2023, the top providers went from 91.5 million subscribers to 71.3 million, a loss of over 20 million in five years.
Here is a table showing net pay-TV subscribers lost per year:
| Year | Net Pay-TV Subscribers Lost |
|---|---|
| 2014 | 126,000 |
| 2015 | 383,000 |
| 2016 | 797,000 |
| 2017 | 1,493,000 |
| 2018 | 2,875,000 |
| 2019 | 4,914,000 |
| 2020 | 5,119,000 |
| 2021 | 4,689,000 |
| 2022 | 4,590,000 |
| 2023 | 5,035,000 |
Source: Leichtman Research Group, Statista.
Streaming Vs Cable: Share Of US TV Viewing
Streaming is now the largest source of television viewing in the United States. Its share has grown beyond both cable and broadcast, reflecting the continued shift toward on-demand platforms and internet-based TV services.
Streaming Takes 47.6% Of US TV Viewing, More Than Cable And Broadcast Combined
As of 2026, streaming accounts for 47.6% of all time Americans spend watching television, according to Nielsen’s The Gauge. Cable takes 21.6% and broadcast takes 19.9%, which is 41.5% between them.
The calculation is simple: 47.6 minus 41.5 leaves streaming 6.1 percentage points ahead of all traditional linear television added together. Five years ago, when The Gauge launched in May 2021, streaming held 26% while cable alone held 39%.
Here is a table showing how Americans watched television in April 2026:
| Viewing Type | Share Of US TV Viewing |
|---|---|
| Streaming | 47.6% |
| Cable | 21.6% |
| Broadcast | 19.9% |
| Other | 11.0% |
Source: Nielsen 1.
May 2025 Was The First Month Streaming Ever Beat Cable And Broadcast Combined
In May 2025, streaming reached 44.8% of total TV viewing, narrowly surpassing the combined 44.2% share of broadcast (20.1%) and cable (24.1%) for the first time in history.
Nielsen called it a historic TV milestone. Since The Gauge began in May 2021, streaming viewing has grown 71%, while broadcast has fallen 21% and cable has fallen 39%. Nielsen predicted at the time that the lead might wobble when football season returned, but it never gave the lead back: streaming closed 2025 at a record 47.5% and has held above 47% into 2026.
Source: Nielsen 2
YouTube Alone Commands 13.4% Of All US TV Screen Time
YouTube is the single most-watched television platform in America, taking 13.4% of all TV screen time in April 2026, well ahead of Netflix at 7.8%.
No cable network comes close to either. Notably, three of the top ten streaming platforms (The Roku Channel, Tubi, and the free tiers within others) are free ad-supported services, which means part of cord cutting’s second wave is people replacing a $147 cable bill with television that costs nothing at all.
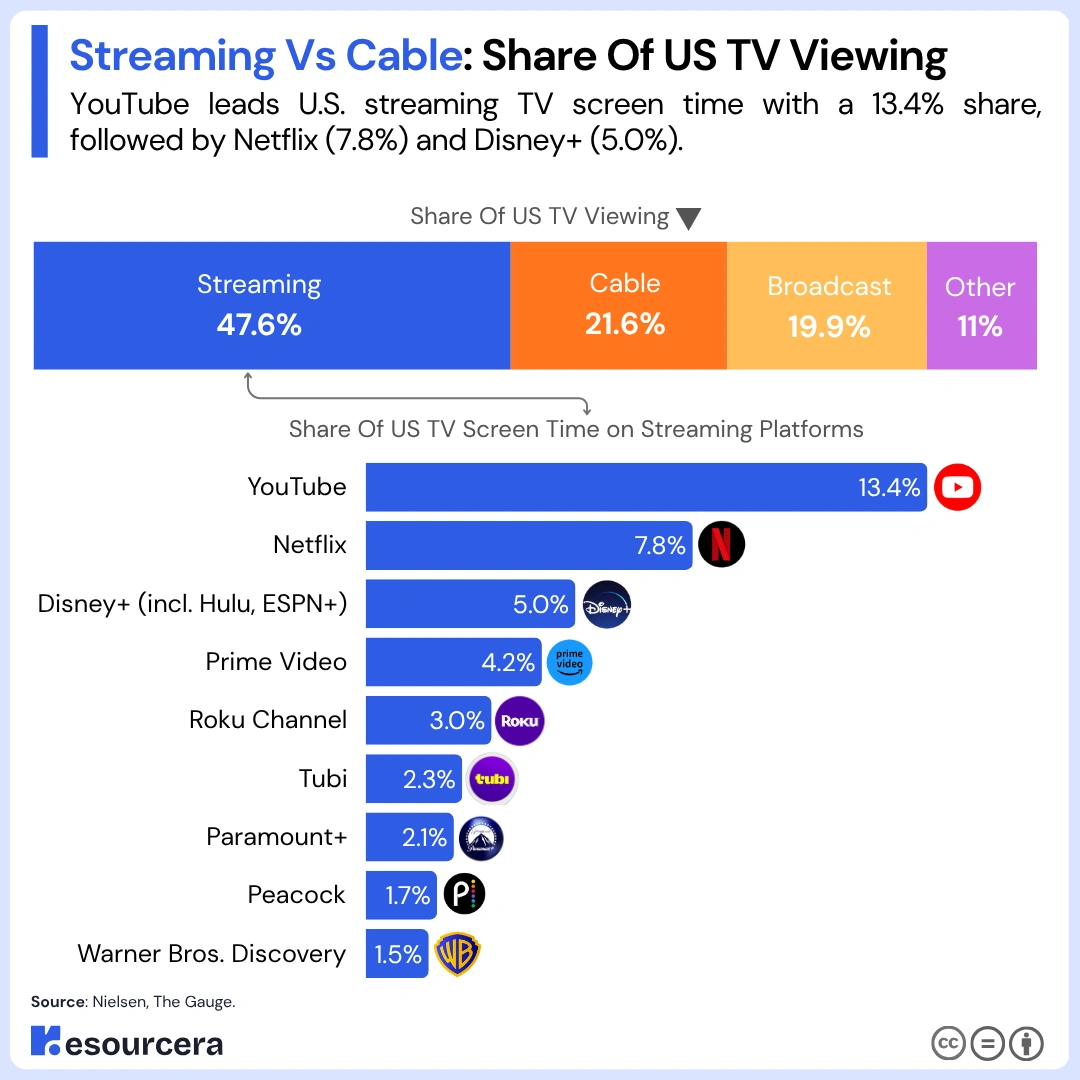
Here is a table showing the share of US TV screen time by streaming platform in April 2026:
| Streaming Platform | Share Of US TV Screen Time |
|---|---|
| YouTube | 13.4% |
| Netflix | 7.8% |
| Disney+ (incl. Hulu, ESPN+) | 5.0% |
| Prime Video | 4.2% |
| Roku Channel | 3.0% |
| Tubi | 2.3% |
| Paramount+ | 2.1% |
| Peacock | 1.7% |
| Warner Bros. Discovery | 1.5% |
| Other Streaming Services | 6.6% |
Source: Nielsen 1, Netflix Statistics by Resourcera
How Much Does Cable Cost Compared To Streaming?
The Average Cable TV Bill Is $147 Per Month in 2026
The average American cable TV bill stands at $147 per month, which works out to over $1,760 a year, based on a CableTV.com survey of nearly 27,000 TV customers.
For television alone, before internet or phone bundling, the average base bill in 2025 was about $108 per month, and 41.6% of cable subscribers reported paying more than $151. Hidden charges do much of the damage: broadcast TV fees, regional sports surcharges, and equipment rentals can add up to 24% on top of the advertised package price, and six of the nine major cable providers raised their broadcast TV fees by an average of 12.8% in 2024 alone.
Source: CableTV.com, Cord Cutters News
Cord Cutters Pay About $70 Per Month, Less Than Half The Average Cable Bill
The average cord-cutting household spends $70 or less per month on its streaming services, compared to the $147 average cable TV bill.
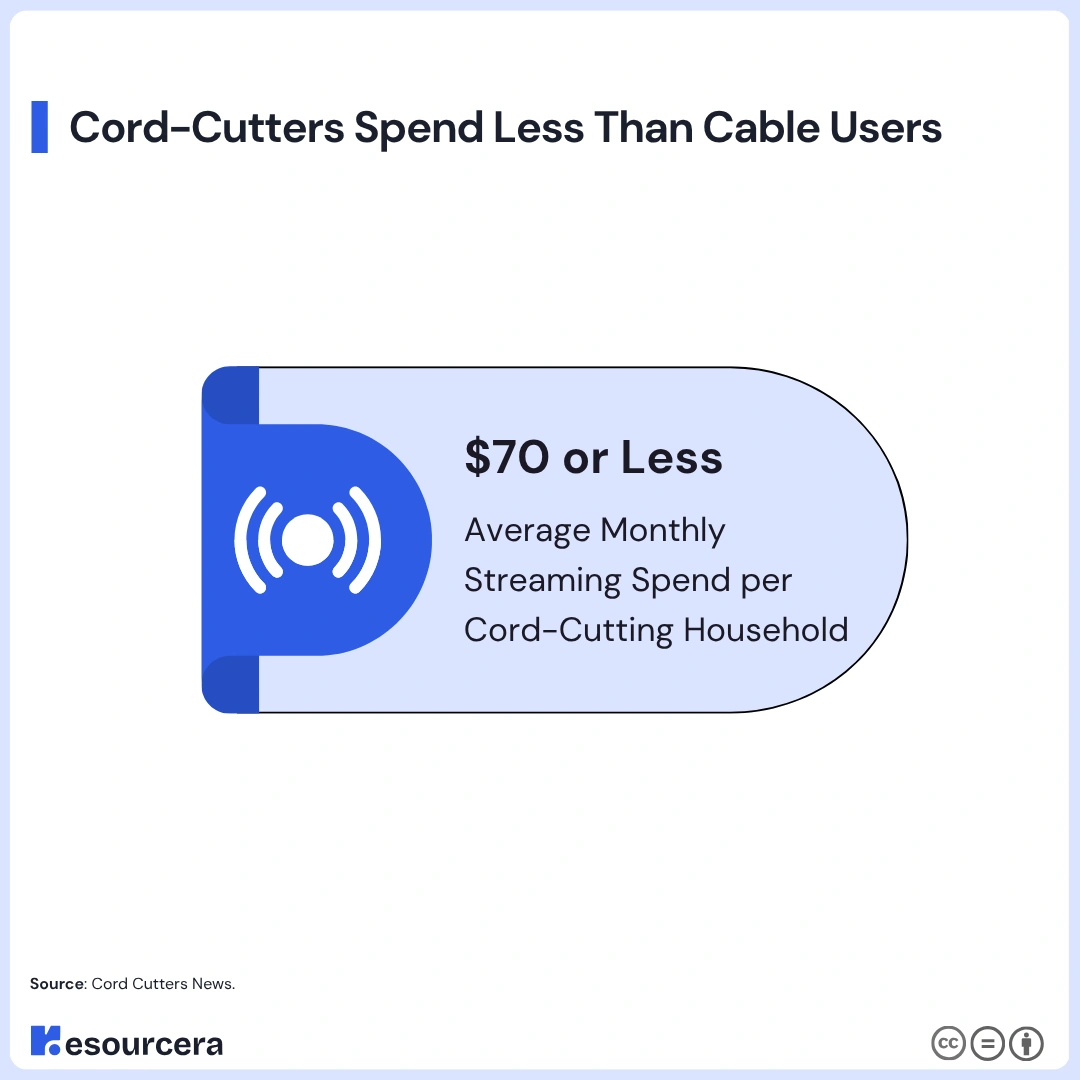
Here is how we see it: the formula for the annual saving is ($147 – $70) x 12 = $924 per year!
Source: Cord Cutters News
The Average Streaming Household Pays $69 Per Month For Four Services
US households that subscribe to streaming video spend an average of $69 per month across an average of four paid services.
That figure has held flat year over year, but tolerance for increases has not. More than 61% of consumers say they would cancel their favourite streaming service if its monthly price rose by just $5, and 73% say they are frustrated that their services keep raising prices. Streamflation is real, yet even a four-service stack still undercuts the average cable bill by more than half.
Source: Deloitte Digital Media Trends 2026
Why Do People Cut The Cord? (Top Motivators)
Rising prices are the top motivator for Americans cutting the cord. Among adults with no cable or satellite subscription, 74% say the service is too expensive. 70% say they can already access the content they want online, and 45% say they do not watch television often enough to justify the bill. Streaming is what made leaving possible. The price is what makes people leave.
| Reason for not subscribing | Share of non-subscribing adults |
|---|---|
| Cable and satellite are too expensive | 74% |
| Can access the content they want online | 70% |
| Do not watch TV often enough | 56% |
Here is a table showing the share of people who cited cost as the reason for cord cutting, by age:
| Age group | Share citing expense |
|---|---|
| 18 to 29 | 57% |
| 30 to 49 | 72% |
| 50 and older | Close to 80% |
Source: Resourcera Online Survey
Why Do People Keep Cable Or Come Back? (Top Demotivators)
Live sports is the single biggest driver pulling cord cutters back, cited by 18.4% of returning subscribers, ahead of live entertainment events (10.0%) and cable arriving as part of a bundle (9.7%).
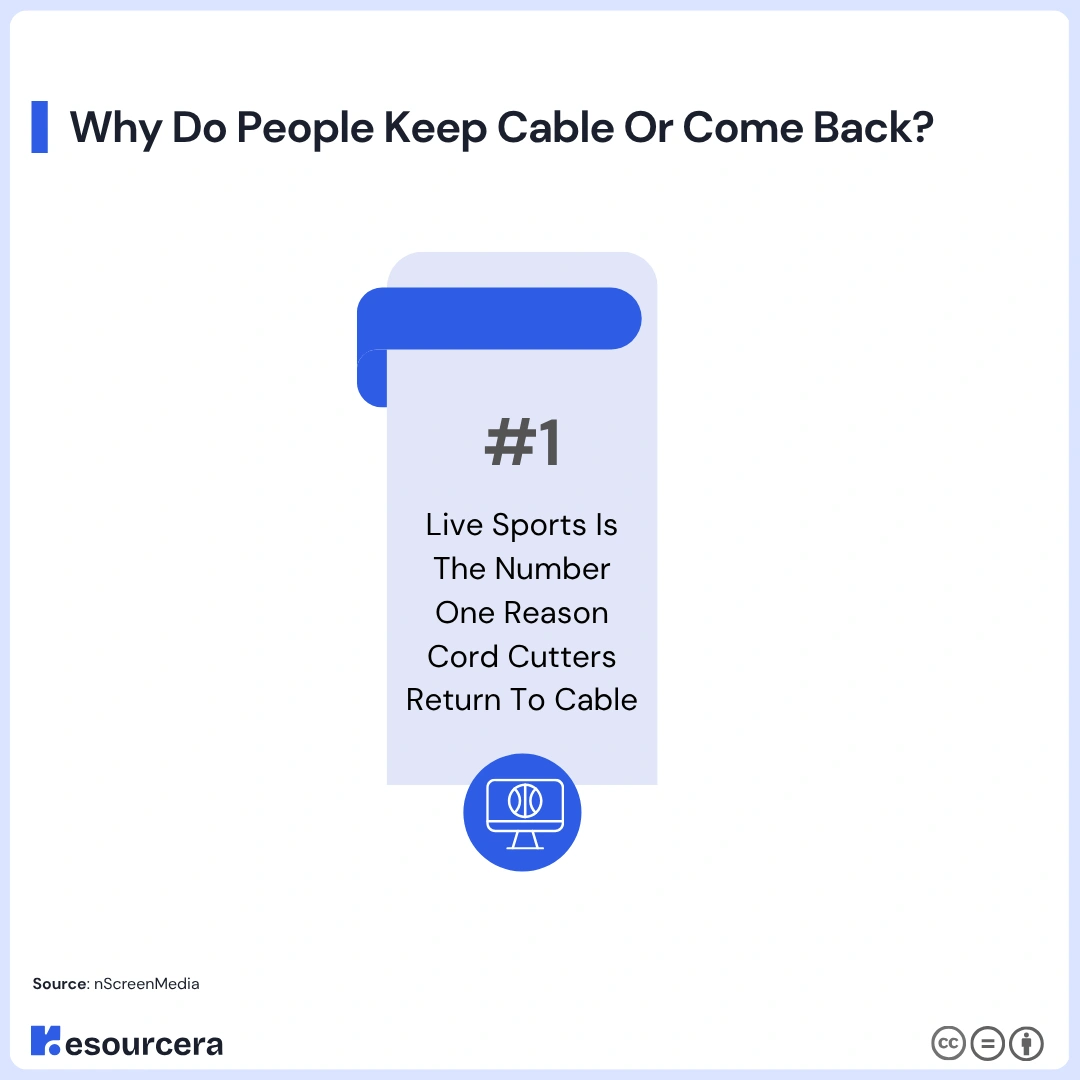
Nearly half of current cable TV subscribers are former cord-cutters who came back. Sports remains the last exclusive stronghold of the linear bundle, although even that is eroding as the NFL, NBA, and FIFA World Cup migrate to Peacock, Netflix, and Prime Video.
Source: NScreenMedia
Older Viewers Are The Bundle’s Last Loyal Audience
64% of Americans aged 65 and older still subscribe to cable or satellite TV, four times the rate of 18-to 29-year-olds, of whom only 16% subscribe.
The generational cliff is the clearest predictor of where the market goes next. Every year, the cable-first cohort shrinks and the streaming-native cohort grows, which is why no analyst models a recovery for the traditional bundle.
Here is a table showing cable and satellite subscription rates by age group in 2025:
| Age Group | Share Subscribing To Cable Or Satellite |
|---|---|
| 18 to 29 | 16% |
| 30 to 49 | 23% |
| 50 to 64 | 44% |
| 65+ | 64% |
Source: CableCompare
Bundling Streaming Into Cable Is Slowing The Losses
Charter Communications added 44,000 video subscribers in Q4 2025, a rare quarterly gain for a traditional cable operator, after it began bundling ad-supported streaming apps such as Disney+, Max, and Paramount+ into its Spectrum TV packages at no extra cost.
Charter’s video losses shrank to just 60,000 in Q1 2026, versus 181,000 a year earlier, cutting its annual decline rate to 1.3% from nearly 10% two years prior. It is the first strategy in a decade that has meaningfully slowed a major cable operator’s bleeding, though it works by conceding that streaming is what customers actually want.
Source: Light Reading 1
Cord Cutting Demographics
28% Of Americans Are Hybrid Viewers Who Pay For Both Cable And Streaming
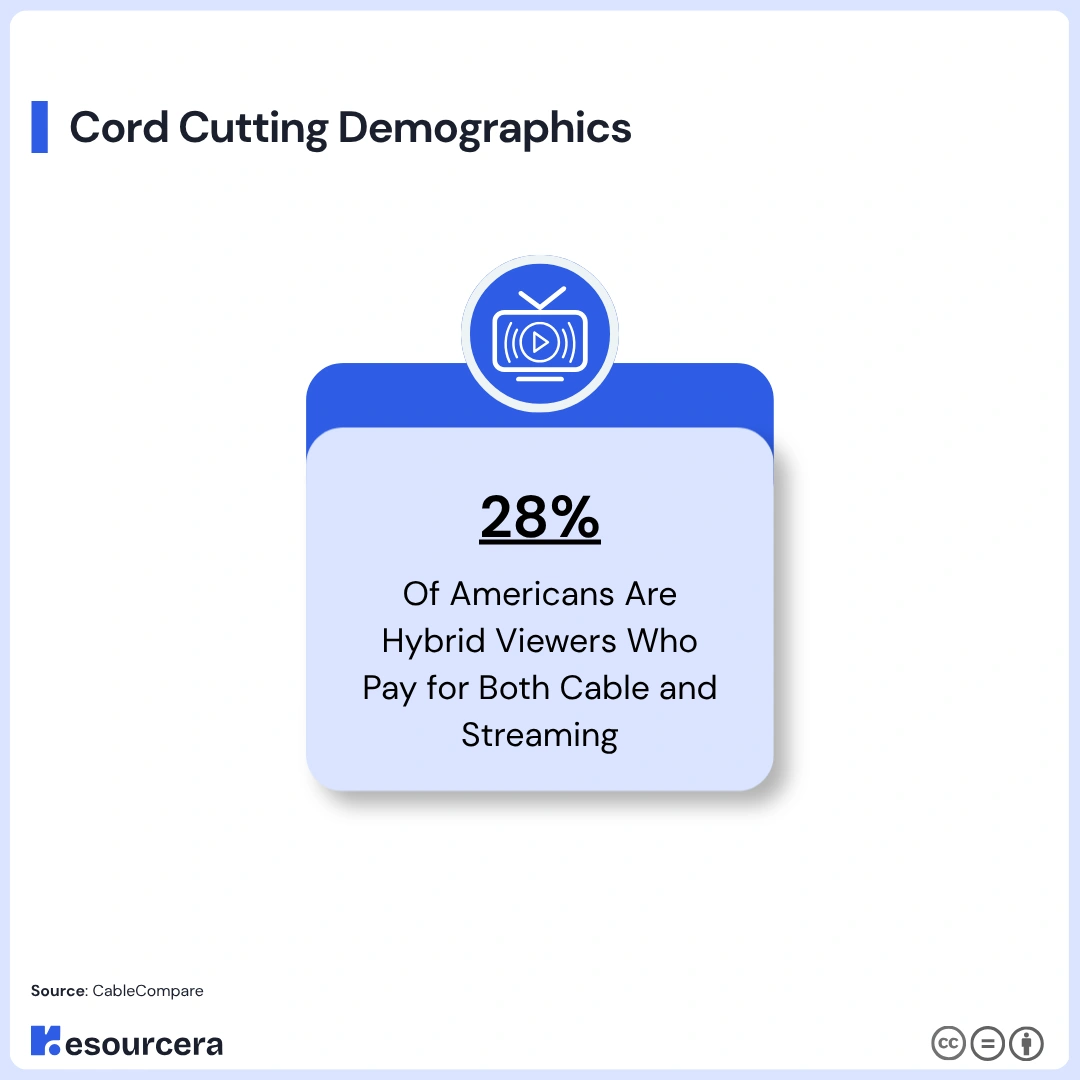
28% of US adults subscribe to cable or satellite while also using streaming services, making the hybrid household one of the largest single viewing segments in the country.
These are the households the industry is fighting over. For streamers, they represent finished conversions waiting to happen; for cable operators, they are the subscribers most likely to notice, at renewal, that everything they watch already lives inside their streaming apps.
Source: CableCompare
About One In Three Non-Subscribers Has Never Paid For TV At All
Roughly 34% of Americans without a pay-TV service have never subscribed to one in their life, making cord-nevers about the same size as recent cord cutters (31% cancelled within the past three years) and long-ago cutters (35% cancelled more than three years ago).
Cord-nevers matter because they are not a churn problem the industry can win back; they are a customer base it never acquired. As streaming-native generations form new households, this segment only compounds.
Source: TV Tech
Streaming Subscription Statistics (User Behaviour)
Streaming has become the main alternative to traditional pay TV. The global OTT user base is projected to reach 4.33 billion in 2026, showing how widely streaming services are now used worldwide. See our complete OTT subscriber statistics for platform and country-level data.
90% Of US Households Now Have At Least One Paid Streaming Service
90% of American households pay for at least one subscription video-on-demand service as of early 2026.
Streaming is no longer the alternative; it is the default. For comparison, only 52% of households had a subscription to Netflix, Amazon Prime, or Hulu in 2015, meaning penetration has climbed almost 40 points in a decade while cable’s has fallen 40.
Source: Deloitte Digital Media Trends 2026, Leichtman Research Group
68% Of Streaming Subscribers Now Take At Least One Ad-Supported Plan
68% of SVOD-subscribing households have at least one ad-supported streaming service as of March 2026, up sharply from 54% a year earlier and 46% in 2024.
The ad tier has become the industry’s main growth engine, not its budget afterthought. Cord cutters who left cable to escape both the price and the adverts are increasingly accepting the adverts back to keep the price down.
Source: Deloitte Digital Media Trends 2026
Around 40% of Streaming Subscribers Cancel At Least One Service Per Year
The annual churn rate across streaming video services holds at roughly 40%, stable year over year.
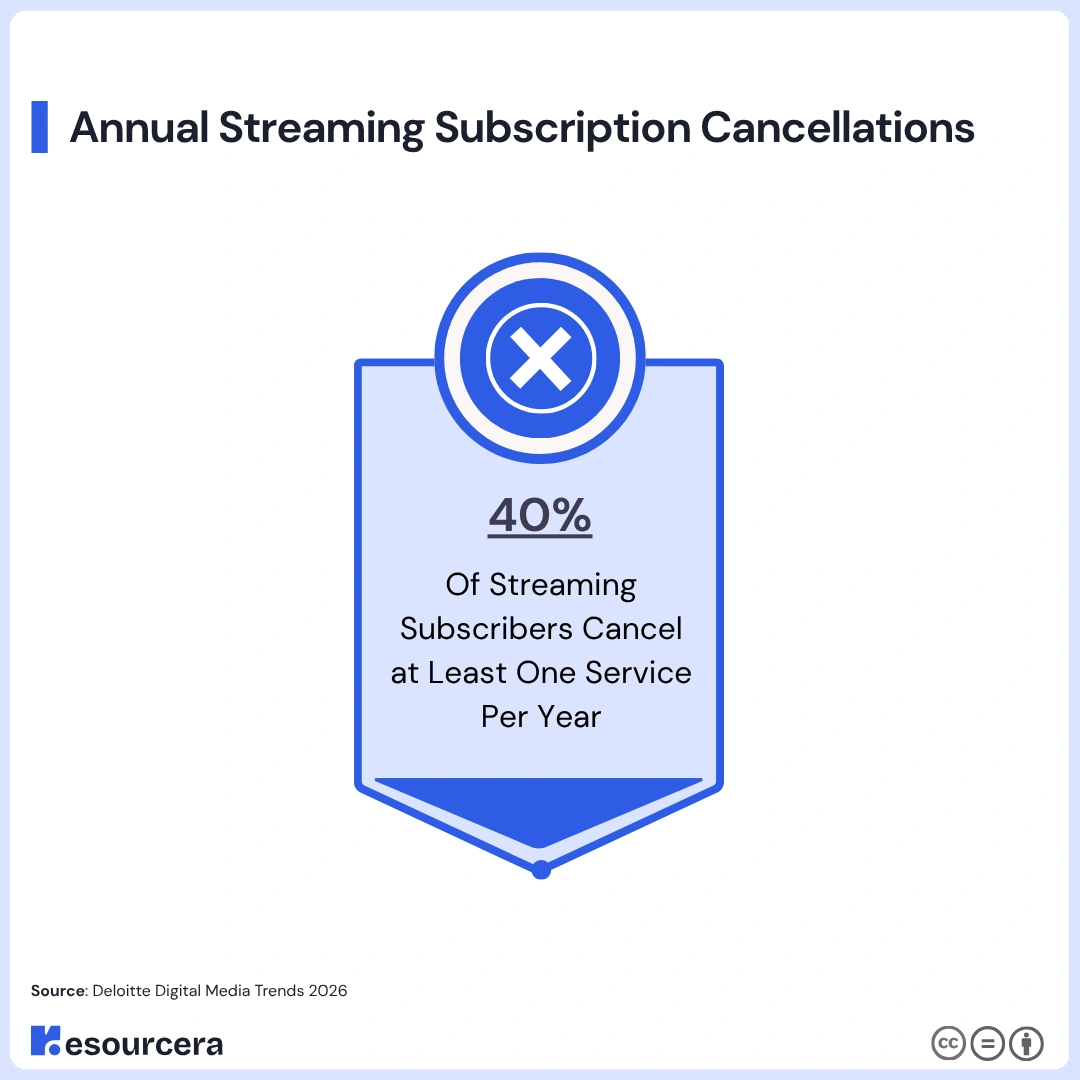
Cord-cutting behaviour has not stopped at cable, Subscribers now rotate services around must-watch shows and sports seasons, cancelling and returning at will. About a quarter of Americans churn and return to the same streaming service within a year, and the figure rises to roughly 40% among Gen Z.
Source: Deloitte Digital Media Trends 2026
The Impact Of Cord Cutting On Providers
Comcast Has Lost Roughly 11.9 Million Cable TV Subscribers Since 2014
Comcast ended Q2 2026 with 10.67 million residential video customers, down from 22.6 million in 2014.
The formula: 22.6 million (2014) – 10.67 million (Q2 2026) = 11.93 million subscribers lost, more than half its video base. Comcast shed another 280,000 video customers in Q2 2026 alone, and its video revenue fell 7.8% year over year to $6.1 billion. The company’s response has been to build the other side of the trade: its Peacock streaming service reached 48 million subscribers and posted its first-ever profitable quarter in the same earnings report.
Source: Comcast Q2 2026 Results.
Cable Operators Now Earn Their Money From Broadband, Not Television
Top US cable providers held a 62.5% share of the American broadband market at the end of Q3 2025, even as their television businesses shrink.
This is the quiet irony of cord cutting: most households cancel cable TV and then stream over an internet connection sold to them by the same cable company. The pipe survived the bundle. Comcast’s own strategy now centres on broadband, wireless (a record 448,000 line additions in Q2 2026), and Peacock rather than defending linear TV.
Source: Leichtman Research Group, Comcast Q2 2026 Results
Conclusion: 80 Million Cord-Cutting Households And A Majority That Is Not Coming Back
Cord cutting in 2026 is no longer a trend to watch; it is the settled state of American television. An estimated 80.7 million US households will have cut the cord by the end of the year, only 36% of adults still pay for cable or satellite, and streaming’s 47.6% share of TV viewing now exceeds cable and broadcast combined.
The forces behind it have not changed since the first wave: a $147 average cable bill against a $70 streaming stack, and a generation in which just 16% of 18 to 29 year olds have ever seen the point of the bundle. What has changed is where the fight moved. With 90% of households streaming and annual churn running at 40%, the cancel-anytime instinct that killed cable is now the streaming industry’s own biggest problem.
Cable will keep a base of sports fans, older viewers, and bundled broadband customers for years. But with YouTube TV as America’s largest pay-TV provider and Comcast earning its first streaming profit in the same quarter it lost another 280,000 cable customers, every side of the industry has already voted on how this ends.