
Meta, formerly known as Facebook, earns most of its revenue from digital advertising. In 2025, advertising generated $196.18 billion, equal to approximately 97.6% of the Meta’s total revenue.
Meta reported total revenue of $200.97 billion in 2025, an increase of 22.2% from the previous year.
From digital advertising and Reality Labs to Facebook, Instagram, WhatsApp, and Messenger, Meta has expanded its portfolio and continued to grow.
Meta does not currently disclose standalone revenue for the Facebook application. Therefore, the latest official financial figures in this article refer to Meta companywide unless otherwise stated.
To learn more about Meta’s revenue, let’s dive into the details.
Meta Revenue in 2026: Key Highlights
- Meta generated $200.97 billion in total revenue in 2025, up 22.2% from $164.50 billion in 2024.
- Advertising generated $196.18 billion in 2025 and accounted for approximately 97.6% of Meta’s total revenue.
- Meta’s Family of Apps generated $198.76 billion in 2025, while Reality Labs generated $2.21 billion.
- Meta reported net income of $60.46 billion in 2025, down approximately 3.1% from 2024.
- In the first quarter of 2026, Meta generated $56.31 billion in total revenue, including $55.02 billion from advertising.
- Meta’s annual revenue increased by approximately 1,512% between 2014 and 2025.
- Based on the 2024 regional estimates listed below, the U.S. and Canada contributed approximately 43.8% of Meta’s total revenue.
Meta Revenue in 2026
The latest complete annual results show that Meta generated $200.97 billion in revenue in 2025, up 22.2% from $164.50 billion in 2024.
Meta also generated $56.31 billion in the first quarter of 2026, up 33% year over year, providing the latest available indication of its revenue growth.
The company’s revenue is supported by its Family of Apps, which includes Facebook, WhatsApp, Messenger, and Instagram, as well as Reality Labs.
Meta does not publish a regularly updated standalone revenue or advertiser count for the Facebook application, so the table below uses the company’s official consolidated revenue.
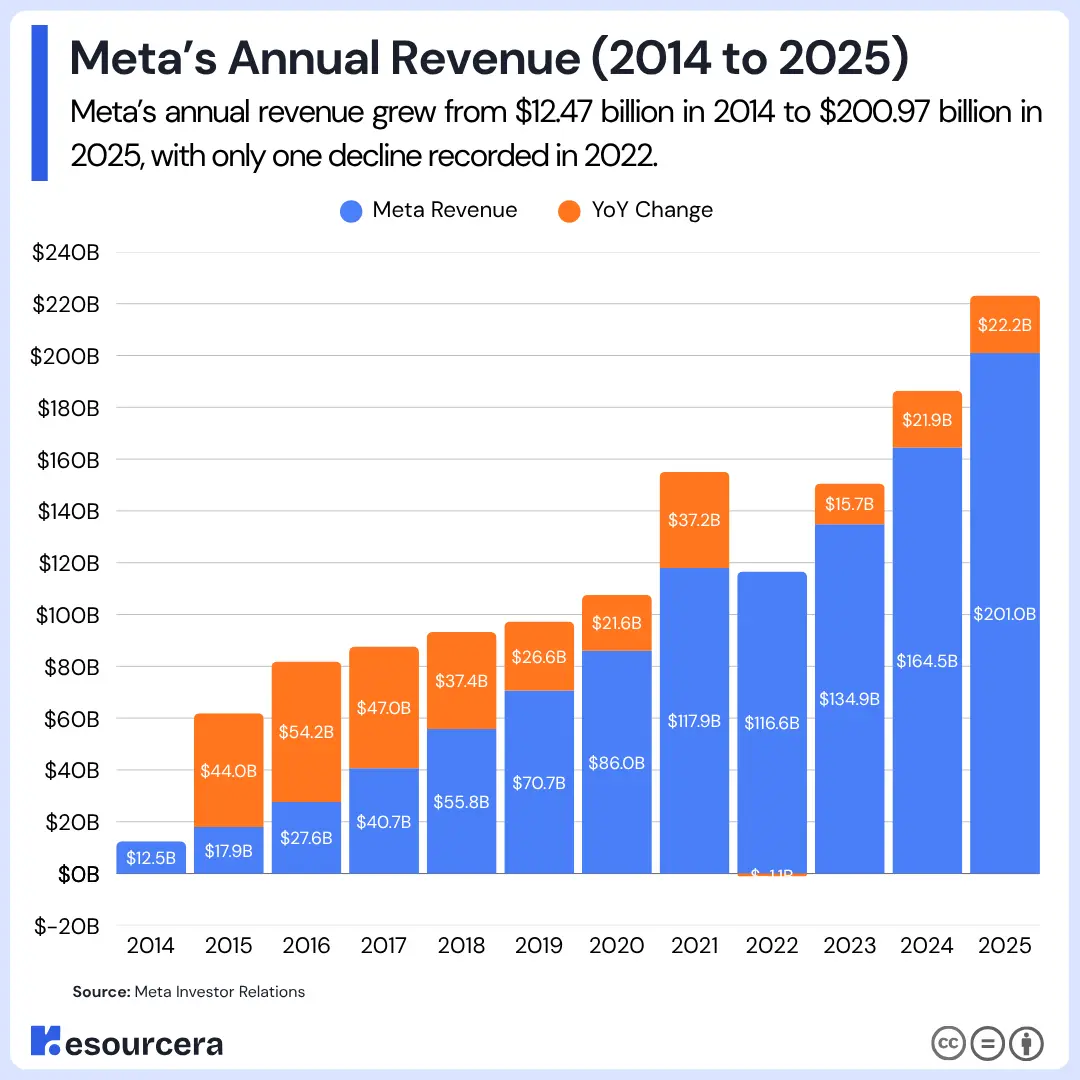
Below is the complete breakdown of Meta’s annual revenue.
| Year | Meta Revenue |
|---|---|
| 2014 | $12.466 billion |
| 2015 | $17.928 billion |
| 2016 | $27.638 billion |
| 2017 | $40.653 billion |
| 2018 | $55.838 billion |
| 2019 | $70.697 billion |
| 2020 | $85.965 billion |
| 2021 | $117.929 billion |
| 2022 | $116.609 billion |
| 2023 | $134.902 billion |
| 2024 | $164.501 billion |
| 2025 | $201 billion |
Meta Revenue by Segment
Meta reports revenue across two business segments: Family of Apps and Reality Labs. Family of Apps includes Facebook, Instagram, Messenger, WhatsApp, and other services.
| Segment | 2024 Revenue | 2025 Revenue | Year-over-Year Change |
|---|---|---|---|
| Family of Apps | $162.36 billion | $198.76 billion | +22.4% |
| Reality Labs | $2.15 billion | $2.21 billion | +2.8% |
| Total | $164.50 billion | $200.97 billion | +22.2% |
Source: Meta Investor Relations, Instagram Revenue, WhatsApp Revenue
Meta Revenue by Region
Based on the latest figures available in the cited regional dataset, the U.S. and Canada were Meta’s largest revenue region, generating approximately $72 billion in 2024.
Europe was the second-largest region, generating approximately $38.7 billion in 2024.
The table below provides a historical regional breakdown through 2024.
| Year | U.S. and Canada | Europe | Asia Pacific | Rest of World |
|---|---|---|---|---|
| 2015 | $7.2 billion | $3.4 billion | $2.3 billion | $1.5 billion |
| 2016 | $12.9 billion | $6.2 billion | $4 billion | $2.4 billion |
| 2017 | $19.4 billion | $9.7 billion | $6.7 billion | $4 billion |
| 2018 | $26.4 billion | $13.5 billion | $9.5 billion | $5.4 billion |
| 2019 | $33.4 billion | $16.7 billion | $12.5 billion | $6.8 billion |
| 2020 | $40.5 billion | $20.4 billion | $15.4 billion | $7.6 billion |
| 2021 | $51.5 billion | $29 billion | $26.7 billion | $10.5 billion |
| 2022 | $54.5 billion | $25.7 billion | $23.4 billion | $12.7 billion |
| 2023 | $61.2 billion | $30.8 billion | $26.9 billion | $15.8 billion |
| 2024 | $72 billion | $38.7 billion | $32.8 billion | $20.8 billion |
Source: Business of Apps
Meta Advertising Revenue
Meta generated $196.18 billion in advertising revenue in 2025, an increase of approximately 22.1% from $160.63 billion in 2024.
Advertising accounted for approximately 97.6% of Meta’s total revenue in 2025. In the first quarter of 2026 alone, advertising revenue reached $55.02 billion.
Meta also reported that ad impressions increased by 19% and the average price per ad increased by 12% in the first quarter of 2026.
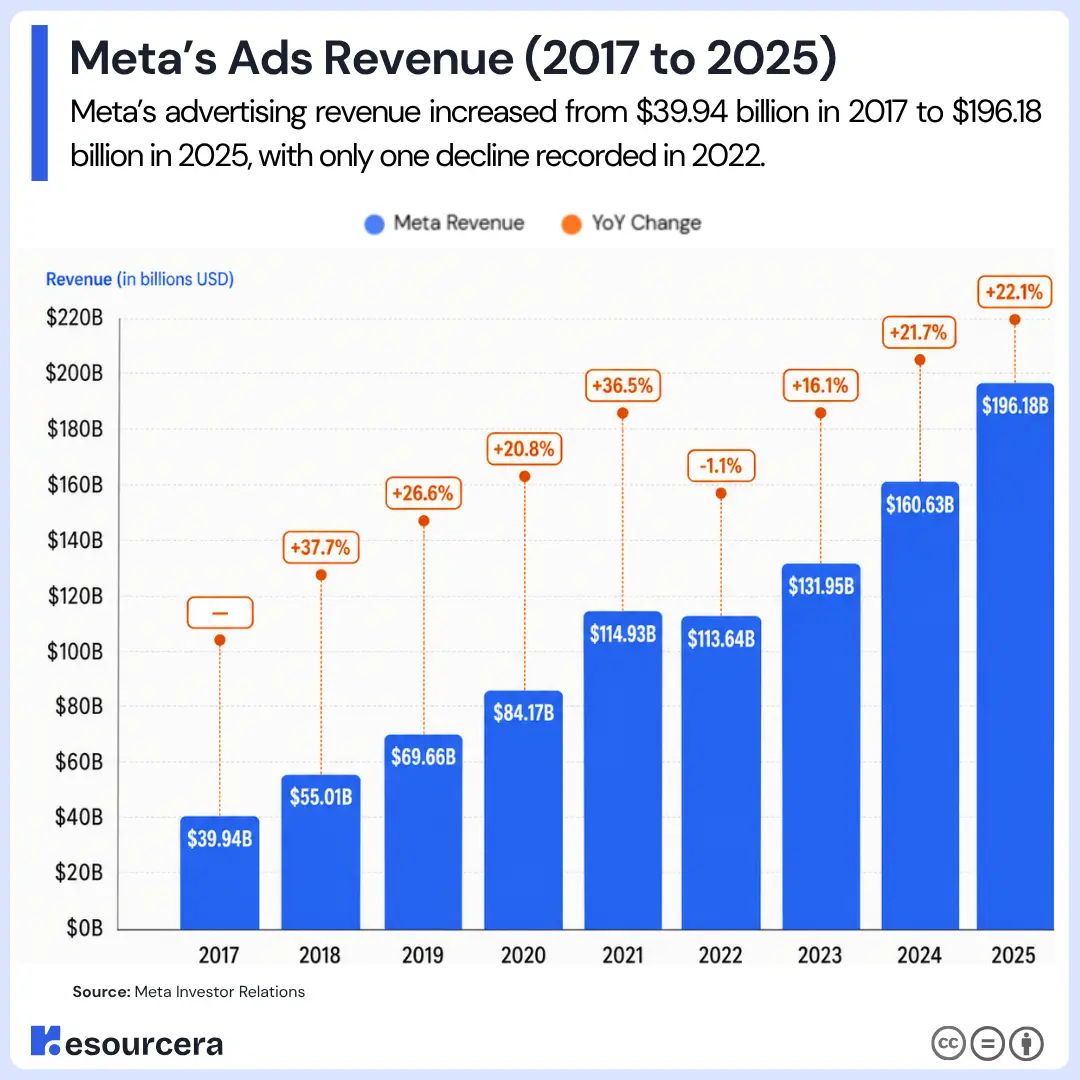
The following table shows Meta’s reported advertising revenue from 2017 to 2025.
| Year | Meta Advertising Revenue | Year-over-Year Change |
|---|---|---|
| 2017 | $39.94 billion | – |
| 2018 | $55.01 billion | +37.7% |
| 2019 | $69.66 billion | +26.6% |
| 2020 | $84.17 billion | +20.8% |
| 2021 | $114.93 billion | +36.5% |
| 2022 | $113.64 billion | -1.1% |
| 2023 | $131.95 billion | +16.1% |
| 2024 | $160.63 billion | +21.7% |
| 2025 | $196.18 billion | +22.1% |
Source: Meta FY2025 Results, Meta Q1 2026 Results
Facebook In-App Purchases
Facebook supports purchases through games and other digital experiences. However, Meta does not disclose a standalone Facebook or Messenger in-app purchase revenue figure in its current financial reports.
Revenue from these activities is included within broader company revenue categories, which means it cannot be reliably separated from Meta’s other non-advertising revenue.
Source: Meta Investor Relations
Revenue Generated Through Reality Labs
Meta’s Reality Labs division includes augmented-reality and virtual-reality products. The segment generated $2.21 billion in revenue in 2025, up approximately 2.8% from 2024.
| Year | Revenue Generated by Meta’s Reality Labs |
|---|---|
| 2019 | $501 million |
| 2020 | $1,139 million |
| 2021 | $2,274 million |
| 2022 | $2,159 million |
| 2023 | $1,896 million |
| 2024 | $2,146 million |
| 2025 | $2,207 million |
Source: Meta Investor Relations
Reality Labs generated $1.08 billion in revenue in the fourth quarter of 2024 and reported an operating loss of $4.97 billion. Its full-year operating loss increased to $19.19 billion in 2025. In the first quarter of 2026, the segment generated $402 million in revenue and recorded an operating loss of $4.03 billion.
Net Profit Generated by Meta
Advertising revenue remains the main driver of Meta’s profitability.
Meta generated net income of $60.46 billion in 2025, compared with $62.36 billion in 2024.
The table below shows Meta’s net income over the years.
| Year | Meta Net Income |
|---|---|
| 2010 | $0.61 billion |
| 2011 | $1.00 billion |
| 2012 | $0.05 billion |
| 2013 | $1.50 billion |
| 2014 | $2.94 billion |
| 2015 | $3.69 billion |
| 2016 | $10.22 billion |
| 2017 | $15.93 billion |
| 2018 | $22.11 billion |
| 2019 | $18.49 billion |
| 2020 | $29.15 billion |
| 2021 | $39.37 billion |
| 2022 | $23.20 billion |
| 2023 | $39.10 billion |
| 2024 | $62.36 billion |
| 2025 | $60.46 billion |
Meta’s net income increased by approximately 59.5% between 2023 and 2024. It then declined by approximately 3.1% to $60.46 billion in 2025. In the first quarter of 2026, Meta reported net income of $26.77 billion.