More than 5.7 billion people are actively using social media in 2026, accounting for 94.4% of global internet users. This number is projected to surpass 6 billion by 2028.
Social media is no longer just a platform for connection. It has become the default layer of the internet where attention is captured, opinions are shaped, and decisions are influenced. For many users, it replaces traditional search, news platforms, and even entertainment channels.
The way people use social media is also changing fast. Short-form video is dominating attention spans, messaging apps are turning into business tools, and creators are becoming key drivers of commerce. At the same time, usage patterns vary widely across regions, age groups, and platforms.
This is exactly why tracking global social media usage matters. It helps businesses understand where attention is moving, helps creators identify opportunities, and gives a clear view of how billions of people interact online today.
In this report, you’ll find data-backed insights on global adoption, time spent, platform-wise growth, audience demographics, and engagement trends across the world.
Highlights Social Media Usage Statistics (2026)
- As of 2026, there are 5.6 billion active social media users globally.
- 94.4% of global internet users access one or more social media platforms.
- An average social media user spends around 148 minutes daily on different social media platforms, which equals 2 hours and 28 minutes.
- Facebook, with 3.07 billion MAUs, and Instagram and WhatsApp, with 3 billion MAUs each, are the most widely used social media platforms.
- 77% of marketers use Facebook and Instagram for retargeting, making it the most popular platform for digital advertising.
- Adults aged 18 to 29 years are the most active social media users.
- Around 201 million people worldwide are affected by social media addiction.
How Many People Use Social Media Globally
In 2026, there are 5.6 billion social media users worldwide, accounting for about 69.6% of the global population, and the number is estimated to surpass the 6 billion mark by 2028.
This highlights the massive reach and relevance of social media platforms in shaping communication, entertainment, marketing, and information sharing across the world.
In fact, around 94.4% of the world’s internet users use social media every month, making it an essential part of their daily online activities.
On average, each person uses around 6 to 8 social media platforms every month, including apps such as Instagram, Facebook, TikTok, and YouTube, to stay connected, keep up with trends, and enjoy various types of content.

Here is a table showing the growth of social media users globally over the years:
| Year | Social Media Users | Y-O-Y growth |
|---|---|---|
| 2015 | 2.20 billion | – |
| 2016 | 2.30 billion | 4.54% |
| 2017 | 2.73 billion | 17.4% |
| 2018 | 3.10 billion | 13.55% |
| 2019 | 3.51 billion | 13.23% |
| 2020 | 3.91 billion | 11.39% |
| 2021 | 4.26 billion | 8.95% |
| 2022 | 4.59 billion | 7.75% |
| 2023 | 4.90 billion | 6.75% |
| 2024 | 5.17 billion | 5.51% |
| 2025 | 5.42 billion | 4.83% |
| 2026 | 5.60 billion | 2.58% |
| 2027* | 5.83 billion | 2.30% |
| 2028* | 6.05 billion | 2.09% |
By 2028, the global social media users are expected to reach 6.05 billion, growing at an annual rate of 8.42%.
Social Media Usage by Country
Social media usage varies across different countries due to the differences in population size, internet access, cultural habits, and digital adoption.
China and India dominate global social media usage, with China projected to reach around 1.36 billion users by 2030 and India expected to grow to approximately 1.13 billion users, adding over 252 million new users between 2025 and 2030.
This dominance also reflects the growing influence of the APAC (Asia Pacific) region, as both countries fall within it, while the United States ranks third globally, with about 313 million social media users.
Pakistan and Bangladesh show the fastest growth rates, with Pakistan’s social media users projected to double from 130.3 million in 2025 to 262.83 million in 2030. Bangladesh is expected to grow by over 61 million users during that period.

Here’s a detailed breakdown of social media usage by different countries.
| Country | Number of Users in 2026 | Estimated Number of Users in 2030 |
|---|---|---|
| China | 1,195.0 million | 1,361.94 million |
| India | 890.0 million | 1,127.08 million |
| United States | 315.0 million | 328.91 million |
| Indonesia | 207.5 million | 235.58 million |
| Brazil | 163.2 million | 181.39 million |
| Russia | 133.1 million | 138.3 million |
| Pakistan | 137.0 million | 262.83 million |
| Philippines | 116.0 million | 123.88 million |
| Mexico | 116.1 million | 127.56 million |
| Japan | 104.6 million | 107.84 million |
| Vietnam | 93.0 million | 99.75 million |
| Nigeria | 89.1 million | 103.47 million |
| Egypt | 86.9 million | 98.74 million |
| Bangladesh | 88.0 million | 143.38 million |
| Turkey | 79.4 million | 84.4 million |
| Germany | 70.1 million | 71.96 million |
| Thailand | 68.3 million | 68.16 million |
| Iran | 64.2 million | 71.42 million |
| United Kingdom | 59.1 million | 61.71 million |
| France | 56.2 million | 58.96 million |
Source: Statista
Social media adoption closely mirrors digital and cellular network penetration across different countries, where the global social media penetration rate is around 63%.
China has about 1.1 billion social media users out of a population of 1.4 billion, while India has around 800 million users despite having a similar population size. This clearly shows China has better digital penetration than India.

Below is the complete breakdown of the social media penetration rate across different countries.
| Region/ Country | Penetration Rate |
|---|---|
| Saudi Arabia | 111.2% |
| UAE | 109.7% |
| South Korea | 95.4% |
| Singapore | 90.6% |
| China | 90.3% |
| Malaysia | 85% |
| Hong Kong | 84.4% |
| Netherlands | 83.3% |
| Canada | 82.1% |
| Philippines | 81.9% |
| Chile | 81.7% |
| Peru | 81.6% |
| Spain | 81.4% |
| Switzerland | 81% |
| New Zealand | 80.6% |
Source: Statista
While the global social media penetration rate is 63%, countries like Saudi Arabia and the UAE exceed this level with 111.2% and 109.7%, indicating multiple social media accounts per user.
Social Media Usage by Demographics
Social media adoption and engagement differ significantly across demographic groups, reflecting differences in user needs, behavior, and content preferences.
Social Media Users by Age
Younger adults aged 18 to 29 years have the highest overall engagement across different platforms, especially on Instagram, TikTok, Snapchat, and Reddit.
YouTube leads across all age groups, with usage peaking at 95% among ages 18 to 29 years. Facebook shows a strong appeal among middle-aged and older adults.

The table below showcases the use of different social media platforms across different age groups.
| Platform | Ages 18-29 | Ages 30-49 | Ages 50-64 | Ages 65+ |
|---|---|---|---|---|
| YouTube | 95% | 92% | 85% | 64% |
| 68% | 80% | 74% | 57% | |
| 80% | 62% | 40% | 19% | |
| TikTok | 63% | 44% | 30% | 12% |
| 37% | 40% | 30% | 20% | |
| 48% | 35% | 16% | 6% | |
| Snapchat | 58% | 31% | 13% | 4% |
| Twitter (X) | 33% | 25% | 16% | 10% |
| Threads | 15% | 10% | 6% | 3% |
| Bluesky | 6% | 5% | 3% | 2% |
| Truth Social | 1% | 3% | 5% | 4% |
Source: Pew Research Center
Social Media Users by Gender
Men represent a slightly larger share of social media users, accounting for 54.6% of the total global audience, while women comprise 45.4%, indicating a modest gender gap at the global level.
In the United States, social media usage is almost evenly split by gender, with women slightly ahead at 50.2% and men at 49.8%.
This highlights how gender distribution on social media varies by region, digital access, cultural norms, and technology adoption.

The following is the global gender breakdown of social media users.
| Platform | Male Users | Female Users |
|---|---|---|
| 52.7% | 47.3% | |
| Snapchat | 50.7% | 48.4% |
| TikTok | 55.7% | 44.3% |
| 56.7% | 43.3% | |
| 56.9% | 43.1% | |
| Twitter (X) | 63.7% | 36.3% |
Social Media Users by Ethnicity
White users show strong adoption of mainstream platforms, with YouTube leading at 82%, followed by Facebook at 70% and Instagram at 45%.
Hispanic users lead in short-form video engagement, with the highest TikTok adoption accounting for 57% among all the racial groups.
Asian users have the highest engagement, i.e., around 44%, with discussion-based platforms such as Reddit.
Here’s a detailed overview of social media users by ethnicity.
| Platforms | White | Black | Hispanic | Asian |
|---|---|---|---|---|
| YouTube | 82% | 85% | 88% | 92% |
| 70% | 74% | 74% | 62% | |
| 45% | 54% | 62% | 58% | |
| TikTok | 28% | 53% | 57% | 31% |
| 23% | 37% | 56% | 54% | |
| 27% | 18% | 22% | 44% | |
| Snapchat | 24% | 29% | 31% | 19% |
| Twitter (X) | 18% | 26% | 23% | 32% |
Source: Pew Research Center
Social Media Users by Education
As per the report from the National Library of Medicine, around 41.5% of the students use social media up to 3 hours per day, where 73.5% used it to read health-related news, 71.5% used it to complete assignments, and around 50% of them used it for research-related purposes and test or seminar preparations.
YouTube dominates across all education levels, rising from 78% among high school students to 89% for college graduates.
Reddit, X (formerly Twitter), and other discussion-focused platforms attract more educated users, highlighting a correlation between education and engagement in news, forums, and niche communities.
Bluesky users rises with education levels, growing from 2% among high school users to 6% among college graduates, reflecting its appeal among more educated and tech-savvy audiences.
| Platforms | High School or less | Some College | College Graduate |
|---|---|---|---|
| YouTube | 78% | 87% | 89% |
| 69% | 73% | 71% | |
| 41% | 53% | 58% | |
| TikTok | 40% | 42% | 29% |
| 27% | 29% | 41% | |
| 15% | 28% | 37% | |
| Snapchat | 24% | 29% | 24% |
| X (formerly Twitter) | 16% | 23% | 24% |
| Threads | 7% | 9% | 9% |
| Bluesky | 2% | 4% | 6% |
| Truth Social | 3% | 5% | 3% |
Platform-Specific Usage Statistics
According to Resourcera’s analysis, global social media usage is increasingly concentrated around a few dominant platforms that reach billions of users every month, where Facebook, Instagram, and WhatsApp continue to lead the global social media landscape.
Video-driven platforms like YouTube and TikTok follow closely, reflecting the growing preference for visual and short-form content.
Most Used Social Media Platforms
Facebook, Instagram, and WhatsApp each exceed 3 billion monthly active users, with Facebook leading at 3.07 billion, followed by Instagram and WhatsApp with 3 billion monthly active users, making them the most widely used platforms.

YouTube and TikTok together reach over 4.5 billion users, underlining the shift towards video-first consumption.
| Platforms | Monthly Active Users |
|---|---|
| 3.07 billion | |
| 3 billion | |
| 3 billion | |
| YouTube | 2.58 billion |
| TikTok | 1.99 billion |
| 1.41 billion | |
| Telegram | 1 billion |
| Messenger | 942 million |
| Snapchat | 932 million |
| 765 million |
Source: Datareportal
The table below highlights how social media overlaps across major platforms, showing that most users are active on multiple networks rather than just one.
| Platforms Users | Unique to Platform | Using YouTube | Using Facebook | Using WhatsApp | Using Instagram | Using TikTok | Using Telegram |
|---|---|---|---|---|---|---|---|
| YouTube users | 1.2% | 100% | 75.7% | 72.5% | 77.4% | 48.4% | 48% |
| Facebook Users | 0.6% | 73.4% | 100% | 75.1% | 78.6% | 53.9% | 46.6% |
| WhatsApp Users | 1.0% | 74.0% | 77.3% | 100% | 78.9% | 50.4% | 52.6% |
| Instagram Users | 0.1% | 76.8% | 80.5% | 78.4% | 100% | 54.5% | 50.6% |
| TikTok Users | 0.2% | 76.4% | 81.8% | 74.2% | 80.9% | 100% | 51.3% |
| Telegram Users | 0.2% | 79.8% | 78.5% | 86.1% | 83.3% | 57% | 100% |
Source: Datareportal
Across all the platforms, only 0.1% to 1.2% users are unique, showing that most of the people actively use multiple social media apps.
Over 70% of the users on YouTube, Facebook, Instagram, and WhatsApp use one or more of the other platforms, reflecting the highly interconnected nature of the social media ecosystem.
Time Spent on Social Media
Social media usage has grown drastically over the past 13 years, increasing from about 90 minutes per day in 2012 to 141 minutes in 2025, an increase of roughly 4 minutes per year.
On average, people spend approximately 141 minutes per day on social media, which equals around 2 hours and 21 minutes of scrolling, messaging, and exploring content.

The highest average daily usage was observed in 2023 at 151 minutes, before slightly declining to 143 minutes in 2024 and 141 minutes in 2025.
| Year | Average time spent on social media per day |
|---|---|
| 2012 | 90 minutes |
| 2013 | 95 minutes |
| 2014 | 104 minutes |
| 2015 | 111 minutes |
| 2016 | 128 minutes |
| 2017 | 134 minutes |
| 2018 | 142 minutes |
| 2019 | 145 minutes |
| 2020 | 145 minutes |
| 2021 | 145 minutes |
| 2022 | 147 minutes |
| 2023 | 151 minutes |
| 2024 | 143 minutes |
| 2025 | 141 minutes |
| 2026 | 148 minutes |
Source: Statista 2

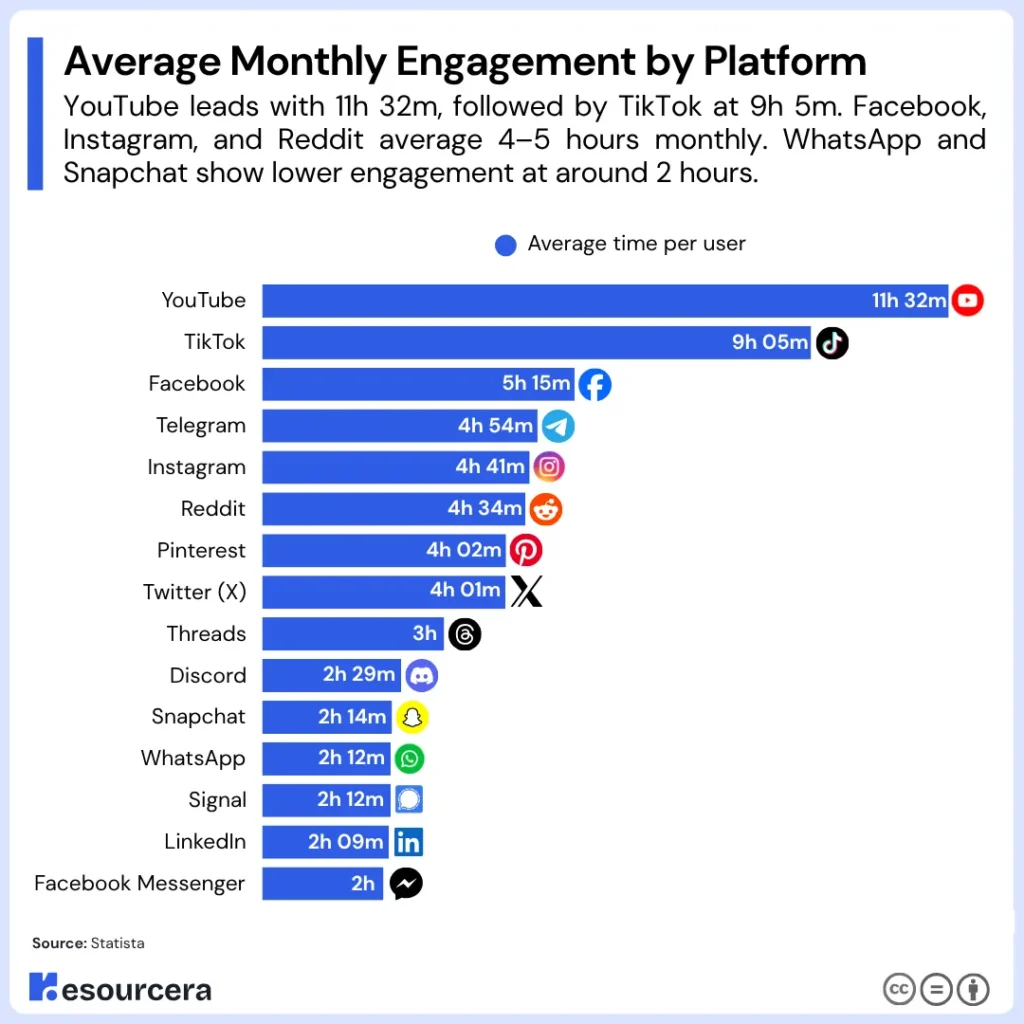
The table below represents leading social media platforms by average monthly user engagement.
| Social Media Platforms | Average time per user |
|---|---|
| YouTube | 11 hours and 32 minutes |
| TikTok | 9 hours and 5 minutes |
| 5 hours and 15 minutes | |
| Telegram | 4 hours and 54 minutes |
| 4 hours and 41 minutes | |
| 4 hours and 34 minutes | |
| 4 hours and 2 minutes | |
| Twitter (X) | 4 hours and 1 minute |
| Threads | 3 hours |
| Discord | 2 hours and 29 minutes |
| Snapchat | 2 hours and 14 minutes |
| 2 hours and 12 minutes | |
| Signal | 2 hours and 12 minutes |
| 2 hours and 9 minutes | |
| Facebook Messenger | 2 hours |
Source: Statista
Social Media Growth Rate
TikTok leads with the highest growth rate, i.e., 17.6% Y-O-Y growth, representing rapid user adoption and strong engagement among all the platforms.
Facebook, Snapchat, and Pinterest show moderate growth, reflecting platform maturity. This shows that these platforms have long-term stability rather than decline.
The table below highlights the year-over-year growth rate across major social media platforms.
| Social Media Platforms | Y-O-Y Growth | Growth Status |
|---|---|---|
| TikTok | 17.6% | Highest Growth |
| 14.9% | Strong Growth | |
| 13.1% | Strong Growth | |
| 5.7% | Moderate Growth | |
| Snapchat | 4.5% | Moderate Growth |
| 3.8% | Moderate Growth | |
| YouTube | 2.1% | Low Growth |
| Twitter (X) | -5.5% | Decline |
Source: Statista
Social Media Usage for Business
Among various business applications of social media, advertising and marketing remain one of the most widely adopted and impactful uses.
Use of Social Media for Advertising
The United States leads global advertising spend per capita at $1,246 per person, followed by the United Kingdom with $876 per person spent across online and offline channels.

Below are the top 10 countries with the highest social media advertising spending.
| Country | Average Advertising Spend Per Capital |
|---|---|
| United States | $1,246 |
| United Kingdom | $876 |
| Australia | $745 |
| Germany | $656 |
| Sweden | $643 |
| Canada | $608 |
| Denmark | $596 |
| Switzerland | $510 |
| Hong kong | $506 |
| Netherlands | $503 |
The social media advertising expenditures are expected to grow by 5.63%, with total spending expected to reach $76.4 billion.
Around 77% of marketers use retargeting through Facebook and Instagram, making it one of the most popular channels overall.
Email retargeting is used by 55% of marketers, which is higher than Twitter, LinkedIn, and lead generation tools.
Below is the complete breakdown of retargeting usage by marketing strategy.
| Marketing Strategy | Share of Respondents using Retargeting |
|---|---|
| Facebook/Instagram Advertising | 77% |
| Google Advertising | 69% |
| 55% | |
| Twitter Advertising | 44% |
| LinkedIn Advertising | 35% |
| Lead Generation | 31% |
| Other Paid Advertising Channels | 28% |
| SEO | 24% |
| Account-Based Marketing | 9% |
In the United States, Social media advertising is largely driven by mobile devices. The spending on social media ads is expected to reach $82.69 billion, reflecting how heavily users rely on smartphones and how well ads perform on mobile platforms.
Meanwhile, desktop social media ad spending is projected to be much lower at $13.01 billion, reflecting a continued shift away from desktop use towards mobile-first social media consumption.
Use of Social Media for Marketing
Facebook, with 83%, leads as the most widely used platform among marketers, followed by Instagram with 78%, reflecting its high engagement rate and popularity of formats like reels and stories.
The data below reflects the share of marketers using different social media platforms for the purpose of marketing.
| Social Media Platform | Share of marketers using the platform |
|---|---|
| 83% | |
| 78% | |
| 69% | |
| YouTube | 53% |
| Twitter (X) | 27% |
| TikTok | 26% |
| Threads | 12% |
Source: Statista
Psychological and Behavioral Impact of Social Media
About 210 million people around the globe are addicted to social media. Social media addiction is not only about how long people use social media, but it’s also about how often they use it, and that use affects their behavior and well-being.
Many users engage with the platform automatically, rather than intentionally, making habitual checking a common behavior.
About 72% of people open social media within the first 10 minutes of waking up, and half of the users revisit their accounts several times every hour.
This dependency is especially evident among younger users, where nearly 30% of people feel anxious or restless when they are not able to access social media.
Heavy use of social media can negatively affect mental health, causing anxiety and depression.
Around 25.5% of social media users report feeling more irritable or easily angered, while 26.1% users experienced sleep disturbances due to late-night scrolling or constant notifications.
Why People Use Social Media: Key Drivers
According to the report from the BBC, more than half of the people, i.e., 54%, rely on social media platforms such as Facebook, X, and YouTube for news, surpassing television at 50% and news websites and apps at 48%.
Social media is widely used for connection, entertainment, and information, while shopping and professional purposes play a secondary role.

Around 50.2% of users use social media to stay in touch with family and friends, while 39.7% of users use it as a go-to source of quick entertainment.
| Use of Social Media | Percentage |
|---|---|
| Staying connected with family and friends | 50.2% |
| Filling spare time | 39.7% |
| Reading news and current events | 35.4% |
| Discovering content like articles and videos | 30.3% |
| Keeping up with trending topics and discussions | 28.9% |
| Exploring products to buy | 27.3% |
| Finding ideas and inspiration for activities and purchases | 27.1% |
| Watching or following sports | 23.5% |
| Watching live streams | 23.4% |
| Meeting new people and making connections | 22.8% |
| Following content from favourite brands | 22.7% |
| Sharing and discussing opinions with others | 22.5% |
| Work-related networking or research | 21.5% |
| Following celebrities or social media influencers | 20.4% |
| Avoiding missing out on trends or events (FOMO) | 20.2% |
Source: Data Reportal