



Most businesses spend between $5,000 and $75,000 on a single market research project. A DIY approach can cost nothing. A global, multi-market brand tracking program can pass $500,000 a year.
All three of those numbers are correct, and all three describe completely different jobs.
That range is the reason a straight answer to “how much does market research cost” is close to useless on its own.
Two companies can ask for the same thing, “find out what our customers think,” and walk away with quotes $60,000 apart, because one wants directional feedback from 100 people next week and the other wants a statistically valid read on a niche B2B audience across four countries.
This guide is built to fix that. Instead of handing you a single average and moving on, it walks through what actually drives the price of a research project, method by method and factor by factor, so that by the end you can look at a proposal and know within a reasonable range whether it is fair.
It also includes the math behind sample sizes, two full worked quote breakdowns, a checklist for comparing vendor quotes side by side, and real numbers for cutting cost without cutting data quality.
TLDR;
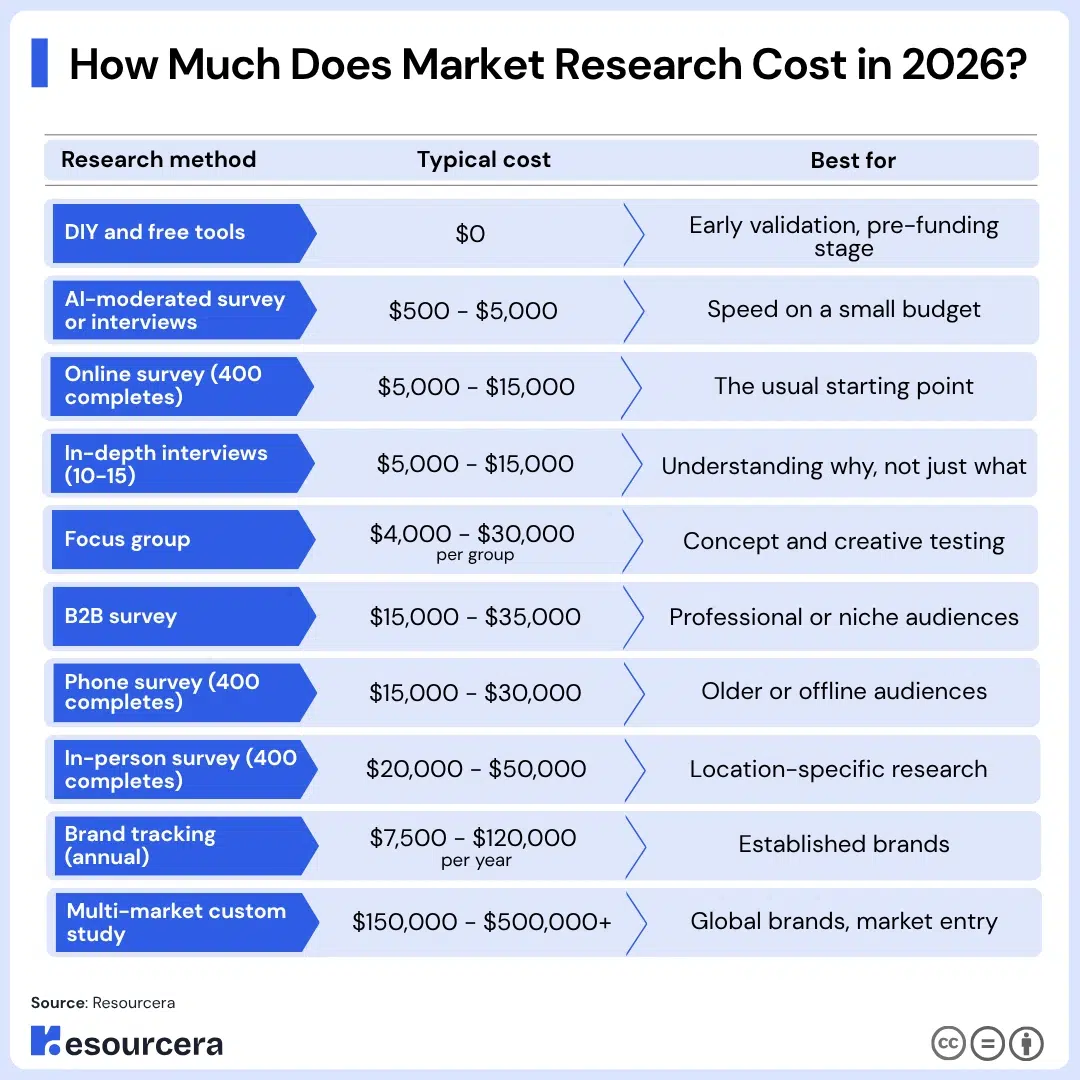
Here is where the most common methods land in 2026, as a starting reference point. Everything after this table explains why.
| Research method | Typical cost | Best for |
|---|---|---|
| DIY and free tools | $0 | Early validation, pre-funding stage |
| AI-moderated survey or interviews | $500 – $5,000 | Speed on a small budget |
| Online survey (400 completes) | $5,000 – $15,000 | The usual starting point |
| In-depth interviews (10-15) | $5,000 – $15,000 | Understanding why, not just what |
| Focus group | $4,000 – $30,000 per group | Concept and creative testing |
| B2B survey | $15,000 – $35,000 | Professional or niche audiences |
| Phone survey (400 completes) | $15,000 – $30,000 | Older or offline audiences |
| In-person survey (400 completes) | $20,000 – $50,000 | Location-specific research |
| Brand tracking (annual) | $7,500 – $120,000 per year | Established brands |
| Multi-market custom study | $150,000 – $500,000+ | Global brands, market entry |
Keep this table as a reference point, not a quote. The rest of this guide will show you exactly why any given project lands where it does inside these ranges.
How Much Does Market Research Cost: Three Cost Tiers
Before anything else, work out which of three tiers your project actually belongs to. Confusing these is the single most common reason people think market research is either shockingly cheap or wildly overpriced. It is usually neither. It is just being compared against the wrong tier.
| Tier | What it covers | Typical spend | Example |
|---|---|---|---|
| Single project | One method, one market, one round of fieldwork | $5,000 – $75,000 | A 400-person online survey to test two product concepts |
| Annual program | Several studies plus some form of ongoing tracking | $23,000 – $120,000+ per year | Quarterly customer satisfaction plus one annual concept test |
| Enterprise program | Multi-market, multi-method, multi-wave | $150,000 – $500,000+ | Brand tracking across four countries plus ad-hoc studies |
A $60,000 quote is expensive for a single project. It is cheap for an annual program. It would be a rounding error inside an enterprise program. The number means nothing until you know which of these three you are buying.
How to Figure Out What Kind of Research You Actually Need
Cost is a downstream effect. It is decided almost entirely by a handful of choices you make before anyone builds a survey or books a facility.
Get these right first, because a mismatched methodology is the most expensive mistake in market research. It costs you money to run, and it still leaves you without the answer you needed.
Secondary research vs. primary research
Secondary research means using data that already exists. Someone else collected it: government agencies, industry associations, academic researchers, published market reports, or your own past sales and customer data. Primary research means collecting new data yourself, built specifically around your question.
Secondary research is almost always cheaper, faster, and the right place to start. It rarely gives you an answer that is perfectly tailored to your business, but it is excellent at telling you what is already known, and at narrowing down which questions are actually worth paying primary research to answer.
Skipping this step is a common way that people accidentally pay for primary research to rediscover something a free government dataset already told them.
Qualitative research vs. quantitative research
These answer different kinds of questions, and mixing them up is where a lot of wasted budget comes from.
| Answers | Why do people feel or behave this way? | How many people feel or behave this way? |
|---|---|---|
| Sample size | Small: typically 6-30 people | Large: typically 200-1,500+ people |
| Format | Interviews, focus groups, ethnography | Surveys, structured questionnaires, polls |
| Output | Themes, quotes, narrative insight | Percentages, statistics, projectable data |
| Cost per person | Higher | Lower |
| Good for | Exploring a new idea, understanding motivation | Validating a decision, sizing an opportunity |
A simple rule: if you do not yet know what to ask, start qualitative. If you already know what to ask and need to know how many people agree, go quantitative. Many well-run projects do both, in that order: a small qualitative round to figure out the right questions, followed by a quantitative survey to validate the answer at scale.
Masked vs. unmasked studies
This is a smaller factor but worth knowing because it affects both data quality and cost. A masked study does not tell participants who is sponsoring it. It is presented as a general industry or community study. An unmasked study tells participants exactly who is asking.
Unmasked studies are usually cheaper to field. Participants respond faster, response rates are higher, and you often need a smaller incentive, sometimes none at all, especially with your own customers. The tradeoff is bias risk: people tend to answer more favorably when they know the sponsor.
Brand perception studies are almost always masked for this reason. Customer satisfaction studies with your own customers are usually fine unmasked. This should be a research-quality decision first and a cost decision second.
A simple framework for choosing your approach
Ask yourself these questions in order. Your answers point you toward a methodology, and the methodology is what sets your price range.
- What decision will this research actually inform? If nothing changes based on the answer, you do not need the research yet.
- How much is riding on getting it right? A new product launch or a repricing decision justifies a larger, more rigorous sample than a minor messaging tweak.
- Do you already understand the topic, or are you starting blind? Blind, go qualitative first. Familiar, go straight to quantitative.
- How fast do you need an answer? Qualitative and AI-assisted methods move faster than large fielded surveys.
- What do you already have? Check your own sales data, support tickets, and past research before commissioning anything new.
Market Research Cost by Method
With your methodology narrowed down, here is what each approach actually costs, what typically drives the price up or down within its range, and roughly how long it takes.
1. Secondary research: $100 to $10,000
This covers buying access to syndicated industry reports, pulling public data from government or trade sources, and analyzing your own existing customer or sales data. It is the cheapest category by a wide margin because nobody has to recruit anyone.
Basic industry reports run $100 to $1,000. A detailed, full-market report from a research publisher can run $3,500 to $5,000. Companies that maintain ongoing access to paid research databases often allocate around a quarter of their total annual research budget to that kind of subscription access.
Timeline: a few days to two weeks, depending mostly on how much internal data needs pulling together.
Do this first, every time. It is the fastest way to find out which questions are already answered and which ones genuinely need a primary study.
2. Online surveys: $5,000 to $15,000
For roughly 400 completed responses in a single market, budget $5,000 to $15,000. This is the cheapest form of primary quantitative research because data collection is automated end to end: no interviewer time, no printing, no travel.
Inside that range, price moves on three things: how hard your audience is to reach, how long the survey is, and how much incentive it takes to get a response.
A 10-minute survey of general consumers sits at the bottom of the range. A 20-minute survey of a niche professional audience sits at the top, or above it.
Timeline: typically 2 to 4 weeks from questionnaire approval to final data.
3. Phone surveys: $15,000 to $30,000
Same 400 completes, roughly double to triple the price of an online equivalent. Live interviewer time is the driver: someone has to dial, qualify, and administer the survey by voice, which is far slower per response than a self-administered online form.
Phone still earns its place for older demographics, rural or low-connectivity populations, and any audience where online panel coverage is thin or unreliable.
Timeline: 3 to 5 weeks, since dialing takes longer than automated online distribution.
4. Mail surveys: $10,000 to $25,000
Printing, outbound postage, return postage, and manual data entry make this slower and pricier than online, though usually cheaper than phone. It remains relevant for address-based sampling frames, older populations, and some government or utility research where mail response rates outperform digital outreach.
Timeline: 4 to 8 weeks, largely driven by mail transit time in both directions.
5. In-person surveys: $20,000 to $50,000
Intercept surveys and door-to-door or on-location fieldwork carry the highest cost of the quantitative methods because they require staffing, travel, and often venue access fees.
This is usually chosen for a specific reason, most commonly research tied to a physical location such as a retail environment, an event, or a geographically defined market that online panels do not reach well.
Timeline: 3 to 6 weeks including staff training and travel logistics.
6. In-depth interviews: $5,000 to $15,000
That range covers 10 to 15 one-on-one interviews with a general consumer audience, incentives included. Business, executive, and specialist audiences cost meaningfully more, since incentives and recruiting effort both rise. Ten to fifteen interviews with a genuinely hard-to-reach specialist audience, such as senior physicians or C-suite executives in a narrow industry, can pass $40,000.
The two easiest ways to control this cost are running interviews remotely instead of in person, and keeping each session to 30 minutes rather than a full hour.
Timeline: 2 to 4 weeks for recruiting and fieldwork, plus time for synthesis.
7. Focus groups: $4,000 to $30,000 per group
Focus group pricing has the widest spread of any method, and it is the single biggest source of confusion when people compare quotes. All three of the ranges below are legitimate. They simply describe different things.
| What the quote includes | Typical cost per group |
|---|---|
| Moderator and fieldwork only, incentives billed separately | $4,000 – $6,000 |
| Online group, all-in with recruiting and incentives included | $7,000 – $20,000 |
| In-person group with facility rental, catering, streaming, and travel | $15,000 – $30,000 |
So the first question on any focus group quote is not “how much” but “what is included.” A $5,000 quote that excludes incentives and recruiting is not actually cheaper than a $9,000 all-in quote once you add those costs back. Timeline: 3 to 5 weeks including recruiting, which is usually the slowest part.
8. Specialist and advanced methods
Beyond the standard toolkit, prices climb quickly because these methods require specialized equipment, longer fieldwork, or highly trained analysts. They are worth the spend when the decision behind them is large enough to justify it.
| Method | Typical cost | Typical timeline |
|---|---|---|
| Competitive analysis | $5,000 – $10,000 | 2 – 3 weeks |
| Mystery shopping | $5,000 – $15,000 | 3 – 6 weeks |
| Product and usability testing | $5,000 – $20,000 | 3 – 6 weeks |
| Ethnographic research | $15,000 – $50,000 | 4 – 10 weeks |
| Eye-tracking and neuro research | $15,000 – $50,000 | 4 – 8 weeks |
| Brand tracking (per year) | $7,500 – $120,000 | Ongoing, quarterly waves |
| Marketing mix modeling | $50,000 – $1,000,000+ | 8 – 16 weeks |
What You Are Actually Paying For
Most quotes arrive as one number with a one-line description. That makes them nearly impossible to compare or negotiate. It helps enormously to know how a research firm actually builds that number internally.
Below are two full worked examples, a small consumer survey and a larger B2B one, broken into their real components.
Example 1: A $9,000 consumer online survey
400 completed responses, general consumer audience, 12-minute questionnaire, topline report only.
| Line item | Cost | Share of total |
|---|---|---|
| Study design and questionnaire development | $1,200 | 13% |
| Survey programming and testing | $700 | 8% |
| Sample and panel access | $2,400 | 27% |
| Participant incentives | $1,600 | 18% |
| Fieldwork management and quota monitoring | $900 | 10% |
| Data cleaning and quality checks | $700 | 8% |
| Topline analysis and summary | $1,000 | 11% |
| Reporting | $500 | 6% |
| Total | $9,000 | 100% |
Example 2: A $22,000 B2B online survey
400 completed responses, business professional audience, 18-minute questionnaire, full crosstab report with executive presentation.
| Line item | Cost | Share of total |
|---|---|---|
| Study design and questionnaire development | $2,500 | 11% |
| Survey programming and testing | $1,500 | 7% |
| Sample and panel access | $6,000 | 27% |
| Participant incentives | $4,000 | 18% |
| Fieldwork management and quota monitoring | $2,000 | 9% |
| Data cleaning and quality checks | $1,500 | 7% |
| Full analysis and crosstabs | $2,500 | 11% |
| Reporting and presentation | $2,000 | 9% |
| Total | $22,000 | 100% |
Two patterns hold across both examples. First, getting to the right people, meaning sample plus incentives, consistently eats 40% to 45% of the budget. Second, thinking, meaning design plus analysis plus reporting, consistently takes 30% to 40%.
The mechanical part of collecting the data is a comparatively small piece of the total. This is exactly why audience difficulty dominates pricing more than any other single factor, and why cutting the reporting budget to save money is usually a false economy: you paid nearly full price to collect the data and then chose not to pay to understand it properly.
Cost per complete
Research firms build sample cost from the bottom up, using a price per completed response. Once you know these benchmarks, you can rough out a survey budget yourself before you ever request a quote.
| Audience | Cost per complete |
|---|---|
| General consumer | $2 – $5 |
| Niche consumer (pet owners, new parents, hobbyists) | $8 – $20 |
| B2B professionals (managers, directors) | $40 – $150 |
| Hard-to-reach specialists (physicians, engineers, C-suite) | $200 – $500+ |
Four hundred general consumers might cost $1,600 in pure sample. Four hundred physicians, at the high end, could cost $200,000. Same survey length, same analysis, same report. The only thing that changed is who you needed to reach.
The Seven Factors That Drive Your Market Research Price
Every quote you will ever receive is built from combinations of the same seven variables. Understanding each one is what lets you negotiate intelligently instead of just accepting or rejecting a number.
1. Audience difficulty
This is the single biggest lever in market research pricing, by a wide margin. Reaching adults aged 18 and over costs a fraction of what it costs to reach ophthalmologists in the Midwest, or C-suite executives at companies above $100 million in revenue. The tighter and rarer your target definition, the more it costs to find each qualifying person.
Before accepting a high quote, ask honestly whether your audience definition is as narrow as it truly needs to be. Sometimes it genuinely is. Often, requirements that seem essential, like requiring five years of tenure in a role instead of two, or a specific job title instead of a functional description, are tighter than the underlying decision actually requires, and loosening them by even a little can meaningfully cut cost.
2. Incidence rate
Incidence rate is the percentage of people contacted who actually qualify for your study. If you are surveying the general population and want women only, your incidence rate is around 50%. If you want homeowners on two or more acres who are planning to buy a garden shed in the next year, your incidence rate might be 2%.
A low incidence rate raises cost sharply because someone has to pay for every person who starts the screening questions and gets disqualified. A researcher fielding a survey with a 2% incidence rate needs to reach roughly 50 people to find one qualified respondent, and every one of those 50 contacts costs something in panel fees or outreach labor.
Always ask a vendor directly what incidence rate they are assuming in their quote, and what the price does if the real number turns out to be lower once fieldwork actually starts.
3. Sample size, and the math behind it
More completed responses means more statistical confidence, and more cost. The relationship is not linear. Going from 100 to 400 responses meaningfully tightens your margin of error.
Going from 1,000 to 4,000 barely moves it further. This is why 400 has become something close to an industry default: it sits at the point of diminishing returns for most business decisions.
| Completed responses | Margin of error (95% confidence) | What it typically supports |
|---|---|---|
| 100 | about ±10% | Rough direction only, not a decision basis |
| 200 | about ±7% | Directional reads, early-stage testing |
| 400 | about ±5% | Most standard business decisions |
| 1,000 | about ±3% | High confidence, publishable or investor-facing |
| 4,000 | about ±1.5% | Rarely worth the added cost outside national tracking studies |
The underlying idea is simple even if the formula looks technical. Margin of error shrinks with the square root of your sample size, not the sample size itself. That is why doubling your sample from 400 to 800 only tightens your margin of error from about ±5% to about ±3.5%, not down to ±2.5%.
Each additional block of responses buys you progressively less precision, which is exactly why most research briefs settle around 400 rather than chasing ever-larger samples.
Go higher than 400 specifically when you plan to break results down by subgroup, such as by age band, region, or customer segment, because each subgroup needs its own adequate sample to be reliable on its own. A study with 400 total responses split six ways may leave you with subgroups too small to trust.
4. Survey and interview length
A 10-question survey and a 30-question survey are not the same product, even if the topic is identical. Longer surveys have measurably higher dropout rates, which means a vendor has to recruit more starts to land the same number of completes, and that raises cost even though the number of finished responses looks unchanged.
The same logic applies directly to qualitative work. A three-hour in-person session requires far more recruiting effort, higher incentives, and more scheduling flexibility than a 30-minute online interview. If budget is tight, cutting length before cutting sample size or audience quality is usually the better trade.
5. Incentives
People are compensated for their time, and the appropriate amount varies more than most first-time buyers expect. Underpaying relative to the ask is one of the fastest ways to blow a project timeline, because low response rates force fieldwork to run longer or force a vendor to raise the incentive mid-flight anyway.
| Participant type | Typical incentive |
|---|---|
| Consumer online survey | $10 – $20 |
| Consumer focus group or in-depth interview | $50 – $150 |
| Business professional, survey | $50 – $100 |
| Business professional, qualitative interview | $200 – $250 |
| Physicians and senior executives | Up to $500 |
Incentives in Europe and Asia often run at double the North American rate for equivalent business audiences. Be cautious about overcorrecting in the other direction, though. Oversized incentives attract people who are participating primarily for the money, and that shows up later as rushed, low-quality, or straight-lined responses, which you then pay again to identify and remove during data cleaning.
6. Timeline
Speed costs money in market research the same way it does in shipping or construction. A standard project timeline of 4 to 8 weeks lets a vendor recruit patiently, run fieldwork at a normal pace, and analyze without rushing. Compress that same project into 5 to 10 days and expect a rush premium of roughly 20% to 40%, driven by overtime labor, expedited panel access, and less time to catch data quality issues before they compound.
If your timeline is flexible, say so explicitly when requesting quotes. Vendors sometimes price defensively toward the tightest plausible timeline unless told otherwise.
7. Deliverables and analysis depth
This factor surprises more first-time buyers than any other. The reporting and analysis phase can cost as much as the fieldwork itself, and sometimes more.
A raw data export is the cheapest option, essentially a spreadsheet with no interpretation. A crosstab report with key findings sits in the middle. A full executive presentation deck plus a stakeholder workshop costs meaningfully more. An interactive, continuously updated dashboard sits at the premium end. Predictive modeling, such as choice modeling or marketing mix modeling, is priced as its own specialist project on top of the base research.
Pay for the depth of analysis you will genuinely use. Requesting crosstabs across every demographic variable available is a reliable way to spend money on tables that nobody on your team will ever open.
How Market Research Cost Varies by Region
Where you run research changes the price nearly as much as how you run it. Local incentive expectations, moderator and interviewer rates, facility rental costs, translation needs, and panel availability all differ meaningfully by country.
| Region | In-depth interview (per respondent) | Focus group (per session) |
|---|---|---|
| US and Western Europe | $800 – $1,500 | $4,000 – $10,000 |
| India | $120 – $250 | $1,200 – $2,500 |
Each additional country you add to a study typically adds 20% to 40% to the total project cost, driven by translation, back-translation, cultural adaptation of the questionnaire, running parallel fieldwork in multiple languages at once, and managing quotas separately in each market.
A single-market US study priced at $20,000 can realistically become a $60,000 to $80,000 project once you extend the same design to the UK, Germany, and Australia. Budget for this multiplier from the start rather than discovering it mid-project.
What Should You Budget, by Company Stage
Research spend should track where your company actually is, not where you hope to be in two years. Below is a realistic budget for each stage, along with what it should actually buy you.
Startups and early-stage companies: $0 to $10,000
At this stage, the goal is direction, not statistical precision. You are trying to avoid building the wrong thing, not trying to publish a definitive market report. Free tools, direct conversations with prospective customers, and one small survey will get you most of the way there.
- Free tools: Google Trends, Reddit and forum research, social listening, publicly available government or industry data
- Five to ten customer interviews you conduct yourself: $500 to $1,500 in incentives
- A 100-response self-serve survey through an AI-powered or DIY platform: $500 to $2,000
Two to five thousand dollars spent carefully at this stage can prevent a fifty thousand dollar product mistake later. That is the entire logic of research at this budget level: cheap insurance against expensive assumptions.
Growth-stage companies: $10,000 to $75,000
At this stage you generally need both the numbers and the reasoning behind them. Decisions carry more weight, and gut instinct alone is a riskier basis to build on. A typical annual research program at this stage looks something like this.
- One or two rounds of qualitative interviews to understand a specific problem: $5,000 to $10,000
- An online quantitative survey with 400 to 800 completes to validate direction: $10,000 to $20,000
- A competitive landscape report: $3,000 to $6,000
- An ongoing customer satisfaction tracking program: $5,000 to $15,000 per year
That adds up to roughly $23,000 to $51,000 per year, a figure that one better-informed product or pricing decision can pay for many times over.
Mid-market and enterprise: $75,000 to $500,000+
At this scale, research programs run across multiple markets, multiple methods, and multiple waves throughout the year, coordinated as an ongoing function rather than a one-off project.
- Annual brand tracking across three or four markets: $50,000 to $120,000
- Annual customer experience measurement program: $30,000 to $80,000
- Three or four ad-hoc project studies per year, covering things like new product concepts or pricing tests: $30,000 to $100,000
- Marketing mix modeling, typically justified once media spend passes roughly $5 million per year: $100,000 to $500,000+
A cross-check against company revenue
Another useful sanity check is to compare your budget against company size directly. These are reasonable estimates for a single round of research.
| Company revenue | Cost per research round |
|---|---|
| $5 million | about $20,000 |
| $20 million | about $40,000 |
| $200 million | about $60,000 |
Notice that a company forty times larger in revenue pays only three times more for research. Cost does not scale in step with company size, which means research becomes proportionally cheaper, relative to revenue, the larger a company gets. That is also why larger firms tend to research more often: the marginal cost of one more study is smaller relative to what is at stake.
Hidden Costs That Blow Up Your Budgets
These are the line items that turn a $30,000 project into a $45,000 project after the fact. Ask about every one of them explicitly before you sign anything, because they are frequently left out of an initial ballpark quote.
- Participant incentives quoted separately
Some proposals quote fieldwork and analysis but list incentives as a separate line, sometimes as a rough estimate rather than a firm number. For hard-to-reach B2B audiences, this alone can add $10,000 to $20,000 once the real incentive level needed to hit quota becomes clear.
- Incidence rate coming in lower than assumed
If your target audience turns out to be harder to find than the vendor assumed at the quoting stage, panel and recruiting costs can spike mid-project, sometimes by 50% or more. This is exactly why the incidence rate question belongs on your pre-signing checklist, not something you discover three weeks into fieldwork.
- Rush fees
Needing results in five days instead of the standard three to four weeks typically adds a 20% to 40% premium, covering overtime labor and expedited panel access.
- Translation and localization
Adding a single international market to an existing study typically adds $3,000 to $8,000, covering translation, back-translation for accuracy, and cultural adaptation of question wording.
- Data visualization and reporting upgrades
A basic findings deck is usually included in a standard quote. An interactive online dashboard, a live stakeholder workshop, or an executive video debrief are typically add-ons, running $3,000 to $15,000 depending on scope.
- Oversampling for subgroup analysis
If you want to reliably compare results across, say, four age bands and three regions, a flat 400 responses will not get you there. You need an adequate sample within every individual cell you plan to analyze, which can potentially double your total sample cost. This is the hidden cost that catches the most experienced buyers off guard, precisely because it sounds like a reporting request rather than a fieldwork request.
How AI Has Changed Research Pricing in 2026
AI has genuinely cut the price of certain research tasks by 60% to 90%. The savings are real, but they are concentrated specifically in structured, repeatable work, not research as a whole.
| Task | Traditional cost | AI-assisted cost | Savings |
|---|---|---|---|
| 200 qualitative interviews | $30,000 – $50,000 | $4,000 – $10,000 | 80% – 90% |
| Survey programming and setup | $2,000 – $5,000 | $200 – $500 | 80% – 90% |
| Open-end coding, 1,000 responses | $3,000 – $8,000 | $300 – $1,000 | 80% – 90% |
| Analysis and insight generation | $5,000 – $15,000 | $1,000 – $5,000 | 60% – 80% |
| Report writing | $3,000 – $8,000 | $500 – $2,000 | 70% – 85% |
| Continuous brand monitoring | $40,000 – $120,000/yr | $5,000 – $20,000/yr | 70% – 85% |
AI does not replace everything, and treating it as a full substitute for judgment is where projects go wrong. Exploratory ethnography, co-creation workshops, research on sensitive topics, and work with vulnerable populations still need a trained human moderator who can read a room, notice what is not being said, and follow an unexpected thread of conversation.
The realistic way to think about AI in research right now is as the thing that makes structured, repeatable, tracking-style work dramatically more affordable, freeing up budget to spend on the exploratory work that still benefits from a human.
DIY vs Platform vs Agency: Who Should Actually Run This
Who does the work changes your price by more than the method itself does. Here is what each route costs, what it is genuinely good for, and what you give up by choosing it.
| Approach | Cost | Best for | Trade-off |
|---|---|---|---|
| DIY tools | Baseline, often free or near-free | Simple surveys, quick pulse checks | Design bias, weaker data quality control |
| Self-serve AI platform | $500 – $3,000 | Fast, directional reads | Limited support for complex methodology |
| Boutique agency (10-50 people) | +20% to 40% over baseline | Specialized industries, bespoke insight | May subcontract panel access to a third party |
| Full-service agency | +40% to 80% over baseline | Complex, high-stakes, multi-market work | Overhead is built into the price |
| Freelance consultant | $800 – $2,000 per day | An ongoing internal insight function | Limited capacity for large fieldwork |
A reasonable way to decide: if a wrong answer would be merely inconvenient, DIY or a self-serve platform is fine. If a wrong answer would be genuinely expensive, meaning it touches pricing, a major launch, or market entry, the premium of a full-service agency is usually justified by the quality control and accountability that comes with it.
Ten Ways to Cut Research Costs Without Wrecking the Data
You can genuinely spend less without ending up with data you cannot trust. These are the levers that reduce cost without damaging quality, in roughly the order most projects should consider them.
- Start with secondary research. Answer everything you can for free or near-free, then spend primary research budget only on what is left unanswered.
- Tighten your objectives before requesting a quote. A vague brief invites a padded quote, because the vendor has to price in uncertainty on your behalf.
- Move fieldwork online wherever the method allows it. Online focus groups and remote interviews strip out facility rental, travel, and catering costs entirely.
- Shorten the instrument. Every question you cut lowers dropout and cost at the same time, and it usually improves data quality on the questions that remain.
- Use your own customer list. Current, permissioned customer emails let you skip external panel fees entirely for research aimed at existing customers.
- Test cheap things directly in the market. Promotional messaging and positioning ideas can often be tested with a small ad spend instead of a formal focus group.
- Order topline reporting instead of a full comprehensive report, and analyze the underlying data in-house if you have the internal capacity to do it well.
- Phase the project. Run a small, cheap qualitative round first to sharpen the real questions, then commit the larger quantitative budget only once you know precisely what to ask.
- Build a standing customer panel. A group of customers who have already agreed to participate in future research cuts recruiting cost and time on every project after the first.
- Do not over-survey the same audience. Surveying your customers too frequently quietly erodes future response rates, which raises the cost of every subsequent project.
One more costs nothing at all and pays off over time. Report back to the people who participated. Telling customers, even briefly, what you learned and what changed as a result is consistently the best way to keep response rates high on the next project.
Is Market Research Worth the Cost?
The case for research becomes much easier to make once you frame the spend against the cost of being wrong, rather than treating it as a cost in isolation.
3D television is the standard cautionary example in this industry, and it holds up well. The assumption at the time was that technology which worked well on a cinema screen would translate directly into consumer living rooms.
Products were rushed to market with comparatively little validation research behind them. That assumption did not survive contact with reality.
Consumers balked at the price of the sets, the extra required equipment, technical problems like eye strain, a narrow effective viewing angle, and a lack of enough 3D content to justify owning the hardware in the first place. Demand stayed weak, and the launch failed.
The math on a single research study is straightforward once you have real numbers to plug in. Subtract the cost of the research from the value of the decision it improved.
A $40,000 study that surfaces an opportunity worth $200,000 in additional business nets $160,000, after accounting for the cost of running the study itself. Framed that way, the research was not really a $40,000 expense. It was closer to an 80% return on a decision that was going to be made either way, informed or not.
Research also compounds over time in a way a single ROI calculation does not fully capture. Companies that research their target markets frequently, at least quarterly, consistently outgrow and outperform companies that research only occasionally or not at all.
The relationship holds because frequent research changes what those companies actually do differently, not because a well-produced report is inherently valuable on its own.
That last point is the most important one in this entire guide. Market research is not magic, and it is not self-executing. A study that gets delivered and then sits unopened in a shared drive returns exactly nothing, regardless of how much it cost or how rigorous the methodology was.
Questions to Ask Before You Accept a Quote
Before signing anything, get clear answers to these questions. What you hear back, and how directly a vendor answers, tells you more about the quality of the partnership than the headline price ever will.
- What incidence rate are you assuming, and what happens to the price if the real rate comes in lower once fieldwork starts?
- Are participant incentives included in this number, or will they be billed separately as fieldwork progresses?
- How many completes am I getting, and what margin of error does that actually give me?
- Is the panel you are using owned by your company, or are you subcontracting it to a third party?
- What exactly is included in the final report, and can I see a sample deliverable from a comparable past project?
- Who specifically writes the questionnaire, who moderates the sessions, and who performs the analysis?
- What is the realistic timeline, and what would it cost to compress it if I needed results faster?
- What happens, contractually and financially, if we do not hit the agreed quota?
- How many rounds of revisions to the questionnaire and the final report are included in this price?
- If I needed this to come in 20% lower, which specific line items would you cut first?
That last question is the most useful one on the list. A vendor who has a clear, specific answer ready understands their own cost structure. A vendor who cannot answer it clearly probably built the quote from a template rather than from your actual project.
Related Read: How to Conduct Market Research
