


Black Friday 2025 has concluded, and online shoppers in the United States spent $11.8 billion. That is a healthy increase of 9.2% from the previous year. Separately, total U.S. holiday retail sales from November 1 through December 31 finished near the top of the NRF forecast of just over $1 trillion.
This year’s Black Friday consumer shopping behavior was affected by import tariffs, and 22% of US shoppers planned to do their Black Friday and holiday shopping sooner due to higher prices.
Let’s learn more about the biggest Black Friday yet and analyze spending, top shopping motivators, the use of AI tools for shopping, and the impact of import tariffs on consumer behavior.
Key Black Friday Sales Statistics 2025 (Editor’s Pick)
- Online sales for Black Friday reached $11.8 billion in 2025. That is a 9.2% increase from the previous year.
- Total online sales for the Thanksgiving week surpassed $41.1 billion in 2024.
- Before the event, 26% of Americans said they planned to cut their Black Friday/Cyber Monday spending in 2025 compared with 2024.
- 78% of US shoppers are driven to buy during Black Friday because of the deals.
- Before the event, 32% of Americans said they planned to reduce their Black Friday spending due to import tariffs.
How Much Money Is Spent on Black Friday Over the Years?
Americans spent a record $11.8 billion online during the Black Friday Sale in 2025, a 9.2% year-on-year increase from $10.8 billion in 2024.
Online shoppers spent $12.5 million per minute from 10 AM to 2 PM on Black Friday, the highest ever in history.
From 2020 to 2025, Black Friday online sales grew by approximately 30.7%, and sales were 136% higher than in 2017. In 2024, annual sales growth surpassed 10% for the first time since 2020.
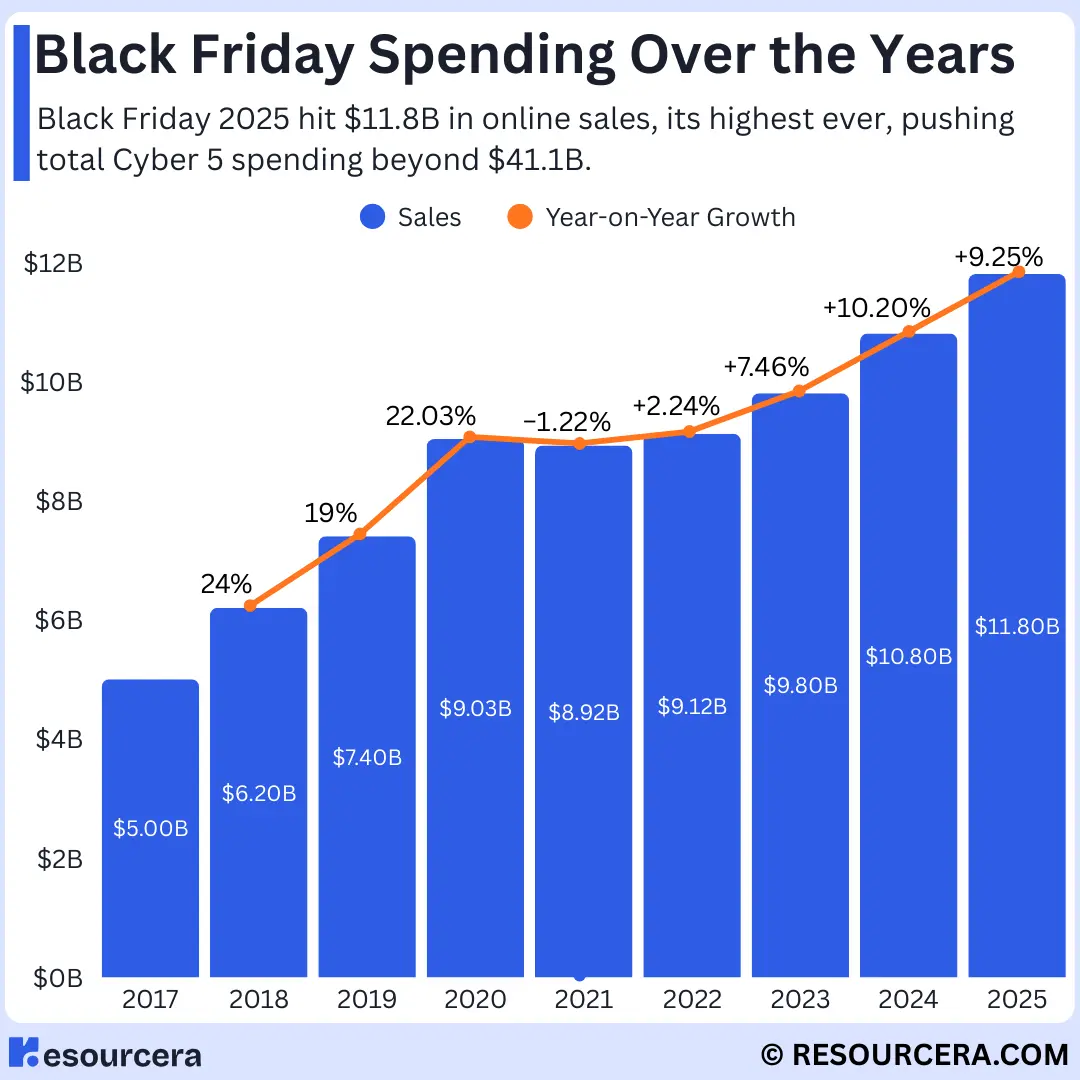
The table shows the Black Friday spending over the years:
| Year | Online Sales | Year-on-Year Growth |
|---|---|---|
| 2017 | $5.0 billion | — |
| 2018 | $6.2 billion | +24.00% |
| 2019 | $7.4 billion | +19.35% |
| 2020 | $9.03 billion | +22.03% |
| 2021 | $8.92 billion | −1.22% |
| 2022 | $9.12 billion | +2.24% |
| 2023 | $9.8 billion | +7.46% |
| 2024 | $10.8 billion | +10.20% |
| 2025 | $11.8 billion | +9.26% |
| 2026* | $12.9 billion | +9.32% |
Total Black Friday Sales Worldwide Over The Years
In 2024, global Black Friday online sales reached around $74.4 billion, marking a 4.94% increase from $70.9 billion in 2023.
The sales figures for Black Friday in 2022 were about $65.3 billion. This shows a 14% growth in the online worldwide sales from 2022 to 2024.
Global Black Friday online sales reached $79 billion in 2025, representing a 6% year-on-year increase, according to Salesforce.
Here is the table to represent total Black Friday sales worldwide over the years:
| Year | Global Black Friday Sales Figures | Year-on-Year Change |
|---|---|---|
| 2022 | $65.3 billion | – |
| 2023 | $70.9 billion | 8.57% |
| 2024 | $74.4 billion | 4.94% |
| 2025 | $79 billion | 6% |
Total Spending During Cyber Week In The United States
In 2025, Cyber Week generated a record $44.2 billion in U.S. online sales. Thanksgiving sales totaled $6.4 billion, Black Friday sales reached $11.8 billion, weekend sales reached $11.8 billion, and Cyber Monday sales totaled $14.25 billion.
In 2024, total online sales during Cyber Week were around $41.1 billion, an 8.2% increase from $38 billion in 2023.
During Cyber Week in 2024, Thanksgiving sales were $6.1 billion, Black Friday sales were $10.8 billion, weekend sales were $10.9 billion, and Cyber Monday sales were $13.3 billion.
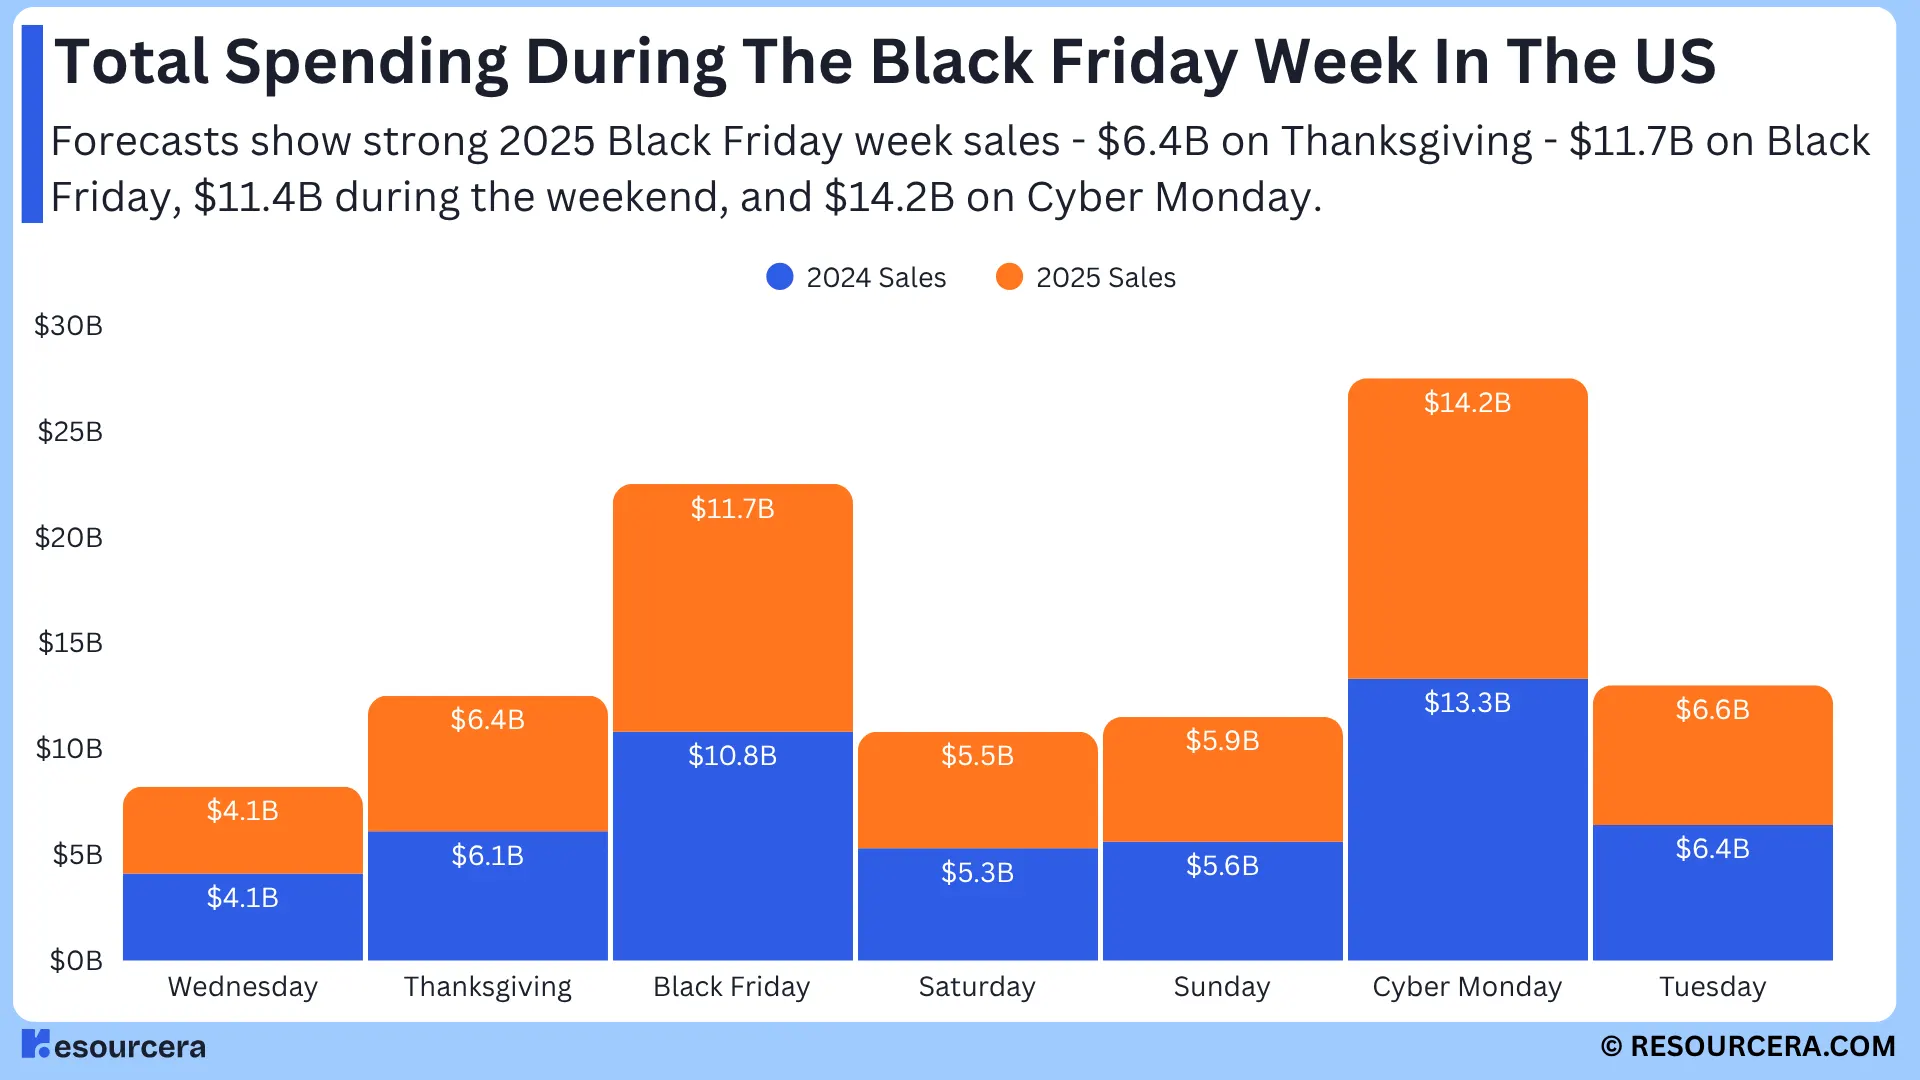
The table below shows a detailed comparison of Cyber Week sales figures between 2024 and 2025:
| Period | 2024 Sales | 2025 Sales | Y-o-Y Growth |
|---|---|---|---|
| Thanksgiving | $6.1 billion | $6.4 billion | 5.3% |
| Black Friday | $10.8 billion | $11.8 billion | 9.1% |
| Weekend | $10.9 billion | $11.8 billion | 8.7% |
| Cyber Monday | $13.3 billion | $14.25 billion | 7.1% |
| Cyber Week Total | $41.1 billion | $44.2 billion | 7.7% |
Sources: Salesforce, Adobe
Consumer Shopping Behavior During Black Friday Statistics
Online shopping attracted more Black Friday shoppers than in-store shopping in 2024. Department stores and e-commerce platforms were both popular shopping destinations, while deals remained the main reason 4 out of 5 Americans shopped during Black Friday sales. Here are some consumer shopping behavior statistics from Black Friday:
Shoppers’ Preference For In-Store And Online Shopping
Around 81.7 million shoppers in the United States shopped in physical stores during Black Friday in 2024, while 87.3 million shoppers shopped online.
In 2023, 76.2 million shoppers made in-store purchases, while 90.6 million consumers shopped online.
The table below shows the difference between consumers’ shopping preferences during the Black Friday sale in 2023 and 2024:
| Platform | 2024 | 2023 | Y-o-Y Changes |
|---|---|---|---|
| In-Store Shoppers | 81.7 million | 76.2 million | + 7.21% |
| Online Shoppers | 87.3 million | 90.6 million | – 3.64% |
In addition to the Black Friday sale, here is the detailed information about consumers’ purchasing preferences during the Thanksgiving week in 2024:
| Platform | Thanksgiving | Black Friday | Saturday | Sunday | Cyber Monday |
|---|---|---|---|---|---|
| In-Store | 26.1 million | 81.7 million | 61.1 million | 25.6 million | 23.2 million |
| Online | 28.6 million | 87.3 million | 53.9 million | 32.8 million | 64.4 million |
Top destinations for shopping during Thanksgiving weekend
During the Thanksgiving weekend, department stores and e-commerce platforms are the primary shopping destinations for Americans, with 42% making purchases from these locations.
About 40% of US shoppers purchase from grocery stores and supermarkets during the Thanksgiving weekend, while 37% consider buying from clothing and accessory stores. Discount stores rank last in the list, as 32% of Americans shop from this location during the same period.
Black Friday Shopping Plans of Americans
In a pre-event 2025 survey, around 21% of U.S. consumers said they planned to do their Black Friday and Cyber Monday shopping during the event period. Another 47% planned to start holiday shopping before November, while only 3% planned to make purchases a week before Christmas.
The table below shows detailed information on shopping plans of US consumers during Black Friday and the Holiday season:
| Month or Shopping Timing | Share of Americans |
|---|---|
| July | 6% |
| August | 5% |
| September | 13% |
| October | 23% |
| November | 24% |
| Black Friday/Cyber Monday | 21% |
| A Week Before Christmas | 3% |
Top Motivators to Shop During Black Friday
About 78% of US shoppers get motivated by discounts and deals to purchase during Black Friday and Cyber Monday. At the same time, 37% stated that the need for specific products is the main reason to shop during the same period.
Interestingly, FOMO (Fear of Missing Out) is the reason why 9% Americans purchase during Black Friday and Cyber Monday.
Here is the table to showcase the top reasons to shop during Black Friday for Americans:
| Motivators to Shop | Share of US Shoppers |
|---|---|
| Discounts and Deals | 78% |
| Opportunity to shop for Christmas | 43% |
| Need to buy specific products | 37% |
| Tradition with friends and family | 16% |
| Fear of Missing Out | 9% |
Top Demotivators To Not Shop During Black Friday
About 63% of US shoppers lose interest in shopping during Black Friday, as most of the discounts are misleading. At the same time, 42% say that poor-quality products on discount is the biggest demotivator for them not to shop during Black Friday.
The table below shows the top demotivators to not shop during Black Friday:
| Top Demotivating Reasons | Share of American Consumers |
|---|---|
| Discounts are misleading | 63% |
| Poor quality products on offer | 42% |
| The novelty has worn off | 37% |
| Changes in financial situation | 34% |
| Too much advertising | 26% |
| Too many sales events | 24% |
Sources: YouGov, Experian, NRF
Black Friday Consumer Spending Statistics
- Before the 2025 event, around 26% of Americans said they planned to spend less during Black Friday/Cyber Monday than in the previous year, while 34% planned to spend the same. Only 10% planned to spend more.
- Americans spent an average of $235 per shopper during the Thanksgiving Weekend in 2024, an 8% growth compared to 2023.
- In 2025, Buy Now, Pay Later (BNPL) generated $20 billion in online sales during the holiday season, including Black Friday, a 9.8% increase from $18.2 billion in 2024.
Before the event, Adobe projected that BNPL spending on Black Friday 2025 would reach $761.8 million. Final Cyber Monday BNPL spending reached $1.03 billion.
The table below showcases BNPL spending during the holiday season over the years:
| Year | BNPL Sales | Y-o-Y Growth |
|---|---|---|
| 2025 | $20 billion | + 9.8% |
| 2024 | $18.2 billion | + 9.6% |
| 2023 | $16.6 billion | + 14% |
| 2022 | $14.5 billion | + 11% |
- 82.2% of 2025 holiday-season BNPL spending came from smartphones. From November 1 to November 28, 2025, BNPL mobile spending reached $6.7 billion, including Thanksgiving and Black Friday sales.
- Before the 2025 event, Americans earning less than $50K said they planned to spend around $829 during Black Friday, a 12% increase from the previous year. Consumers in the $50K to $99K income group planned to spend $1548.
Here is detailed information about Black Friday spending by income groups:
| Income Group | Average Spending | Y-o-Y Change |
|---|---|---|
| Less than $50K | $829 | + 12% |
| $50K to $99K | $1548 | – |
| $100K to $199K | $2546 | + 17% |
| Higher than $200K | $3887 | – |
Black Friday Shopping Statistics by Product Category
Before the 2025 event, about 61% of Americans said they planned to purchase clothing during major sales, including Black Friday. Another 56% planned to purchase tech products and gifts, while 38% planned to purchase accessories.
The table below shows detailed information about the preferred product categories of Americans during Black Friday:
| Product Category | Share of Americans Plan to Purchase |
|---|---|
| Clothing | 61% |
| Tech Products | 56% |
| Gifts | 56% |
| Accessories | 38% |
| Household Appliances | 28% |
| Cosmetic or Beauty Products | 26% |
| Toys | 25% |
| Household Furniture | 14% |
| Sporting Goods | 12% |
During the 2025 U.S. holiday season, the electronics category generated $59.8 billion in online sales, an 8.2% year-on-year increase from $55.3 billion in 2024. The apparel category ranked second with $49 billion in online sales.
Here is a detailed comparison of online sales by product category during the 2024 and 2025 U.S. holiday seasons:
| Category | Sales Value in 2025 | Sales Value in 2024 |
|---|---|---|
| Electronics | $59.8 billion | $55.3 billion |
| Apparel | $49.0 billion | $45.6 billion |
| Furniture and Home Goods | $31.1 billion | $29.2 billion |
| Grocery | $23.7 billion | $21.5 billion |
| Toys | $8.8 billion | $8.2 billion |
| Cosmetics | $8.4 billion | $7.7 billion |
| Sporting Goods | $8.4 billion | $7.8 billion |
Black Friday Shopping Statistics by Device
In 2025, 56.4% of U.S. holiday-season online sales came from mobile phones, up from 54.5% in 2024.
In 2024, 54.5% of holiday-season online sales came from mobile phones, while the remaining 45.5% came from desktops.
Here is the estimated mobile revenue generated during the U.S. holiday season over the years:
| Year | Mobile Revenue During the U.S. Holiday Season |
|---|---|
| 2022 | $99.3 billion |
| 2023 | $113.5 billion |
| 2024 | $131.5 billion |
| 2025 | $145.4 billion |
Sources: Adobe
Black Friday Buyers Demographics
- Before the 2025 event, 50% of US female consumers said they planned to shop during Black Friday and Cyber Monday sales, compared with 42% of male consumers.
| Male | Female |
|---|---|
| 42% | 50% |
- Before the 2025 event, roughly 57% of Gen Z and Millennials said they planned to shop during Black Friday and Cyber Monday, compared with 38% of Gen X and Boomers+.
| Age Group | Share of Shoppers Plan to Purchase |
|---|---|
| Gen Z and Millennials | 57% |
| Gen X and Boomers | 38% |
- Before the 2025 event, 57% of Americans in the Northeast said they planned to shop during Black Friday and Cyber Monday, compared with 43% in the Midwest, 47% in the South, and 39% in the West.
Source: YouGov
Black Friday Discounts Statistics
During the 2025 U.S. holiday season, discounts peaked at 30.9% for electronics and 29.6% for toys, the highest among the major categories tracked by Adobe.
Apparel, TVs, and computers followed with peak discounts of 25.1%, 24.3%, and 23.4%, respectively.
The table below presents peak discounts across product categories during the 2025 U.S. holiday season:
| Category | Peak Discount in 2025 | Peak Discount in 2024 |
|---|---|---|
| Electronics | 30.9% | 30.1% |
| Toys | 29.6% | 28% |
| Apparel | 25.1% | 23.2% |
| TVs | 24.3% | 24.2% |
| Computers | 23.4% | 22.8% |
| Sporting Goods | 20.3% | 19.5% |
| Appliances | 20.2% | 19.2% |
| Furniture | 18.8% | 19% |
Source: Adobe
Black Friday AI Traffic Statistics
During the Black Friday 2025 sale, AI-driven traffic to the United States retail websites increased by 805% compared to the previous year.
AI and agents accounted for $14.2 billion in global online Black Friday sales, including $3 billion in the United States.
Sources: Adobe, Salesforce
Black Friday AI Usage Statistics
Before the 2025 event, around 64% of Americans said they were unlikely to use Artificial Intelligence (AI) tools to navigate Black Friday and Cyber Monday deals. Only 16% of consumers said they were likely to use AI tools to find the best deals.
Before the 2025 event, about 59% of Gen Z and Millennial U.S. consumers said they were unlikely to use AI tools to find Black Friday and Cyber Monday deals. Only 20% said they were likely to use AI tools.
Interestingly, 71% of Gen X and Baby Boomers+ US shoppers said they were unlikely to use AI tools to discover Black Friday promotions. Only 12% of consumers said they were likely to use AI tools.
Source: YouGov
Impact of Tariffs on Black Friday Spending
Before the 2025 event, around 22% of Americans said they planned to shop sooner than usual due to import tariffs. About 46% said tariffs would not alter their plans, while 14% planned to shop later in the hope that prices would fall.
Before Black Friday 2025, roughly 33% of US consumers said they were likely to prioritize “Made in USA” products, while 10% said they were unlikely to do so. Around 43% said they would continue purchasing products as they had the previous year.
Before the event, about 32% of Americans said they planned to spend less on Black Friday shopping due to import tariffs, while only 8% planned to spend more than the previous year.
Source: YouGov
Black Friday Sales Global Statistics
The UAE showed the highest Cyber Monday interest, with 54% of Emiratis showing intent to purchase. Italy ranks second in the list, with about 49% of consumers planning to shop. On the other hand, the USA (36%) and India (33%) displayed strong Black Friday participation.
The table below shows a detailed report on Black Friday and Cyber Monday shopping intent across multiple countries:
| Country | Black Friday Shopping Intent | Cyber Monday Shopping Intent |
|---|---|---|
| Australia | 30% | 44% |
| Canada | 29% | 43% |
| France | 15% | 34% |
| Germany | 19% | 30% |
| GB (UK) | 19% | 32% |
| India | 33% | 23% |
| Italy | 19% | 49% |
| Singapore | 24% | 41% |
| Spain | 21% | 44% |
| UAE | 36% | 54% |
| US | 36% | 34% |
Germany dominates the list of average Black Friday shopping budgets across select European countries in 2024, with an average of €317, followed by Austria at €303. Spain and France rank third and fourth in the list, with an average shopping budget of €282 and €265, respectively.
Here is the table showing the average Black Friday purchasing budget across various European countries:
| Country | Average Black Friday Shopping Budget |
|---|---|
| Germany | €317 |
| Austria | €303 |
| Spain | €282 |
| France | €265 |
| Italy | €264 |

