
In 2026, 4.33 billion people worldwide subscribed to at least one OTT streaming service. That is more than half the global population on streaming platforms, and the number keeps growing.
In the US alone, 83% of adults use streaming, while only 36% still pay for cable.
Netflix leads globally with 325 million paid subscribers, followed by HBO Max at 140 million and Disney+ at 131.6 million.
This article covers the latest OTT subscriber statistics for 2026, including platform rankings, regional breakdowns, age group data, viewing habits, and where subscriber growth is heading next.
Read on to get full insights.
OTT Subscribers Statistics: At a Glance
- The global OTT user base is projected to reach 4.33 billion in 2026.
- Netflix remains the world’s largest streaming platform with over 325 million subscribers.
- HBO Max crossed 140 million subscribers as of March 2026, overtaking Disney+ to rank third globally.
- Global OTT video penetration stands at 73.2% in 2026, up from 48.28% in 2019.
- Canada leads all countries in OTT penetration, at 135.35%, with an average of more than one subscription per household.
- Three Asian platforms, Tencent Video, iQIYI, and JioHotstar, each crossed 100 million subscribers in 2025.
Sources: Statista 1, FlixPatrol, Statista 2, Statista 3
How Many OTT Subscribers Are There in 2026
The global OTT user base stands at an estimated 4.33 billion in 2026.
Streaming adoption keeps rising year over year, pushed by mobile expansion in Asia-Pacific, broader 5G coverage, and cheaper ad-supported tiers bringing in price-sensitive users across emerging markets.
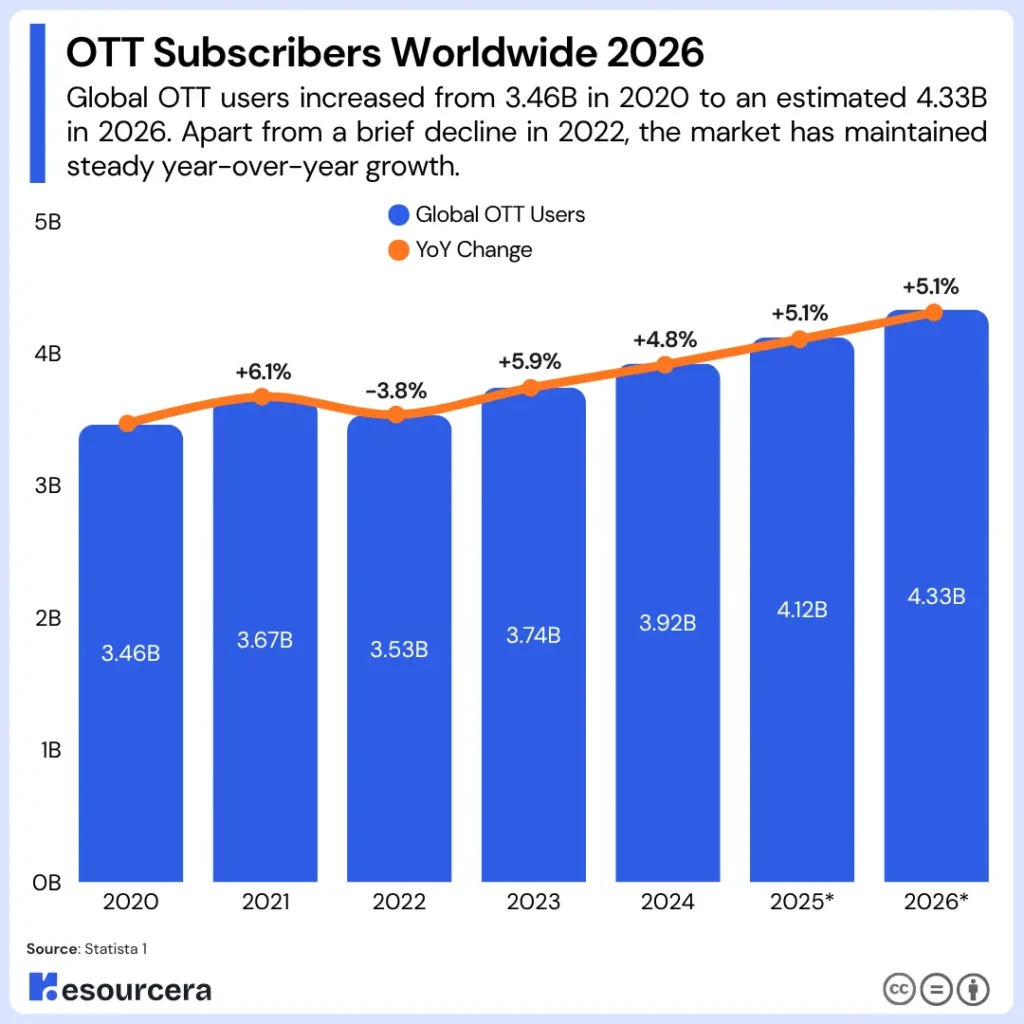
The table below tracks worldwide OTT user growth from 2020 through 2026.
| Year | Global OTT Users | YoY Change |
|---|---|---|
| 2020 | 3.46 billion | – |
| 2021 | 3.67 billion | +6.1% |
| 2022 | 3.53 billion | -3.8% |
| 2023 | 3.74 billion | +5.9% |
| 2024 | 3.92 billion | +4.8% |
| 2025 | 4.12 billion | +5.1% |
| 2026* | 4.33 billion | +5.1% |
*Projected figures. (Source: Statista 1)
After a dip between 2021 and 2022, the global OTT user base recovered steadily, adding around 200 million users each year.
Top Streaming Services by Subscribers 2026
Netflix leads the global streaming market with 325 million paid subscribers as of December 2025.
Amazon Prime Video appears second in most rankings at approximately 250 million.
HBO Max overtook Disney+ in early 2026, reporting 140 million subscribers against Disney+’s 131.6 million. That reversal matters because Disney+ was the most anticipated streaming launch in years when it debuted in 2019, reaching 164.2 million subscribers by early 2023.
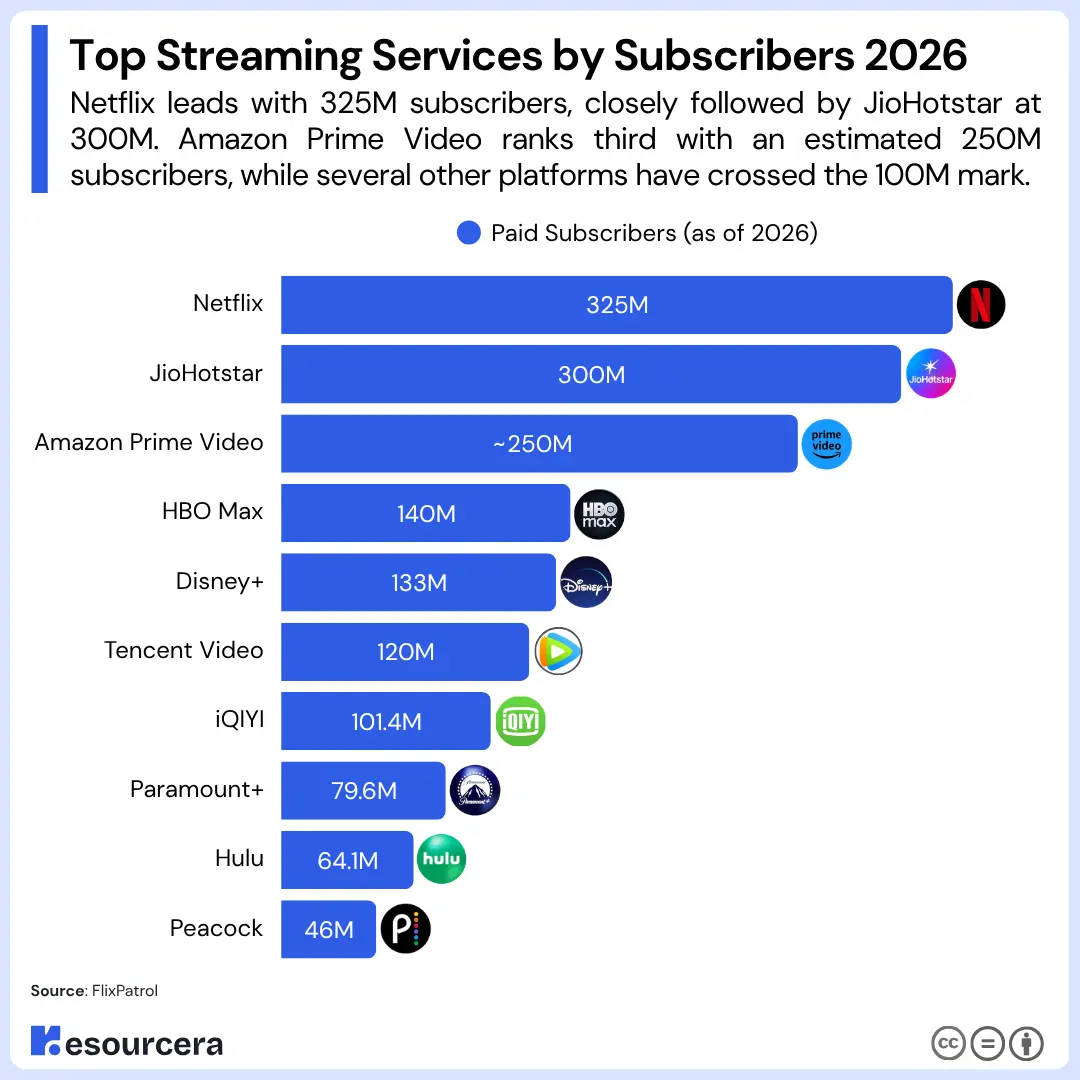
The table below ranks the top 10 streaming services worldwide by subscriber count, using each platform’s most recently reported figures.
| Platform | Paid Subscribers (as of 2026) |
|---|---|
| Netflix | 325 million |
| JioHotstar | 300 million |
| Amazon Prime Video | ~250 million |
| HBO Max | 140 million |
| Disney+ | 133 million |
| Tencent Video | 120 million |
| iQIYI | 101.4 million |
| Paramount+ | 79.6 million |
| Hulu | 64.1 million |
| Peacock | 46 million |
(Source: FlixPatrol)
Note: Amazon’s figure (250M) dates to 2025 and covers all Prime members, not video-only subscribers. Tencent Video, iQIYI, and JioHotstar operate primarily in China and India.
OTT Subscribers Statistics by Platform
Each major streaming platform tells a different growth story, from Netflix’s unbroken climb to Disney+’s peak-and-settle pattern.
Here is how the three biggest Western platforms have grown quarter by quarter.
Netflix Subscribers Statistics
Netflix crossed 325 million paid subscribers as of early 2026, up from 301 million a year prior. The table below tracks Netflix’s paid subscriber count by quarter from Q1 2023 through Q4 2025.
| Quarter | Paid Subscribers | Net Adds |
|---|---|---|
| Q1 2023 | 232.5 million | +1.8M |
| Q2 2023 | 238.4 million | +5.9M |
| Q3 2023 | 247.2 million | +8.8M |
| Q4 2023 | 260.3 million | +13.1M |
| Q1 2024 | 269.6 million | +9.3M |
| Q2 2024 | 277.7 million | +8.1M |
| Q3 2024 | 282.7 million | +5.1M |
| Q4 2024 | 301.6 million | +18.9M |
| Q4 2025 | 325+ million | 23.4M |
From Q1 2025, Netflix stopped reporting quarterly membership numbers, shifting focus to revenue and operating margin instead. Q4 2024 delivered 18.9 million net adds, the largest single quarter in the platform’s history, driven by Squid Game Season 2 and live sports. Netflix added roughly 41 million paid subscribers across all of 2024, but the total growth in 2025 did not match.
Disney+ Subscribers Statistics
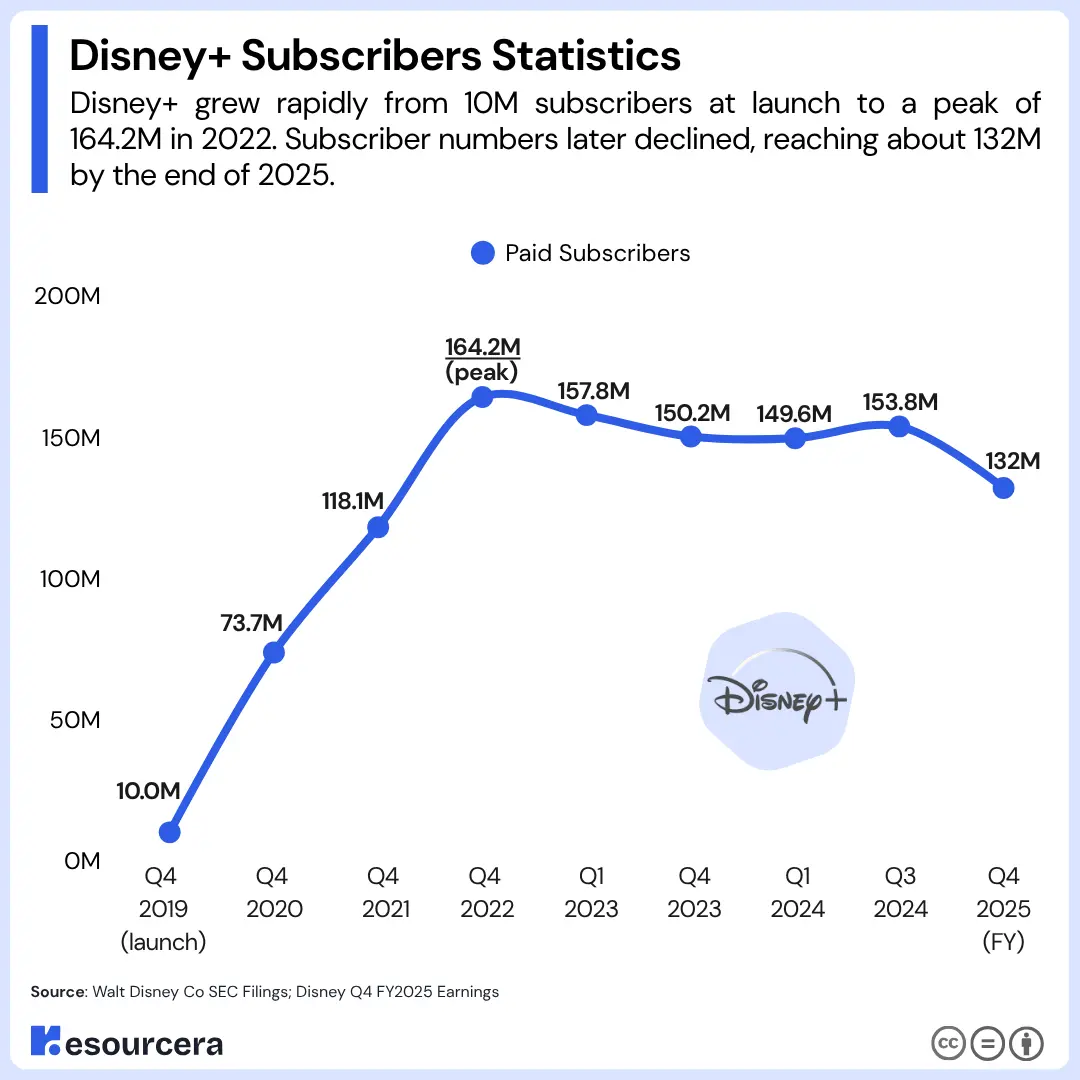
Disney+ reached 164.2 million subscribers at its peak in Q4 2022, then dropped, partially recovered, and settled at 132 million by September 2025 after price increases and content library cuts.
The table below tracks Disney+’s paid subscriber count from launch through its most recently reported figure.
| Quarter | Paid Subscribers |
|---|---|
| Q4 2019 (launch) | 10.0 million |
| Q4 2020 | 73.7 million |
| Q4 2021 | 118.1 million |
| Q4 2022 | 164.2 million (peak) |
| Q1 2023 | 157.8 million |
| Q4 2023 | 150.2 million |
| Q1 2024 | 149.6 million |
| Q3 2024 | 153.8 million |
| Q4 2025 (FY) | 132 million |
Sources: Walt Disney Co SEC Filings; Disney Q4 FY2025 Earnings
Disney+ peaked at 164.2 million in Q4 2022 and has not recovered that figure since. The removal of Disney+ Hotstar from the bundle following the Star India transaction in late 2024 directly reduced reported subscriber counts in Q4 2024 and beyond, making those figures not directly comparable with earlier quarters.
Amazon Prime Video Subscribers Statistics
Amazon Prime Video does not publish standalone subscriber figures. The only publicly confirmed number is 250 million global Prime members as of 2025.
| Data Point | Figure | Date |
|---|---|---|
| Global Prime Members | 250 million | 2025 |
| US Prime Members | ~180 million (est.) | 2024 |
| Countries Available | 240+ | 2024 |
| Prime Video is included with Prime | Yes, by default | Ongoing |
Amazon has never disclosed a Prime Video-only subscriber count. The 250 million figure covers all Prime members as of 2025. Prime Video ships with every Prime membership by default, so no direct comparison with Netflix or Disney+ is possible.
Source: Amazon Prime Video Subscribers Statistics
Peacock Subscribers
Based on its increase of 5 million subscribers between Q1 2025 and Q1 2026, Peacock added an average of approximately 13,700 paid subscribers per day.
According to Peacock Statsistics, In Q1 2024 Peacock had 34 million paid subscribers and 46 million in Q1 2026. This means its subscriber base increased by 12 million, or approximately 35.3%, in two years.
OTT Subscribers by Region
North America leads in OTT penetration, but Asia-Pacific drives overall volume.
North America holds 41% of the global OTT market, with over 310 million active users and 83% household penetration. The US drives the overwhelming majority of that figure. At 83% household penetration, this is the most saturated OTT market in the world.
Asia-Pacific accounts for 29% of global OTT subscribers and 43% of all mobile streaming traffic worldwide. In markets like India, Indonesia, the Philippines, and Vietnam, smartphones are the primary screen for most households.
Europe holds 21% of the global market share, with 53% smart TV penetration and 48% of users accessing OTT across multiple devices.
| Region | OTT Subscribers/Viewers | Market Share |
|---|---|---|
| North America | 310M+ active users (83% household penetration) | 41% |
| Asia-Pacific | 29% of global subscribers; 43% of mobile streaming traffic | 29% |
| Europe | 53% smart TV penetration; 48% multi-device users | 21% |
| Latin America | – | 6% |
| Middle East & Africa | Mobile-first; 64% smartphone penetration in urban areas | 3% |
Sources: Market Reports World; eMarketer
Note: Share figures are sourced from Market Reports World (2026). Figures vary across research firms depending on methodology and market scope.
OTT Subscribers by Age Group
Paying for a streaming subscription is overwhelmingly a 25 to 40-year habit. This age group accounts for 73% of all OTT subscribers globally, and the data drops off sharply on either side of that window.
The 30–40 bracket accounts for a combined 55% of subscribers. The near-zero figures for under-18s and over-50s reflect subscription ownership, not actual viewership; many in those groups watch on shared family accounts.
| Age Group | Share of OTT Subscribers |
|---|---|
| 18–25 | 14% |
| 25–30 | 18% |
| 30–35 | 27% |
| 35–40 | 28% |
| 40–45 | 10% |
| 45–50 | 2% |
| Above 50 | 0.9% |
Source: ResearchGate, InPlayer, 2017; Pew Research Centre, 2025
OTT Market Share by Platform
Amazon leads the US streaming market by a thin margin, with Netflix close behind.
Here is how the top platforms compare by market share.
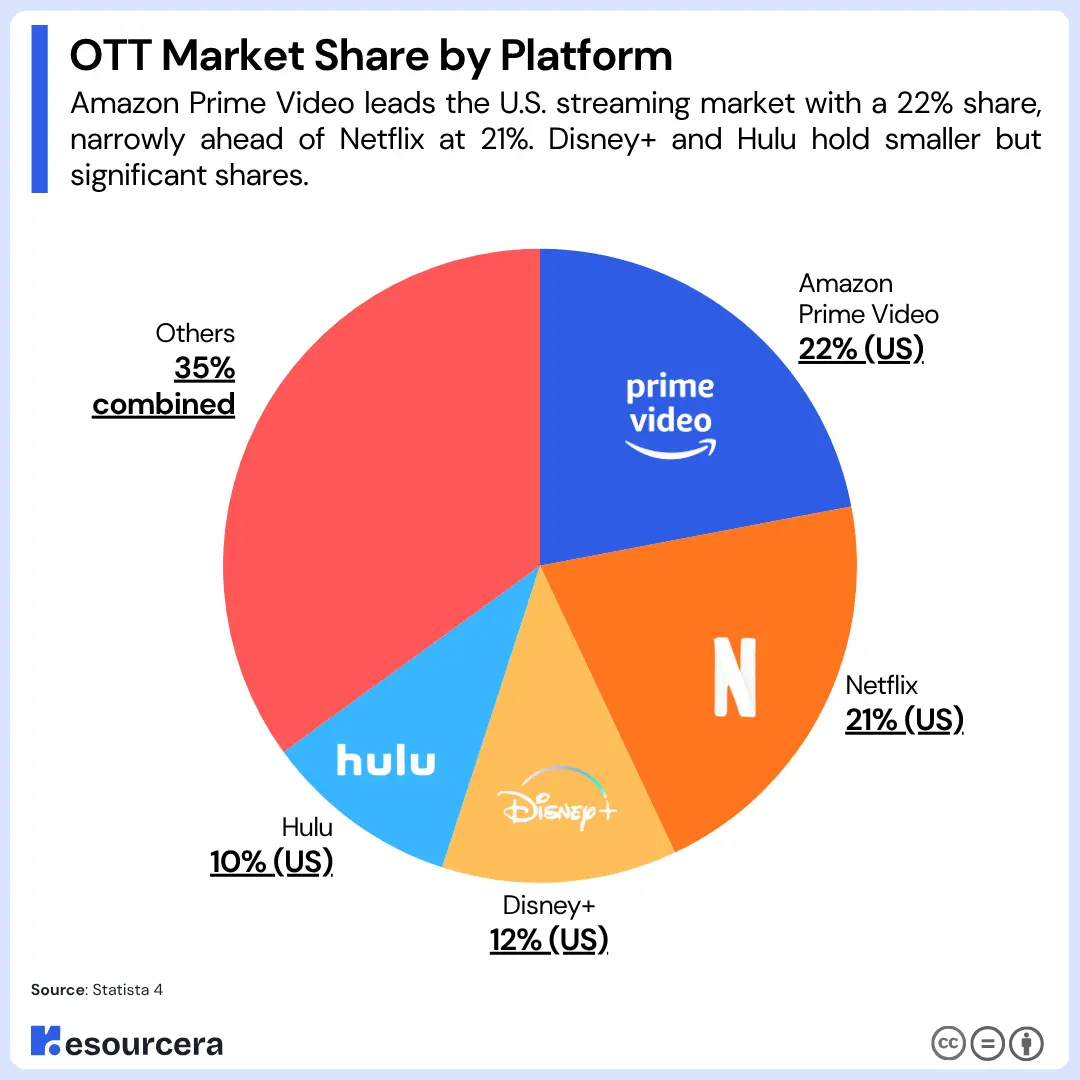
| Platform | Market Share | Subscribers (2026) |
|---|---|---|
| Amazon Prime Video | 22% (US) | 250M globally |
| Netflix | 21% (US) | 325M globally |
| Disney+ | 12% (US) | 131.6M globally (Q4 2025) |
| Hulu | 10% (US) | 64.1M (Q4 2025) |
| Others | 35% combined | – |
Sources: Statista 4
Amazon tops the US market at 22%, but that figure is largely a product of how Prime membership works in America.
Netflix and Amazon together hold just under 43% of the US market. The remaining 57% is split across a crowded field of platforms. That fragmentation explains why subscriber fatigue and multi-subscription households have become the defining challenge for the industry in 2026.
Time Spent on OTT Platforms
Americans are spending more time on OTT platforms every year. In 2022, the average US user spent 70 minutes per day on subscription streaming platforms, up from just 44 minutes in 2018. That is a 59% increase in four years.
The table below tracks average daily viewing time on subscription OTT platforms in the US from 2018 to 2022.
| Year | Avg. Daily Time Spent on OTT (U.S.) |
|---|---|
| 2018 | 44 minutes |
| 2019 | 51 minutes |
| 2020 | 62 minutes |
| 2021 | 67 minutes |
| 2022 | 70 minutes |
Source: Statista 5
The biggest single-year jump was 11 minutes, between 2019 and 2020, driven by COVID-19 lockdowns. Growth slowed after that but did not reverse. At 70 minutes per day, Americans now spend more than an hour on streaming platforms daily, and that baseline shows no sign of dropping.
Wrap Up
The OTT industry has 4.33 billion subscribers in 2026 and a market worth $352.96 billion. The growth phase is not over, but it has matured.
Netflix leads at 325 million paid subscribers. HBO Max has overtaken Disney+. Asian platforms have each crossed 100 million.
When talking about the future, the upcoming growth will come from Asia-Pacific, Latin America, and the Middle East, where streaming is still becoming a household habit. In markets like the US and Western Europe, the battle has shifted from acquisition to retention.
Over the next few years, ad-supported tiers, AI recommendations, and intensifying competition for screen time will shape how platforms grow.