
Global retail e-commerce sales reach $6.88 trillion in 2026, up from $5.08 trillion in 2022.
The growth rate behind that number keeps falling, from 9.6% in 2023 to 7.2% this year, and a slowing rate is easy to read as a market running out of room.
The percentages hide what the dollars show. E-commerce adds $461 billion in 2026 and will add $511 billion in 2028, the largest single-year gain anywhere in the forecast.
A smaller percentage of a much larger base still produces record absolute growth.
This article covers how much the world spends online, how fast that share of retail is rising, which regions and countries drive the total, what people buy and on which devices, how they pay, where they abandon checkout, and which platforms capture the spending.
E-commerce Statistics 2026: Key Highlights
- Global retail e-commerce sales reach $6.88 trillion in 2026 and $7.89 trillion by 2028.
- E-commerce accounts for 21.8% of all retail sales worldwide in 2026, up from 18.8% in 2021.
- 2.86 billion people shop online in 2026, roughly 33% of the world’s population.
- The average online shopper spends about $2,406 a year.
- Asia Pacific generates 54.46% of global e-commerce revenue.
- China, the United States, and Western Europe together account for 80.5% of global online sales.
- Global B2B e-commerce reaches $36.16 trillion in 2026, more than five times the retail total.
- Smartphones handle 72.67% of all online transactions.
- Digital wallets carry 43.92% of online payment volume, more than any other method.
- 70% of online shopping carts are abandoned before purchase.
- Amazon holds 37.6% of US e-commerce sales, roughly six times its nearest competitor.
- Online payment fraud costs merchants $38 billion a year.
Global E-commerce Market Size
Global retail e-commerce sales total $6.88 trillion in 2026. That is a 7.2% increase over 2025 and puts the market $1.8 trillion above where it stood in 2022.
The forecast runs to $7.89 trillion by 2028. Across the full 2022 to 2028 period, sales rise 55.2%, which works out to a compound annual growth rate of 7.6%.
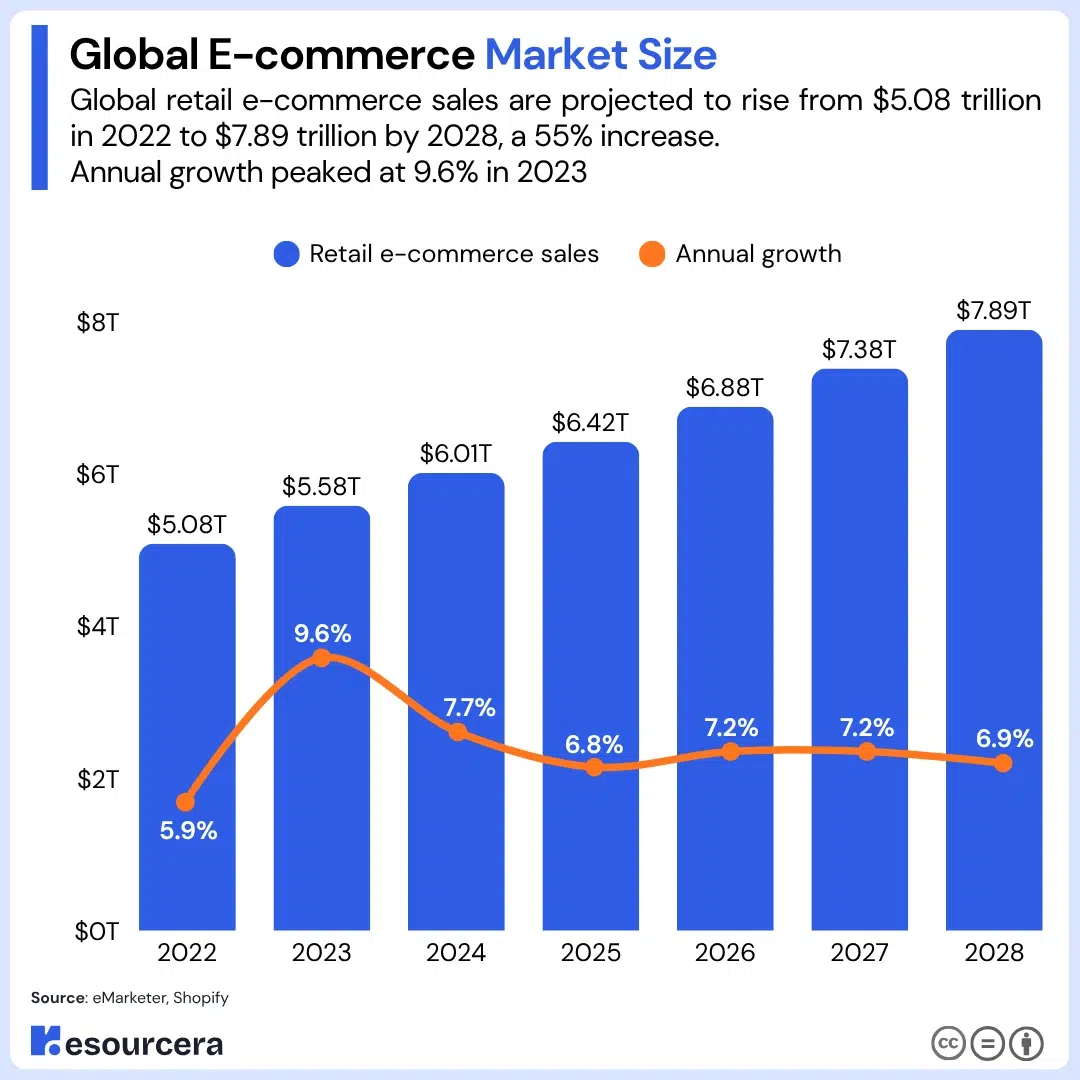
The table below tracks total sales, the annual percentage change, and the dollars added each year.
| Year | Retail e-commerce sales | Annual growth |
|---|---|---|
| 2022 | $5.08 trillion | 5.9% |
| 2023 | $5.58 trillion | 9.6% |
| 2024 | $6.01 trillion | 7.7% |
| 2025 | $6.42 trillion | 6.8% |
| 2026 | $6.88 trillion | 7.2% |
| 2027 | $7.38 trillion | 7.2% |
| 2028 | $7.89 trillion | 6.9% |
The growth rate peaked at 9.6% in 2023 and has not returned to that level since. It bottomed at 6.8% in 2025 before recovering to 7.2% in 2026.
The weakest year for absolute growth was 2025, at $412 billion added. Every year after that adds more than the year before it, and 2028 adds the most of any year in the series at $511 billion. Percentage growth falls because the base is expanding faster than the increments.
Total online spending increases by $2.81 trillion between 2022 and 2028. For context, that increase alone is larger than the entire e-commerce market was in 2018.
E-commerce Share of Retail Sales
E-commerce accounts for 21.8% of global retail sales in 2026. That means slightly more than one in every five retail dollars worldwide is now spent online.
The share has climbed 3 percentage points since 2021 and is set to reach 22.6% in 2027. The pace has been steady rather than explosive, averaging about 0.63 percentage points a year.
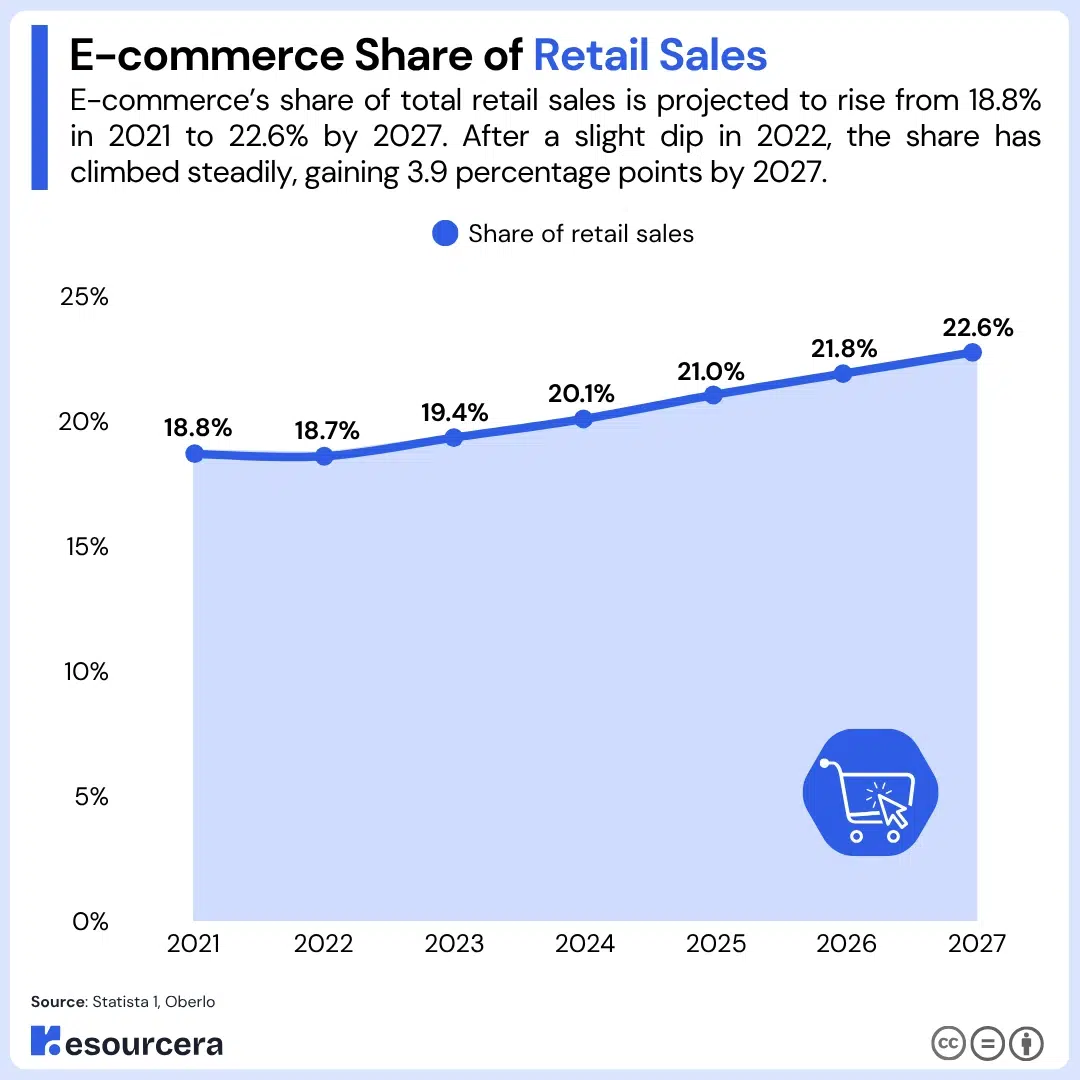
This table shows the online share of total retail sales and the change in percentage points each year.
| Year | Share of retail sales | Change |
|---|---|---|
| 2021 | 18.8% | Base year |
| 2022 | 18.7% | -0.1 pts |
| 2023 | 19.4% | +0.7 pts |
| 2024 | 20.1% | +0.7 pts |
| 2025 | 21.0% | +0.9 pts |
| 2026 | 21.8% | +0.8 pts |
| 2027 | 22.6% | +0.8 pts |
2022 is the only year in the run where the share fell. The decline was 0.1 percentage points, a correction after pandemic-era online buying pulled forward demand that returned to physical stores the following year.
From 2023 onward, the share has gained between 0.7 and 0.9 points annually without interruption.
2024 was the first year e-commerce crossed 20% of global retail.
E-commerce share of retail in the United States
The US online share sits below the global figure and has done so throughout the period. In 2026, it reaches 18%, which is 3.8 percentage points behind the worldwide share of 21.8%.
The gap exists because the global average is pulled upward by China, where online penetration is far higher than in most Western markets.
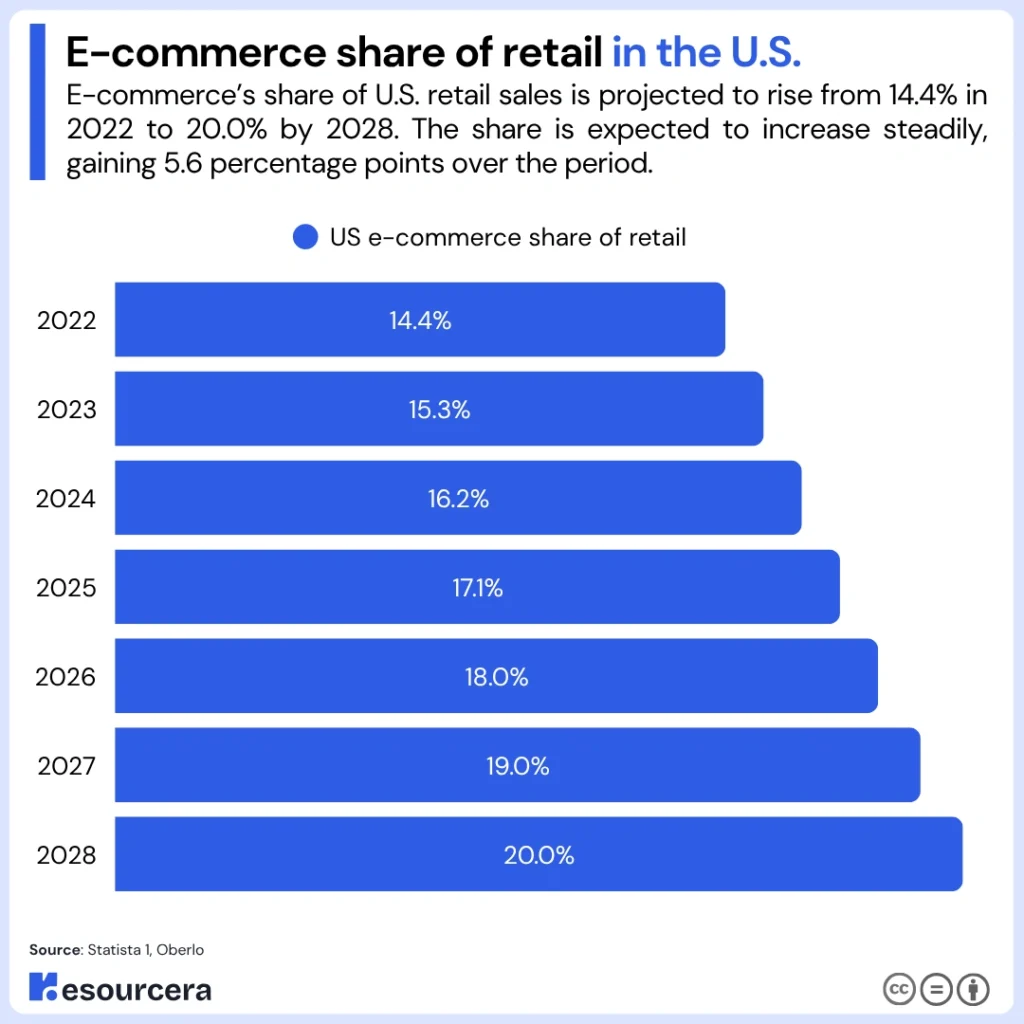
The table below tracks the US share.
| Year | US e-commerce share of retail | Change |
|---|---|---|
| 2022 | 14.4% | Base year |
| 2023 | 15.3% | +0.9 pts |
| 2024 | 16.2% | +0.9 pts |
| 2025 | 17.1% | +0.9 pts |
| 2026 | 18.0% | +0.9 pts |
| 2027 | 19.0% | +1.0 pts |
| 2028 | 20.0% | +1.0 pts |
The US share is rising faster than the global share, at 0.9 to 1.0 points a year against 0.63 globally. It closes some of the gap but does not eliminate it, reaching 20% in 2028.
(Sources: Statista 1, Oberlo, eMarketer)
Online Shopper Statistics
2.86 billion people shop online in 2026, which is about 33% of the world’s population. That is a 3.3% increase over the previous year, and the total is on track to pass 3 billion.
Spending per shopper is doing the heavier lifting: the average online buyer spends roughly $2,406 across the year in 2026, up from about $2,318 in 2025.
Number of online shoppers worldwide
More than 75% of internet users made a purchase online in 2024. By 2028, half of the global population aged 14 and over is expected to shop online.
Shopper growth of 3.3% against sales growth of 7.2% means the market is expanding on two tracks. New buyers are still entering, but existing buyers are ordering more often and spending more per order. In mature markets, the second effect now matters more than the first.
Online buyers by country
China has the largest online shopper base by a wide margin. The figures below cover the two largest single markets.
| Country | Online buyers |
|---|---|
| China | 958 million |
| United States | 295.4 million |
The United States generates $3,486 in online retail revenue per person aged 15 and over, the highest of any market and 2.72 times the average across the ten largest e-commerce markets. India sits at the other end at $62.55.
The spread is 55.7 times between the top and bottom of the list. Buyer numbers and spending intensity move in opposite directions; the markets with the most online shoppers are generally the ones where each shopper spends the least.
The table below shows annual online retail revenue per person aged 15 and over, and how each market compares to the top-ten average of $1,282.
| Country | Revenue per person | Difference vs top 10 average |
|---|---|---|
| United States | $3,486.00 | +171.9% |
| United Kingdom | $1,732.00 | +35.1% |
| Canada | $1,446.00 | +12.8% |
| South Korea | $1,445.00 | +12.7% |
| Japan | $1,346.00 | +5.0% |
| Germany | $1,164.00 | -9.2% |
| France | $864.60 | -32.6% |
| Indonesia | $187.70 | -85.4% |
| India | $62.55 | -95.1% |
The United States is twice the level of the United Kingdom, the second-placed market. Four markets cluster tightly between $1,164 and $1,446, which covers Canada, South Korea, Japan and Germany. France sits a third below the average despite being the eighth-largest market by total revenue.
India is the clearest gap between size and intensity. It ranks fifth globally by market value and grows fastest at 17.92%, yet spending per person is 95.1% below the top-ten average.
That gap is the reason India carries an 18.7% forecast CAGR through 2033 while the United Kingdom and Canada sit under 4%. Room to grow is a function of how little each buyer currently spends, not how many buyers exist.
Buyer counts confirm the same pattern where they are available. China has roughly 958 million online shoppers against 295.4 million in the United States, a gap of more than three to one, yet the American market produces $1.41 trillion against China’s $1.96 trillion.
Chinese shoppers average $1,891 each per year. Globally, 2.86 billion people shop online, about 33% of the world’s population.
(Sources: Capital One Shopping, US Census Bureau, World Bank, Statista 2, eMarketer, Statista 1)
E-commerce Statistics by Region
Asia Pacific generates 54.46% of global e-commerce revenue, more than every other region combined.
Its lead rests on population scale, mobile-first internet access, and the super-app ecosystems that fold payments, shopping, and content into single platforms.
Asia Pacific leads global e-commerce revenue
China is the single largest contributor within the region, with an e-commerce base of about $2.8 trillion. India follows at roughly $350 billion.
India’s UPI payment system processed 131 billion transactions in 2024, which has pulled first-time buyers into online retail without requiring credit card ownership.
Asia Pacific also added 70% of the 150 million new middle-class households formed globally between 2020 and 2025, and customer acquisition costs in these markets run at roughly one tenth of those in mature economies.
Regional growth rates through 2031
South America is the fastest-growing region despite its smaller base. The table below shows forecast annual growth by region.
| Region | Forecast CAGR to 2031 |
|---|---|
| South America | 18.12% |
| Global average | 16.46% |
| North America | Above 14% |
| Europe | Above 14% |
Brazil drives the South American figure. Its Pix instant payment system logged 42 billion transactions in 2024, and MercadoLibre committed $2.5 billion to add 50 fulfillment centers across the region.
North America and Europe grow more slowly because both are already saturated. Growth there comes from delivery speed, subscription models, and basket size rather than from new customers.
Europe’s single market reduces customs friction on cross-border trade, while Germany’s logistics network and invoice-based payment habits support one of the region’s largest national markets.
The Middle East is scaling quickly, with the UAE and Saudi Arabia offering duty-free e-commerce zones and cash-on-delivery support.
Africa holds the largest untapped potential, where mobile money services like M-Pesa work around low banking penetration, though logistics gaps and currency volatility still limit growth.
Largest and Fastest-Growing E-commerce Markets by Country
China, the United States, and Western Europe account for 80.5% of global e-commerce sales. Remove China alone and online sales drop from 20% of total retail to 12.8%.
The fastest growth happens elsewhere. Southeast Asia and Latin America post double-digit annual gains from much smaller bases, and none of the top-growth markets appear in the list of largest markets.
E-commerce market size by country
China is the world’s largest e-commerce market at $1.96 trillion in 2026, followed by the United States at $1.41 trillion. They are the only two countries with markets above $1 trillion, and the gap between them is $545 billion.
China and the United States together make up 79.1% of the top ten markets’ combined value, while the remaining eight countries share just over 20% between them. China alone is 9.1 times the size of Japan, the third-largest market.
The table below ranks the ten largest e-commerce markets by 2026 revenue, with each country’s share of the top ten and its growth rate for the year.
| Rank | Country | 2026 revenue | Share of top 10 | 2026 growth |
|---|---|---|---|---|
| 1 | China | $1,958.28 billion | 45.94% | 10.51% |
| 2 | United States | $1,413.30 billion | 33.16% | 14.55% |
| 3 | Japan | $214.03 billion | 5.02% | 12.33% |
| 4 | United Kingdom | $136.60 billion | 3.20% | 3.97% |
| 5 | India | $126.89 billion | 2.98% | 17.92% |
| 6 | Germany | $113.53 billion | 2.66% | 8.86% |
| 7 | South Korea | $87.22 billion | 2.05% | 9.78% |
| 8 | France | $73.93 billion | 1.73% | 12.60% |
| 9 | Canada | $70.53 billion | 1.65% | 3.74% |
| 10 | Indonesia | $67.99 billion | 1.60% | 12.10% |
The top five markets hold 90.3% of the value contained in the top ten, and the five largest countries account for 85.5% of global e-commerce revenue while producing 53.3% of world GDP.
Growth rankings invert the size rankings. India is the smallest of the top five, but the fastest-growing at 17.92%, and it carries a forecast CAGR of 18.7% through 2033, the highest of any major market.
The United Kingdom and Canada sit at the other end, both under 4%, which is what saturation looks like in practice. China grows at 10.51% despite already converting 26.1% of its total retail revenue online.
Per-shopper spending separates the two leaders more than raw size does. The United States generates $3,486 in online revenue per capita, the highest of any market, against an average of $1,282 across the ten largest markets. China’s figure is $1,891 per online shopper. The US market is smaller than China’s, but each American buyer spends far more.
Outside the top ten, Spain is projected at $40.40 billion and Mexico at $47.79 billion in 2026, with Mexico growing 17.3%. Sweden leads the Nordics at $14.75 billion.
(Sources: Capital One Shopping, US Census Bureau, Ecommerce Europe, Korean Ministry of Data and Statistics)
Fastest-growing e-commerce markets
Growth leaders are concentrated in Southeast Asia and Latin America. The table below shows forecast retail e-commerce growth for the leading markets.
| Country | Annual growth |
|---|---|
| Philippines | 23.0% |
| Thailand | 20.0% |
| Malaysia | 15.5% |
| Ecuador | 14.6% |
| Uruguay | 14.4% |
Mexico, Russia and India are the only large economies posting standout growth alongside these smaller markets.
Looking further out, India ranks first among 20 countries for retail e-commerce development between 2023 and 2027, with a compound annual growth rate of 14.1%. Argentina and Brazil follow at above 13.6%. The global retail e-commerce CAGR over the same period is 11.16%.
(Sources: eMarketer, Shopify, International Trade Administration)
B2B E-commerce Statistics
Global B2B e-commerce reaches $36.16 trillion in 2026, more than five times the size of the retail e-commerce market. B2B is the larger half of online commerce by a wide margin, and it rarely appears in consumer-facing coverage.
The market has grown 143% since 2020 and carries a compound annual growth rate of 15.37% between 2019 and 2026, roughly double the retail rate.
The table below tracks B2B gross merchandise value and its annual growth.
| Year | B2B e-commerce value | Annual growth |
|---|---|---|
| 2019 | $13.29 trillion | Base year |
| 2020 | $14.87 trillion | 11.9% |
| 2021 | $17.80 trillion | 19.7% |
| 2022 | $21.01 trillion | 18.0% |
| 2023 | $24.45 trillion | 16.4% |
| 2024 | $28.08 trillion | 14.8% |
| 2025 | $32.11 trillion | 14.4% |
| 2026 | $36.16 trillion | 12.6% |
B2B growth peaked at 19.7% in 2021 and has decelerated every year since, following the same pattern as retail. Heavy industry drives most of this value, led by advanced manufacturing, energy, healthcare, and professional business services.
More than 90% of B2B companies have shifted to a virtual sales model since 2020. South Korea and Japan are the two clear exceptions, where only 13% and 15% of firms, respectively, have moved away from face-to-face meetings.
Regional split of B2B e-commerce
Asia Pacific accounts for 80% of B2B market share by 2026, a far higher concentration than its 54.46% share of overall e-commerce revenue.
The strongest growth in B2B value comes from smaller markets, particularly Latin America and the Middle East, which are expanding from low bases. Within the overall e-commerce market, B2B holds more than 65% of revenue share, and the segment is advancing at a 17.43% CAGR, faster than B2C.
(Sources: International Trade Administration, Mordor Intelligence, Precedence Research)
E-commerce Statistics by Product Category
Consumer electronics is the largest online category, with $976 billion in spending in 2026. Fashion follows closely at $957 billion, and food and beverages at $905 billion.
Those three categories account for roughly 71% of spending across the seven largest categories. The gap between first and third is only $71 billion, so category leadership is far less settled than the ranking suggests.
The table below shows estimated online spending by category in 2026.
| Category | Estimated spending | Share of listed categories |
|---|---|---|
| Consumer electronics | $976 billion | 24.3% |
| Fashion | $957 billion | 23.8% |
| Food and beverages | $905 billion | 22.5% |
| DIY and hardware | $395 billion | 9.8% |
| Furniture | $280 billion | 7.0% |
| Media | $257 billion | 6.4% |
| Beauty and personal care | $251 billion | 6.2% |
Consumer electronics holds 27.88% of B2C category revenue on a value basis, reflecting high average order values rather than order volume.
Food and beverages is the fastest-growing category at an 18.86% CAGR, driven by quick commerce and online grocery. Quick-commerce operators raised $3 billion in 2024 to fund micro-fulfillment networks.
Clothing and footwear also grow quickly. Fast-fashion cycles, direct-to-consumer brands, and virtual try-on tools have reduced hesitation around fit and quality, which were the historic barriers to buying apparel online.
Home appliances lead on a different measure, holding 20% of revenue share in some segment models, supported by smart home adoption and the tendency of buyers to research high-value purchases online before committing.
(Sources: Shopify)
Mobile Commerce Statistics
Smartphones handle 72.67% of all online transactions. Mobile commerce revenue reaches $2.74 trillion in 2026, up from $500 billion in 2017, a 5.5x increase in nine years.
Mobile now represents close to 40% of all retail e-commerce value. That figure combines two separate forecast series and should be read as an approximation rather than a published number.
Global mobile commerce revenue, 2017 to 2028
The table below tracks mobile commerce revenue and its share of total retail e-commerce sales where both series overlap.
| Year | Mobile commerce revenue | Share of retail e-commerce |
|---|---|---|
| 2017 | $500 billion | NA |
| 2018 | $660 billion | NA |
| 2019 | $810 billion | NA |
| 2020 | $1.10 trillion | NA |
| 2021 | $1.40 trillion | NA |
| 2022 | $1.48 trillion | 29.1% |
| 2023 | $1.71 trillion | 30.6% |
| 2024 | $2.07 trillion | 34.5% |
| 2025 | $2.51 trillion | 39.1% |
| 2026 | $2.74 trillion | 39.8% |
| 2027 | $3.02 trillion | 40.9% |
| 2028 | $3.35 trillion | 42.5% |
Mobile commerce grows at an 18.88% CAGR from 2017 to 2028, well above the 7.6% rate for retail e-commerce overall. Its share of online sales rises from 29.1% in 2022 to a projected 42.5% in 2028.
Smartphones handle 72.67% of transactions but under 40% of spending, which means mobile orders are smaller and more frequent than desktop orders. Mobile phones also account for 77% of e-commerce website visits.
Conversion rates by device
Mobile leads in traffic but trails in conversion. The table below compares conversion rates across devices.
| Device | Conversion rate |
|---|---|
| Tablets | 3.1% |
| Desktops | 2.8% |
| Smartphones | 2.3% |
| Overall average | 2.5% |
Tablets convert at 3.1%, the highest of any device, despite being a shrinking share of traffic. Smartphones sit lowest at 2.3%, a 0.8 point gap behind tablets. Biometric authentication has narrowed the difference by cutting checkout abandonment on mobile by 25%.
Mobile shopping adoption by country
South Korea has the highest mobile shopping frequency in the world, with 44.4% of internet users making a retail purchase on a phone at least once a week.
The global average is 29.9%, so nearly one in three online users worldwide buys something on a phone every week.
The spread between the highest and lowest markets is 23.1 percentage points. South Korean users buy on mobile weekly at 2.08 times the rate of Japanese users, despite the two countries sitting side by side.
The table below shows the share of internet users making weekly mobile purchases and how each market compares to the global average.
| Country | Weekly mobile buyers | Difference vs global |
|---|---|---|
| South Korea | 44.4% | +48.5% |
| Mexico | 35.3% | +18.1% |
| United States | 35.2% | +17.7% |
| China | 33.7% | +12.7% |
| United Kingdom | 32.5% | +8.7% |
| Global average | 29.9% | Baseline |
| Canada | 29.7% | -0.7% |
| Japan | 21.3% | -28.8% |
Frequency and ownership are different measures. 92% of Chinese shoppers and 88% of Indian shoppers use a phone to shop at all, against 73% in the United States, yet Americans buy weekly on mobile at a higher rate than Chinese users. Broad adoption does not automatically produce frequent purchasing.
Mobile’s share of national e-commerce revenue follows the same order. South Korea takes 74.4% of its online sales through phones, Germany 64%, France 61%, and the United States 39.8%.
Globally, 2.45 billion people now shop primarily on a smartphone, and 79% of smartphone owners use their device to shop.
(Sources: Capital One Shopping, Statista 3, Pew Research Center, Sensor Tower, Statista 1, Oberlo, Mordor Intelligence, Shopify)
E-commerce Payment Statistics
Digital wallets carry 43.92% of online payment volume, the largest share of any method. Wallets handled $9.5 trillion in 2024, the year they overtook cards.
Buy now, pay later is the fastest-growing option, expanding at a 19.28% CAGR. Card share is eroding as both alternatives offer lower friction at checkout.
Sovereign payment rails have changed the picture in large markets. India’s UPI processed 131 billion transactions in 2024, and Brazil’s Pix logged 42 billion.
Both systems brought online buyers into e-commerce without requiring credit cards, which is why wallet share is highest in markets with low card penetration.
Embedded finance is extending the trend. Platforms now underwrite small loans using their own transaction data, a capability that raises conversion rates by 18% and generates behavioral data for pricing.
Buy now, pay later adoption and growth
Klarna, Affirm and Afterpay processed $350 billion in 2024 with default rates below 2%. Regulatory disclosure rules in the UK and the US have legitimized the model and removed much of the uncertainty that slowed merchant adoption.
US buy now, pay later transactions tell the clearest growth story.
| Year | US BNPL transaction value |
|---|---|
| 2023 | $116 billion |
| 2024 | $133 billion |
| 2029* | $206 billion |
US volume rose 14% between 2023 and 2024 and is forecast to grow another 55% by 2029. Adoption continues to climb in a market where card ownership is already high, at 3.26 credit cards per capita against 0.99 debit cards.
Payment preferences remain strongly local. 98% of Mexican online shoppers prefer to pay in their local currency, and 84% of German shoppers prefer alternative and local payment methods over international cards.
Germany’s preference for invoice-based and open-banking payments is one reason buy now, pay later took hold there earlier than in most European markets.
(Sources: Mordor Intelligence, J.P. Morgan, Statista 1, Global-e)
Online Shopping Behavior Statistics
34% of shoppers buy something online at least once a week, and 82% buy at least once a month. Weekly buying became a habit during the pandemic and has held since.
Free delivery is the strongest single motivator, cited by 50.6% of shoppers, ahead of discounts and return policies.
How often people shop online
Monthly buying at 82% means most online shoppers are not occasional users. The gap between weekly and monthly buyers, 48 percentage points, represents the group that could be moved to higher frequency through subscriptions, loyalty programs, and replenishment reminders.
81% of online shoppers research a product before buying it. 66% do that research on a PC or laptop at home and 15% on a mobile device, which is the reverse of where the eventual purchase often happens.
Where online shopping journeys begin
Search engines and marketplaces are the two dominant starting points. The table below shows where shoppers begin their journey.
| Starting point | Share of shoppers |
|---|---|
| Search engine | 44% |
| Online stores and marketplaces | 41% |
| Social media | 14% |
Measured differently, marketplaces rank first as the place shoppers begin a product search, at roughly 30%, followed by browsing in-store at 18%, with search engines and brand websites tied at 14% each.
83% of people research online before visiting a physical store, which means online discovery drives offline sales as well as online ones.
Around 15% of global online shoppers now prefer buying directly from brands they trust. In some markets, direct-to-consumer has overtaken marketplaces as the top choice, including Australia at 23%, France at 22%, and Colombia at 20%.
What motivates people to buy online
Delivery economics dominate the list of purchase motivators. The table below ranks the factors shoppers cite.
| Motivator | Share of shoppers |
|---|---|
| Free delivery | 50.6% |
| Coupons and discounts | 39.3% |
| Easy return policy | 33.2% |
| Simple online checkout | 30.6% |
| Customer reviews | 30.5% |
| Next-day delivery | 30.4% |
| Loyalty points | 27.2% |
| Cash on delivery | 19.8% |
| Social likes and comments | 19.4% |
| Eco-friendly credentials | 18.9% |
Free delivery outranks the next factor by 11.3 percentage points. Three of the top six motivators relate to shipping or returns rather than price or product.
Reviews carry unusual weight. 99% of shoppers check reviews before buying, 96% specifically look for negative reviews, and 49% trust customer reviews as much as a personal recommendation from friends or family.
(Sources: Oberlo, Forbes Advisor, International Trade Administration, Search Engine Journal)
Shopping Cart Abandonment Statistics
70% of online shopping carts are abandoned before purchase. The precise figure, averaged across 48 separate studies, is 69.99%, and it has held roughly steady since 2014.
Unexpected costs are the leading cause. 47% of shoppers abandon checkout because of added shipping, taxes, and fees.
The table below ranks the reasons shoppers leave during checkout.
| Reason for abandonment | Share of shoppers |
|---|---|
| Additional costs such as shipping, taxes, and fees | 47% |
| Site required creating an account | 25% |
| Delivery was too slow | 24% |
| Unsatisfactory return policy | 16% |
The top three reasons are all fixable without changing price. Forcing account creation costs a quarter of abandoning shoppers, and guest checkout removes that barrier entirely.
Checkout length is a separate drag. The average e-commerce checkout runs 5.08 steps, and 22% of abandonment is attributed to the process itself rather than to price or product. Cutting checkout to three steps and asking only for essential information reduces that loss.
Abandonment sits alongside the motivator data neatly. Free delivery is the single strongest reason people buy, and unexpected delivery costs are the single strongest reason they do not.
(Sources: Forbes Advisor, Statista 1)
Cross-Border E-commerce Statistics
52% of online shoppers buy from international websites as well as local ones. Cross-border buying is now standard behavior rather than a niche, helped by simpler international shipping and localized checkout.
Willingness to buy abroad varies widely by market. Shoppers in smaller economies buy internationally at far higher rates than those in the largest ones.
Cross-border shopping by country
The table below compares cross-border and local shopping preferences across markets.
| Market | Shopping pattern |
|---|---|
| Mexico | 72% buy from both international and local sites |
| Global average | 52% buy internationally |
| United States | 63% shop primarily from local sites |
| United Kingdom | 63% shop primarily from local sites |
The pattern is consistent. Large domestic markets with deep local assortment produce local-first shoppers, while smaller markets look outward because local supply is thinner.
Returns are a live cost in cross-border trade. The average return rate on apparel and accessories bought from abroad runs at 7% in Australia.
Payment and localization preferences by market
Localization drives conversion more than most merchants expect. 98% of Mexican online shoppers prefer to pay in their local currency, and 84% of German shoppers prefer alternative and local payment methods.
Regulation is the main friction on the merchant side. The OECD’s 15% minimum tax and Europe’s VAT One-Stop Shop have raised compliance costs for cross-border sellers by up to 18%.
India’s equalization levy adds 2% to transactions for platforms without a local subsidiary. Common workarounds such as geo-blocking or local partnerships fragment inventory and reduce the scale advantages that made cross-border selling attractive.
(Sources: Statista 1, Global-e, Mordor Intelligence, J.P. Morgan)
Social Commerce Statistics
Social commerce reaches $2.9 trillion in 2026, a 30.8% increase over the previous year. It is growing roughly four times faster than retail e-commerce overall.
The forecast runs to $8.5 trillion by 2030 at a 29% CAGR, which would nearly triple the market in four years.
Social commerce market size and forecast
Social commerce figures use a broader scope than retail e-commerce and are not directly comparable to the $6.88 trillion retail total.
| Measure | Value |
|---|---|
| 2025 value | $2.22 trillion |
| 2026 value | $2.9 trillion |
| 2030 forecast | $8.5 trillion |
| CAGR 2022 to 2030 | 29% |
Adoption is strongest in Asia. In Thailand, 90% of internet users have bought through social media, with India close behind at 86%.
Social commerce buyers by platform
Facebook remains the largest social commerce platform by buyer count in the US.
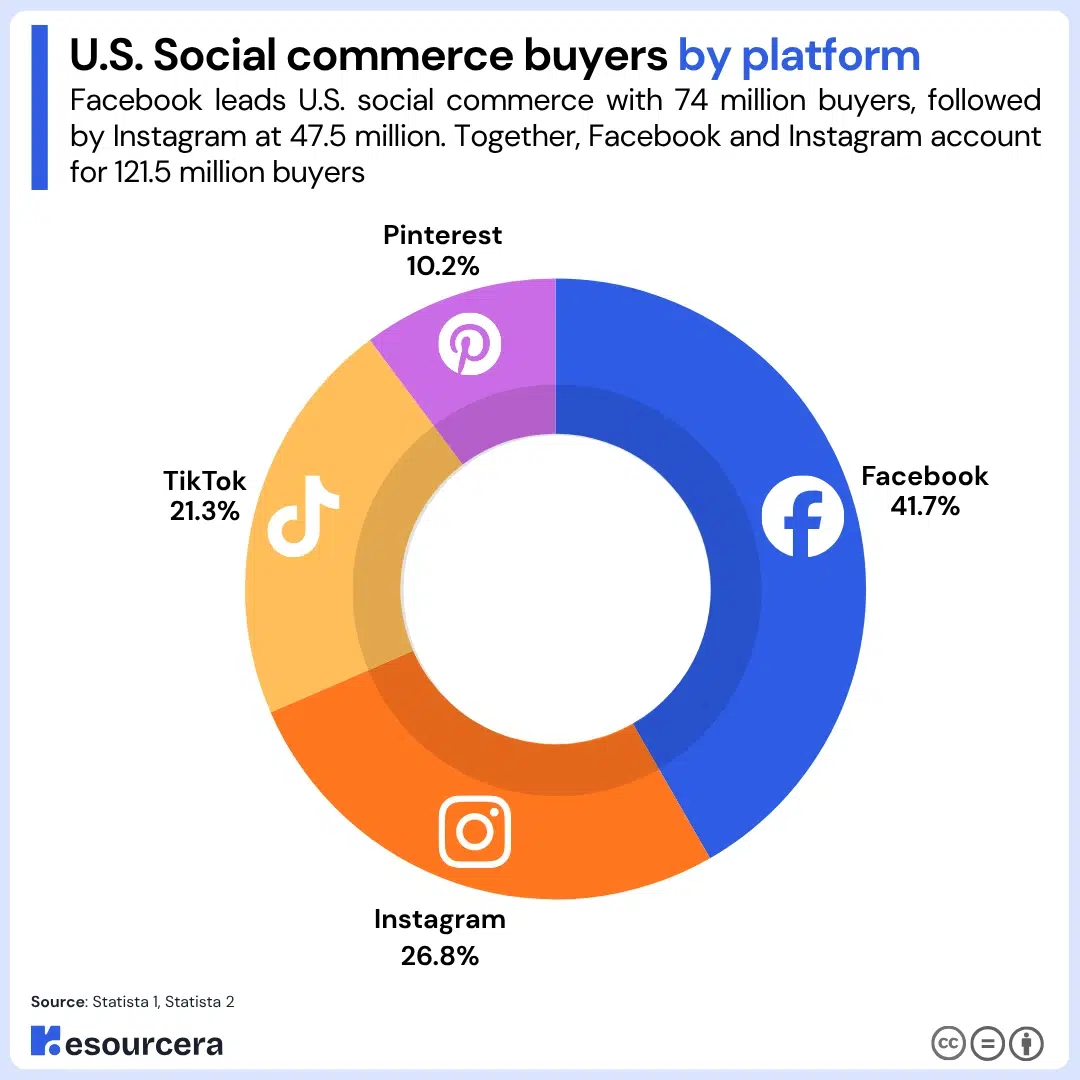
The table below shows expected US buyers by platform in 2026.
| Platform | US social commerce buyers |
|---|---|
| 74 million | |
| 47.5 million | |
| TikTok | 37.8 million |
| 18.1 million |
Facebook’s 74 million buyers represent over 21% of the US population. TikTok Shop generated $20 billion in US gross merchandise value in 2024 on a mobile-native design.
Live commerce adoption splits sharply by region. 40% of US online shoppers have bought through live commerce at least once. In China, India and Thailand, more than seven in ten users have done so, while European adoption remains low.
Buyers aged 18 to 34 are the most active social shoppers, with 73% having bought through social channels, against roughly a quarter of those aged 65 and over.
What people buy through social differs from what they buy on retail sites. Groceries and food supplies are purchased most frequently, by 22% of social shoppers eight or more times a year, followed by personal care at 20%, health and wellness at 19%, and apparel at 18%. Consumer electronics leads on retail sites but not on social platforms.
(Sources: Statista 1, Statista 2, Statista 3, eMarketer, Mordor Intelligence)
Leading E-commerce Companies and Platforms
Amazon, Alibaba, Walmart, JD.com, and Shopify together control roughly 35% of global gross merchandise value. Amazon alone holds 37.6% of US e-commerce sales, about six times the share of its nearest competitor.
Concentration is high at the top, but the market is not closed. Social-first entrants and factory-direct platforms have taken share by changing the buying model rather than competing on assortment.
Leading online retailers by market share
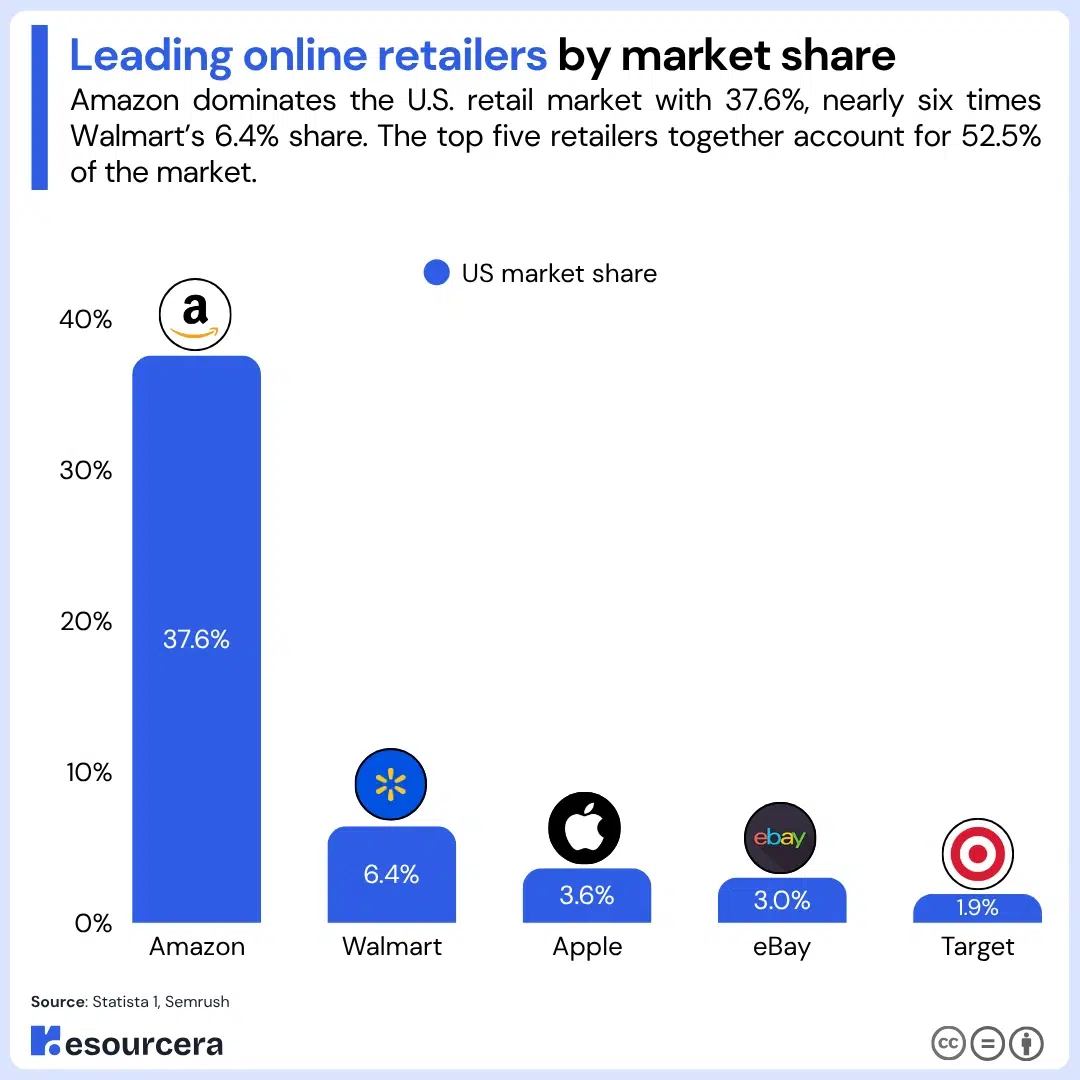
The table below shows US e-commerce market share among leading retailers.
| Retailer | US market share |
|---|---|
| Amazon | 37.6% |
| Walmart | 6.4% |
| Apple | 3.6% |
| eBay | 3.0% |
| Target | 1.9% |
Amazon’s share exceeds the combined total of the next four retailers by more than 22 percentage points. Its position rests on scale infrastructure, including a fleet of around 400,000 delivery vehicles, alongside its third-party seller ecosystem and advertising business.
Most visited e-commerce websites
Amazon leads on traffic as well as sales, drawing about 2.84 billion average monthly visits across its country domains.
Traffic growth tells a different story than traffic volume. The fastest-growing sites are based in Asia: Lazada grew visits by nearly 200%, Flipkart by 90% and AliExpress by 44%. Growth in visitors is concentrated well away from the platforms that lead in absolute terms.
Advertising spend does not map cleanly to traffic. Amazon spent $1.7 billion on advertising, more than four times Walmart’s $414.6 million, while AliExpress spent $322,000 and still posted 44% traffic growth. Brand recognition and marketplace network effects account for more of the outcome than paid media.
Platforms powering online stores
There are more than 28 million e-commerce sites worldwide, up 2.9% from 2024. That works out to roughly 2,200 net new stores added each day.
| Platform | Share of online stores |
|---|---|
| Shopify | 29% |
| Wix | 20% |
Shopify and Wix together power just under half of all online stores. The United States alone hosts 50% of the world’s e-commerce stores, a far higher concentration than its share of online sales.
Alibaba’s Cainiao logistics network spans 200 countries, and regional consolidation continues as operators buy last-mile capacity to close the delivery gap with the largest platforms.
(Sources: Statista 1, Semrush, BuiltWith, Mordor Intelligence)
E-commerce Fraud Statistics
Online payment fraud costs merchants $38 billion a year. Cumulative losses between 2023 and 2027 are forecast to exceed $343 billion, an average of about $69 billion annually.
Fraud losses are rising faster than the spending they target, which is why prevention budgets are growing more quickly than either.
The table below tracks reported and forecast global online payment fraud losses.
| Year | Global fraud losses |
|---|---|
| 2022 | $41 billion |
| 2023 | $48 billion |
| 2024 | $38 billion |
| 2023 to 2027 cumulative | $343 billion |
Reported annual figures vary with measurement scope, but the cumulative forecast of $343 billion implies a yearly average well above any single reported year.
The average monetary loss in an individual e-commerce scam is $101, up from $96 the previous year, and the share of targeted consumers who lost money rose from 71% in 2015 to 75% in 2021.
Ransomware incidents doubled between 2023 and 2025, with remediation costs topping $200 million.
Revenue lost to fraud by region
Fraud burden is uneven. Latin America loses nearly twice the share of revenue that North America does.
| Region | Share of e-commerce revenue lost to fraud |
|---|---|
| Latin America | 4.2% |
| Europe | 3.1% |
| Asia Pacific | 2.9% |
| North America | 2.4% |
The fraud detection and prevention market has grown alongside the losses, from $36.7 billion in 2021 to a forecast of more than $100 billion by 2027.
Regulation is reshaping who carries the cost. The EU’s Digital Operational Resilience Act, effective January 2025, requires breach reporting within 24 hours and carries fines of up to 2% of global revenue.
Smaller merchants face disproportionate compliance costs, which are pushing many onto managed platforms that can absorb them.
(Sources: Statista 1, Juniper Research, Forbes Advisor, Mordor Intelligence)
What Is Driving and Restraining E-commerce Growth
Mobile internet and 5G adoption is the single largest growth driver, adding an estimated 3.2 percentage points to the forecast growth rate. Cybersecurity and fraud risk is the largest drag, subtracting 1.6 percentage points.
Drivers outweigh restraints by a wide margin, which is why the forecast stays positive even as growth decelerates.
The table below ranks drivers by their estimated effect on the forecast growth rate.
| Driver | Impact on CAGR | Main regions |
|---|---|---|
| Mobile internet and 5G adoption | +3.2% | Global, Asia Pacific, Middle East |
| Rising middle-class purchasing power | +2.8% | Asia Pacific, Africa |
| Digital wallets and embedded finance | +2.5% | Global, South America, Asia Pacific |
| Generative AI personalized merchandising | +2.1% | North America, Europe |
| Commerce-as-a-service platforms | +1.8% | Global, strongest among SMBs |
| Virtual goods and direct-to-avatar commerce | +1.4% | North America, South Korea, Japan |
Mobile internet subscriptions reached 5.6 billion in 2025, with 5G covering 40% of the population and latency falling below 10 milliseconds. That has made real-time augmented reality try-ons practical, and those convert 30% better than static product pages.
The table below ranks the main constraints on growth.
| Restraint | Impact on CAGR | Main regions |
|---|---|---|
| Cybersecurity and fraud risk | -1.6% | Global, North America, Europe |
| Cross-border regulatory and tax complexity | -1.3% | Global, EU, India, UK |
| Cookie deprecation disrupting ad targeting | -1.1% | North America, Europe |
| Sustainability-linked delivery surcharges | -0.9% | Europe, California, some Asian cities |
The four restraints total 4.9 points against 13.8 points from drivers. Three of the four are regulatory or security-driven rather than demand-driven, which means they raise the cost of operating rather than reducing appetite to buy. Their effect concentrates on smaller merchants, accelerating consolidation onto larger managed platforms.
Final Thoughts
The slowdown narrative around e-commerce does not survive contact with the numbers. Growth rates are falling, but 2028 adds more dollars than any year before it, and online share of retail has risen every year since 2022 without a single reversal.
The more useful shift is where growth now comes from. Shopper numbers grow at 3.3% while sales grow at 7.2%, so spending per buyer is doing more work than new buyer acquisition.
That favors delivery speed, returns policy and checkout design over customer acquisition spending, which is exactly what the abandonment data shows.
By 2028, e-commerce will reach $7.89 trillion and 22.6% of global retail. The market is not slowing. It is maturing, and the levers that move it have changed.