

Two SEO campaigns can produce completely different outcomes. One returns 748% over three years. The other returns 16%. Same channel, same search engine, same three-year window. The difference is not luck or industry. It is the type of SEO work being done.
Instead of asking whether SEO is worth the money, businesses should ask which SEO strategies deliver the best return.
This matters because the average marketing team still budgets SEO as one line item with one expected return. They then judge the channel by results that were never possible with the work they funded.
This article examines the latest SEO ROI statistics, including average returns, industry benchmarks, costs, and the impact of AI search in 2026.
Let’s quickly get into the details.
Key Highlights: SEO ROI Statistics 2026
- A well-run SEO campaign returns a median of 748% over three years, or $7.48 in net profit for every $1 spent.
- Across nineteen tracked industries, the average SEO ROI is 825% and the average return on ad spend is 9.42.
- Real estate leads every industry with 1,389% ROI. E-commerce trails at 317%, a gap of 4.4x.
- SEO converts at 2.4% on average, PPC at 1.3%.
- SEO produces leads at $31 each. PPC produces them at $181, making organic 5.8x more efficient per dollar.
- SEO leads close at 14.6% while outbound leads close at 1.7%.
- Organic search drives 44.6% of all B2B revenue, more than any other channel.
- 92% of marketers plan to maintain or increase SEO investment in 2026.
- The global SEO services market sits at $83.98 billion in 2026 and is projected to reach $148.86 billion by 2030.
- Only 1.74% of newly published pages reach the top 10 within a year, down from 5.7% in 2017.
Average SEO ROI in 2026
A high-quality SEO campaign returns a median of 748% over a three-year period.
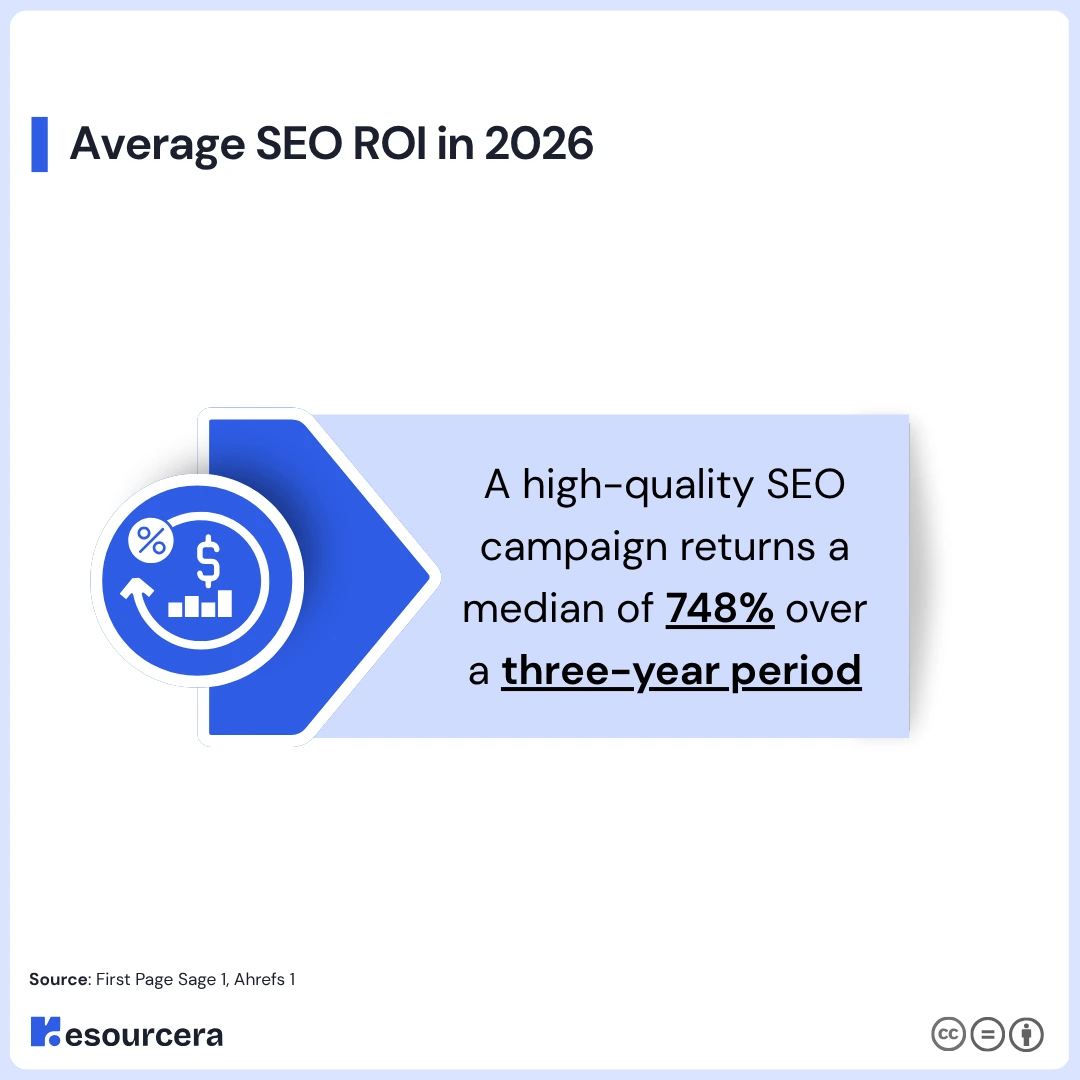
In simple terms, every dollar invested comes back as $7.48 in net profit on top of the original dollar.
The number that gets less attention is the return on ad spend. SEO ROAS is calculated as gross return divided by campaign cost, which makes it directly comparable to the metric paid teams already track.
Strategic SEO campaigns produce a 9.10 ROAS, meaning $9.10 in gross revenue per dollar spent.
The median SEO ROI of 748% sits below the mean of 825%, and that gap is worth understanding.
A few exceptionally high-performing industries, such as real estate at 1,389% and medical devices at 1,183%, push the average higher. The median is a more realistic benchmark because half of all industries perform above it and half perform below it.
Return on Ad Spend From SEO
ROAS ranges from 3.65 in e-commerce to 15.10 in real estate.
The typical SEO campaign costs around $120,000 per year in agency fees, plus a share of internal salaries for the people managing the relationship.
At a 9.42 average ROAS, that $120,000 investment should generate roughly $1.13 million in gross revenue over the measured period.
How Many SEO Campaigns Actually Turn a Profit
Not every campaign succeeds. Around 59% of campaigns produce a positive ROI within a 12-month window.
That leaves roughly four in ten campaigns still underwater at the one-year mark, which is why break-even timing matters as much as headline returns.
The reason for that failure rate becomes obvious when you look at what gets published. 96.55% of all pages receive zero organic traffic from Google.
Only 1.74% of newly published pages crack the top 10 within a year of going live, down sharply from 5.7% in 2017. Ranking has become slower and more selective, and campaigns budgeted on 2017 assumptions will miss.
(Source: First Page Sage 1, Ahrefs 1, Sagapixel)
SEO ROI by Industry
SEO ROI ranges from 317% to 1,389%, depending on the sector, a spread of more than 1,000 percentage points.
The driver is not how well SEO works in each industry. It is how much a single converted customer is worth and how long that customer stays.
Industries with high customer lifetime value and long relationships convert modest visibility gains into large revenue.
A real estate firm closing one additional transaction from organic search recovers months of SEO spend in a single deal.
An e-commerce store needs hundreds of orders to do the same. The best candidates for high-return SEO are companies where customer lifetime value exceeds $10,000.
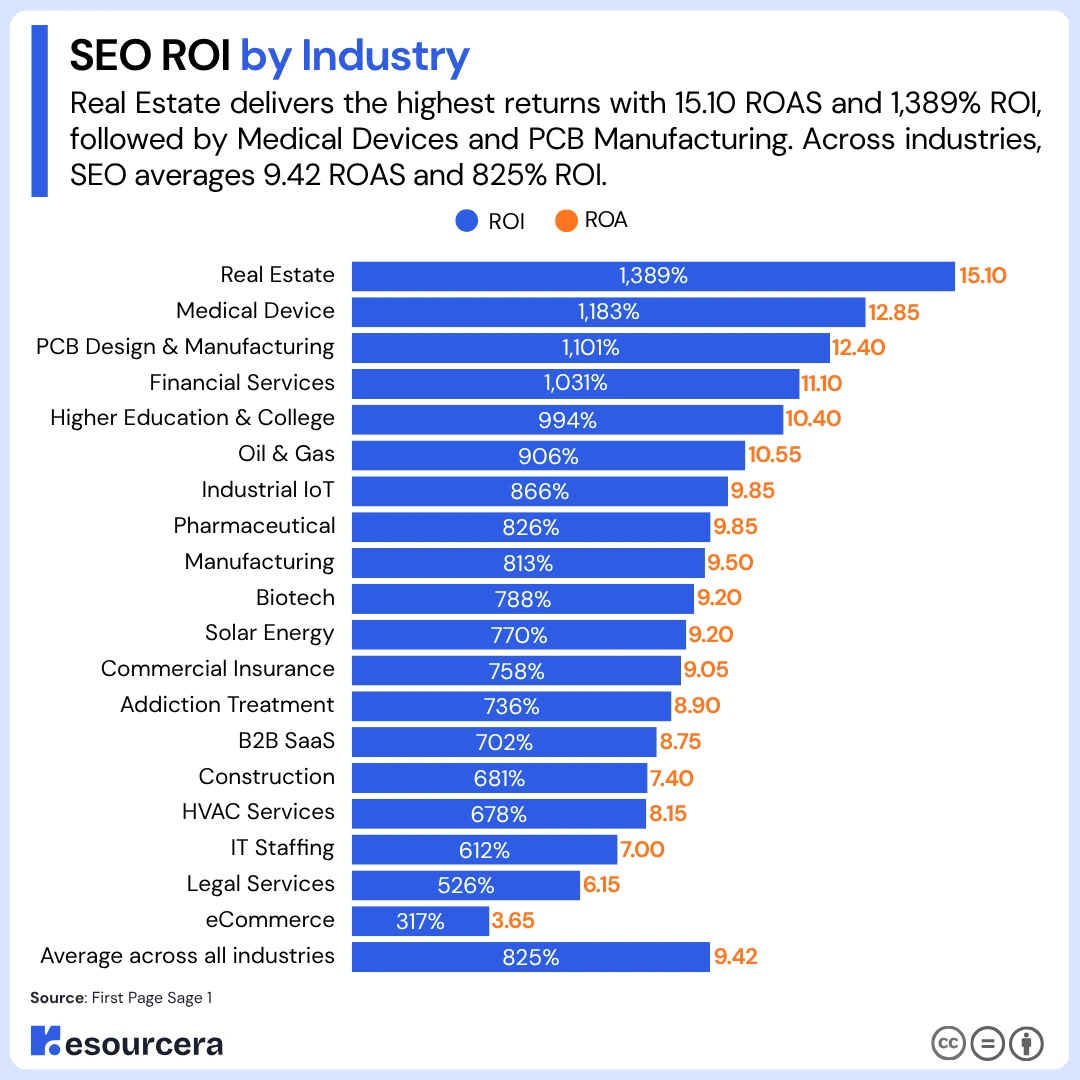
The table below covers every industry in the dataset, with ROAS, ROI, and time to break-even.
| Industry | ROAS | ROI | Time to Break-Even |
|---|---|---|---|
| Real Estate | 15.10 | 1,389% | 10 months |
| Medical Device | 12.85 | 1,183% | 13 months |
| PCB Design & Manufacturing | 12.40 | 1,101% | 11 months |
| Financial Services | 11.10 | 1,031% | 9 months |
| Higher Education & College | 10.40 | 994% | 13 months |
| Oil & Gas | 10.55 | 906% | 10 months |
| Industrial IoT | 9.85 | 866% | 7 months |
| Pharmaceutical | 9.85 | 826% | 9 months |
| Manufacturing | 9.50 | 813% | 9 months |
| Biotech | 9.20 | 788% | 8 months |
| Solar Energy | 9.20 | 770% | 9 months |
| Commercial Insurance | 9.05 | 758% | 9 months |
| Addiction Treatment | 8.90 | 736% | 8 months |
| B2B SaaS | 8.75 | 702% | 7 months |
| Construction | 7.40 | 681% | 5 months |
| HVAC Services | 8.15 | 678% | 6 months |
| IT Staffing | 7.00 | 612% | 10 months |
| Legal Services | 6.15 | 526% | 14 months |
| eCommerce | 3.65 | 317% | 9 months |
| Average across all industries | 9.42 | 825% | 9.3 months |
Industries With the Highest SEO ROI
Real estate, medical device, PCB design, and financial services occupy the top four positions, all above 1,000% ROI.
These four share a pattern. Deal sizes are large, buyers research heavily before committing, and competitors under-invest in organic search.
Financial services in particular benefit from low competitive density, since regulatory caution keeps many firms out of aggressive content publishing.
Industries With the Lowest SEO ROI
E-commerce sits last at 317%, which is still a return most channels cannot match. The constraint is the margin. Retail transactions carry thin profit per order, and product-level keyword competition is concentrated among a few dominant players.
Legal services rank second lowest at 526% despite strong conversion behavior, because paid and organic competition in legal keywords is among the fiercest anywhere.
SEO ROAS by Industry
Ranking by ROAS reshuffles the picture slightly. Oil and gas moves ahead of higher education, since it produces 10.55 in gross revenue per dollar against higher education’s 10.40, even though higher education posts the stronger net ROI. The difference reflects cost structure rather than search performance.
Why ROI Varies So Widely Between Sectors
Three variables explain most of the spread. Customer lifetime value sets the ceiling on what a ranking can be worth. Sales cycle length determines how quickly that value is realized.
Competitive density controls how expensive it is to earn the ranking in the first place.
Industries that score well on all three, such as real estate and medical device, sit at the top. Industries that score poorly on any one, such as e-commerce on margin or legal on competition, land lower.
Local service businesses follow a different curve altogether, since proximity and reviews carry more weight than domain authority.
(Source: First Page Sage 1)
SEO ROI by Service Type
The type of SEO work purchased matters more than the industry in which it is purchased.
A thought leadership campaign returns 748%. A basic content marketing campaign returns 16%. That is a 46.75x difference in outcome from the same channel, in the same search engine, over the same period.
This is the single most useful data point in the entire SEO ROI dataset, and it is the one most often left out of budget conversations.
The gap between the best and worst industry is 4.4x. Which means a business in e-commerce running a strategic campaign will comfortably outperform a business in real estate running a shallow one.
Each service tier and its measured return appear below.
| SEO Service Type | ROAS | ROI | Time to Break-Even |
|---|---|---|---|
| Thought Leadership & SEO | 9.10 | 748% | 9 months |
| Technical SEO | 1.35 | 117% | 6 months |
| Basic Content Marketing | 1.05 | 16% | 15 months |
Thought Leadership SEO
Thought leadership campaigns return 748% and break even in 9 months. The defining features are strategic keyword prioritization, content organized into topical hubs, and roughly 6 to 8 substantial pages published monthly with generative engine optimization built in.
Campaigns of this type carry a 9.10 ROAS, which is nearly seven times the ROAS of technical SEO alone.
Technical SEO
Technical SEO returns 117% with the fastest break-even of any service type at 6 months. Speed fixes, crawlability, structured data, and title tag rewrites deliver quick, reliable gains because they unlock value from content that already exists.
What they cannot do is create new demand. Technical work raises the floor. It does not raise the ceiling.
Basic Content Marketing
Basic content marketing returns 16% and takes 15 months to break even, making it the only service tier where a business is close to simply losing money for over a year.
Four average-quality blog posts per month, chosen through surface-level keyword research, produce a 1.05 ROAS. That is five cents of gross return per dollar above the cost of the work.
The Gap Between Strategy Types
The pattern across all three tiers is consistent. Speed and depth trade against each other. Technical SEO breaks even fastest but caps out low.
Thought leadership takes three extra months to break even and then returns 6.4 times more. Basic content is the worst of both, slow to break even and low in return, because it lacks the strategic layer that makes content compound.
(Source: First Page Sage 1, AIOSEO)
How Long SEO Takes to Break Even
The average SEO campaign breaks even at 9.3 months, with positive ROI typically arriving somewhere in the 6 to 12 month window.
Peak results do not arrive until the second or third year of the campaign, which means any business measuring SEO on a quarterly cycle is judging it before the data exists.
The compounding pattern is what makes SEO unusual. Paid channels deliver a flat return that stops the day the spend stops.
Organic search delivers almost nothing for three months, gradual returns through month six, then a steep climb as content authority accumulates and rankings stabilize.
Sorted from fastest to slowest, here is how long each industry takes to recover its investment.
| Industry | Time to Break-Even | ROI at 3 Years |
|---|---|---|
| Construction | 5 months | 681% |
| HVAC Services | 6 months | 678% |
| B2B SaaS | 7 months | 702% |
| Industrial IoT | 7 months | 866% |
| Addiction Treatment | 8 months | 736% |
| Biotech | 8 months | 788% |
| eCommerce | 9 months | 317% |
| Financial Services | 9 months | 1,031% |
| Commercial Insurance | 9 months | 758% |
| Manufacturing | 9 months | 813% |
| Pharmaceutical | 9 months | 826% |
| Solar Energy | 9 months | 770% |
| IT Staffing | 10 months | 612% |
| Oil & Gas | 10 months | 906% |
| Real Estate | 10 months | 1,389% |
| PCB Design & Manufacturing | 11 months | 1,101% |
| Higher Education & College | 13 months | 994% |
| Medical Device | 13 months | 1,183% |
| Legal Services | 14 months | 526% |
Break-Even Timelines by Industry
Break-even speed and eventual return are not correlated the way most people assume. Construction breaks even in 5 months and finishes at 681%.
Real estate takes twice as long at 10 months and finishes at 1,389%. Legal services is the worst of both, needing 14 months to break even and settling at 526%, the second lowest return in the dataset.
The practical read is that fast break-even signals low competition, not high value. Industries where authority is easy to build tend to be industries where authority is worth less.
The first three months of a campaign produce minimal traffic growth, since this is when strategy, keyword prioritization, and initial publishing happen. Months four through six produce gradual movement as rankings begin climbing toward the top 10.
Months seven through twelve are where growth turns exponential. One documented e-commerce campaign grew organic traffic by 535% by month 12, with organic revenue up 138.3%.
Company size shifts the timeline modestly. Mid-market companies break even fastest at 8.2 months and post the highest returns at 756%.
Small businesses follow at 9.1 months and 711%. Enterprises take the longest at 11 months and return 689%, reflecting slower internal approval cycles rather than weaker search performance.
Peak results land in year two or year three, not year one.
This is a direct function of how authority accumulates. Content published in month three continues gathering links and rankings through month thirty, meaning the revenue attributed to year one spend keeps arriving long after the invoice is paid.
Any ROI calculation that stops at month twelve understates the true return.
(Source: First Page Sage 1, Intergrowth, upGrowth)
SEO vs PPC ROI Statistics
SEO converts at 2.4% across all industries. PPC converts at 1.3%. Organic search wins on conversion rate in 17 of the 19 industries tracked, and it does so while costing dramatically less per lead.
The reason is intent, not persuasion. A person clicking on an organic result chose it. A person who clicked on an ad was shown it.
That difference compounds into higher conversion, higher close rates, and lower acquisition costs, all of which flow directly into ROI.
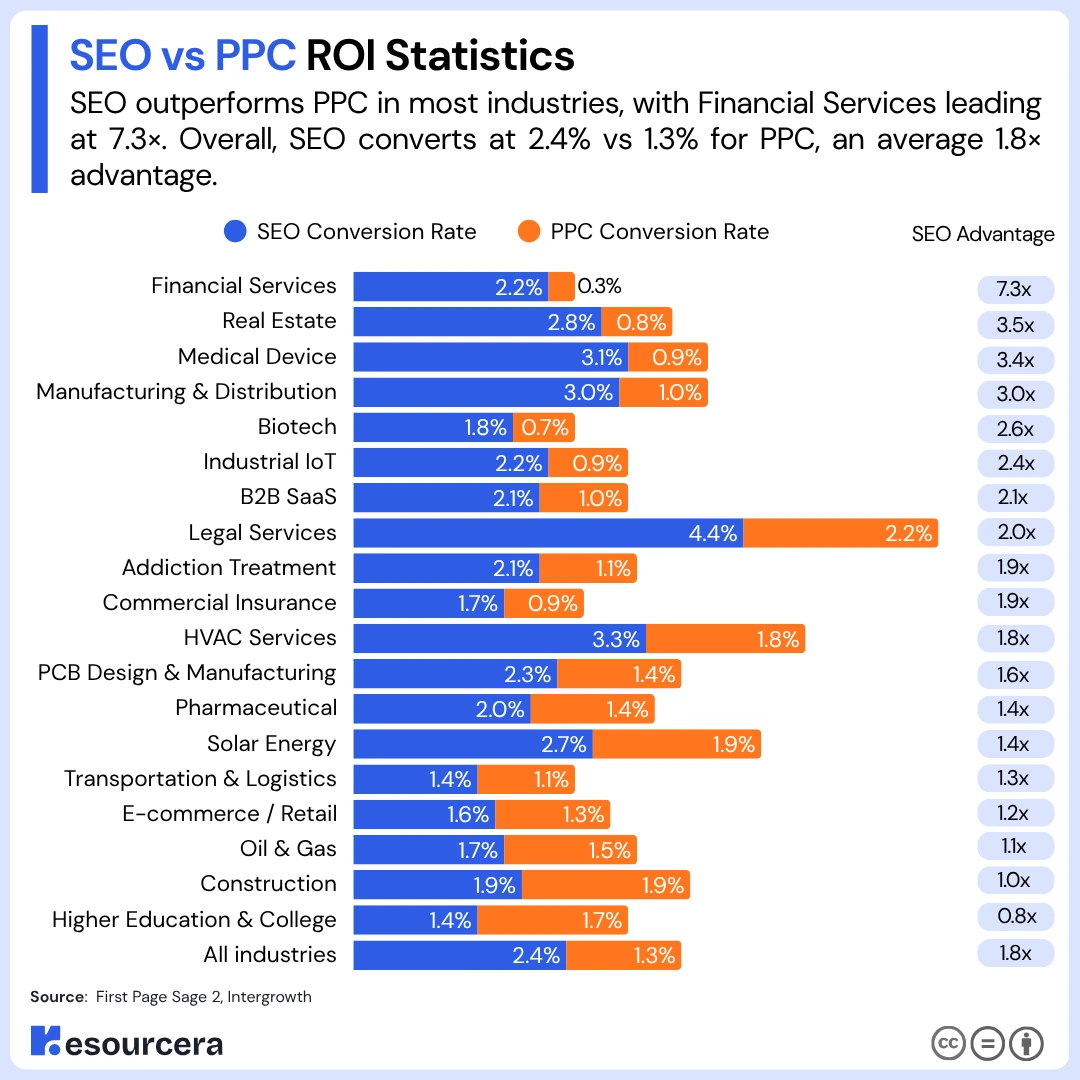
The full conversion comparison, with the SEO advantage calculated for each industry, appears below.
| Industry | SEO Conversion Rate | PPC Conversion Rate | SEO Advantage |
|---|---|---|---|
| Financial Services | 2.2% | 0.3% | 7.3x |
| Real Estate | 2.8% | 0.8% | 3.5x |
| Medical Device | 3.1% | 0.9% | 3.4x |
| Manufacturing & Distribution | 3.0% | 1.0% | 3.0x |
| Biotech | 1.8% | 0.7% | 2.6x |
| Industrial IoT | 2.2% | 0.9% | 2.4x |
| B2B SaaS | 2.1% | 1.0% | 2.1x |
| Legal Services | 4.4% | 2.2% | 2.0x |
| Addiction Treatment | 2.1% | 1.1% | 1.9x |
| Commercial Insurance | 1.7% | 0.9% | 1.9x |
| HVAC Services | 3.3% | 1.8% | 1.8x |
| PCB Design & Manufacturing | 2.3% | 1.4% | 1.6x |
| Pharmaceutical | 2.0% | 1.4% | 1.4x |
| Solar Energy | 2.7% | 1.9% | 1.4x |
| Transportation & Logistics | 1.4% | 1.1% | 1.3x |
| E-commerce / Retail | 1.6% | 1.3% | 1.2x |
| Oil & Gas | 1.7% | 1.5% | 1.1x |
| Construction | 1.9% | 1.9% | 1.0x |
| Higher Education & College | 1.4% | 1.7% | 0.8x |
| All industries | 2.4% | 1.3% | 1.8x |
Conversion Rates for SEO vs PPC by Industry
Financial services show the widest gap at 7.3x, where organic converts at 2.2% against a paid rate of just 0.3%.
The pattern across the top five gaps is trust. Financial services, real estate, medical devices, legal, and manufacturing all sell products where credibility drives the decision. A top organic ranking reads as industry leadership. An ad reads as an ad.
Higher education is the only industry where PPC outperforms SEO, converting at 1.7% against 1.4%. Construction is a tie at 1.9% each.
Cost Per Lead and Customer Acquisition Cost
Organic search produces leads at roughly $31 each. Paid search produces them at roughly $181. That makes SEO 5.8x more efficient per dollar, before conversion rate differences are even applied.
A worked example makes the compounding clear. A commercial insurance firm with a $250,000 annual budget, spending it entirely on SEO, generates around 11,000 targeted visitors.
At the 1.7% SEO conversion rate that yields 187 marketing qualified leads, and at a 20% close rate that produces 37 new clients. With a first-year customer value of $29,000, revenue reaches $1,073,000, and net return is $823,000.
The same $250,000 spent on PPC generates around 8,600 visitors. At the 0.9% PPC conversion rate that yields 77 leads, closing into 15 clients and $435,000 in revenue. Net return is $185,000. SEO returns 4.45x more on identical spend.
Organic vs Paid Click-Through Rates
The top organic result receives 19x more clicks than the top paid result.
Paid ads carry an average click-through rate of 6.42%. Position one organic sits at 39.8% blended.
Breaking that figure apart reveals something most reports skip. Position one earns 25.84% CTR on non-branded terms and 38.35% on branded terms.
The blended 39.8% average conceals the fact that ranking first for a term nobody associates with your brand yet delivers roughly two-thirds of the clicks you would get for your own name.
PPC Returns 200%, or $2 for Every $1 Spent
PPC returns roughly 200%, or $2 for every $1 spent, and it does so immediately. That makes it the right tool for product launches, promotions, seasonal demand, and testing keyword viability before committing months of SEO work to it.
Most businesses that run both end up splitting search budget around 75% to SEO and 25% to PPC.
(Source: First Page Sage 2, Intergrowth, SeoProfy, AIOSEO)
How SEO ROI Compares to Other Marketing Channels
Organic search is the number one ROI-driving channel for B2B brands, named by 27% of marketers in a survey of more than 1,500 respondents.
It also generates 44.6% of all B2B revenue, which is roughly double the next closest channel.
The table below sets SEO against the channels it usually competes with for budget.
| Metric | SEO / Organic Search | PPC / Paid Search |
|---|---|---|
| Return on spend | 748% ROI, 9.10 ROAS | ~200% ROI, 2:1 ROAS |
| Conversion rate | 2.4% | 1.3% |
| Lead close rate | 14.6% | Not reported |
| Cost per lead | $31 | $181 |
| Share of trackable website traffic | 53.3% | 15% |
| Share of B2B revenue | 44.6% | Typically 15% to 25% |
| Named #1 ROI channel by B2B marketers | 27% | Below organic |
| Time to results | 6 to 12 months | Immediate |
| Results after spend stops | Continue for months | Stop same day |
The comparison holds on lead quality as well as volume. Where paid and outbound channels buy attention, organic search captures demand that already exists, and that shows up in every downstream metric a finance team cares about.
27% of B2B Marketers Name Organic Search Their Top ROI Channel
Website, blog, and SEO topped the ROI rankings for B2B in 2026, the same position it held in 2024. Separately, 70% of marketers report that SEO generates more sales than PPC.
Older polling put the figure claiming organic as the top ROI channel at 49%, but that number dates to a 2018 survey and predates AI Overviews entirely, so the 27% figure from current research is the one to plan against.
SEO Leads Close at 14.6% Against 1.7% for Outbound
SEO leads close at 14.6%. Outbound leads close at 1.7%. An organic lead is 8.6 times more likely to become a customer than a cold outbound lead, and 60% of marketers say inbound strategies produce their highest quality leads overall.
Cutting SEO does not save money either. Businesses without organic visibility can pay up to 400% more on ads to reach the same audience, because they are buying traffic they could have earned.
Organic Search Share of Traffic and Revenue
Organic search accounts for 53.3% of all trackable website traffic, against 15% from paid search. Google alone drives 63.4% of total referral traffic to the average site, roughly nine times more than any other platform.
Measurement methodology matters here. Different studies report organic share at 53.3%, 46.98%, and 29% depending on whether direct traffic, dark traffic, and app referrals are counted.
The direction is consistent even when the decimal is not. Organic search remains the largest or second largest traffic source for most sites, and B2B companies generate twice as much revenue from it as from any other channel.
(Source: HubSpot State of Marketing, BrightEdge 1, SparkToro 1, Databox, SeoProfy)
SEO Conversion Rate Statistics
The average conversion rate from organic search is 2.4%, with a range from 1.4% in higher education and transportation to 4.4% in legal services.
Anything between 2% and 5% is considered healthy in digital marketing, which places typical organic performance comfortably inside the normal band.
Conversion rate is where ROI is either created or destroyed. Traffic that does not convert is a cost.
That makes ranking position, page type, and result format decisive, because they determine how much of the available traffic a site actually receives before conversion even enters the picture.
Click distribution across the first page is shown below.
| Search Result Position | Click-Through Rate |
|---|---|
| Position 1 (with featured snippet) | 42.9% |
| Position 1 (standard organic) | 39.8% |
| Position 2 | 18.7% |
| Position 3 | 10.2% |
| Top 3 positions combined | 68.7% |
| All of page 2 | 0.78% |
Conversion Rate by Industry
Local and high-urgency services cluster at the top. HVAC converts at 3.3%, medical device at 3.1%, and manufacturing at 3.0%.
Long-consideration purchases cluster at the bottom, with transportation and higher education both at 1.4% and e-commerce at 1.6%.
Ranking Position and Click Distribution
The top three organic results capture 68.7% of all clicks. Position one alone takes 39.8%, and if that result is a featured snippet, the rate climbs to 42.9%.
Moving from position two to position one produces 74.5% more clicks, and moving up a single position anywhere on page one lifts CTR by 32.3% on average.
Format matters as much as position. Rich results capture 58% of clicks against 41% for non-rich results in equivalent positions, which makes structured data one of the cheapest available ROI levers.
Page two is effectively invisible, drawing just 0.78% of clicks, and 96.98% of all clicks happen within the top 10.
(Source: First Page Sage 2, AIOSEO, SE Ranking, Ahrefs 2)
What SEO Costs and How That Shapes ROI
SEO delivery costs range from $500 per month for a small local retainer to $200,000 per year for a fully loaded in-house team.
The campaigns producing the 748% benchmark cost roughly $120,000 per year, which sets a useful floor for what serious returns require.
Tooling is a fixed cost on top of that. Cost structure directly determines break-even timing. Fixed expenses concentrate in the first three to six months, while returns concentrate in months seven onward, which is why the ROI curve looks negative before it looks exponential.
Understanding that shape prevents businesses from canceling campaigns weeks before they would have paid off.
Typical costs across delivery models are laid out here.
| Delivery Model | Typical Cost |
|---|---|
| Agency retainer (general range) | $1,000 to $15,000 per month |
| Agency retainer (small business average) | $497 per month |
| Agency retainer (thought leadership benchmark) | ~$120,000 per year |
| In-house team | $50,000 to $200,000 per year |
| Freelance specialist | $50 to $200 per hour |
| SEO services hourly rate (market average) | $100 to $150 per hour |
| DIY | 100 to 200 hours initially |
Agency Retainers, Hourly Rates, and In-House Costs
Monthly retainers commonly fall between $500 and $1,000 at the entry level and climb toward $15,000 for competitive national campaigns.
Highly competitive industries increase content production costs by 30% to 50% for equivalent positioning, which is a large part of why legal services show the slowest break-even despite strong conversion rates.
Even at the top of that range, SEO remains cheaper than the alternative. SEO costs run around 61% below comparable paid search campaigns while delivering higher returns.
Small Business SEO Spend
74% of small businesses invest in SEO, spending an average of $497 per month.
Returns at that level are still strong, with small businesses typically reaching 400% or more ROI within two years and small and mid-sized firms in tracked portfolios hitting 711% ROI at a 9.1-month break-even.
Sites that invest consistently see organic traffic grow 20% to 30% annually.
SEO Professional Salaries
The average SEO professional in the United States earns $70,300 per year, while the global median sits at $51,680.
Around 64.5% of SEO professionals worldwide received a pay raise in the past year, and 40% of marketers name algorithm changes as their single biggest SEO challenge.
(Source: AIOSEO, upGrowth, First Page Sage 1, PageOptimizer Pro)
How AI Search Is Changing SEO ROI
AI Overviews now appear on 13.14% of all US desktop queries, double the rate recorded in January 2025.
They have not collapsed SEO ROI, but they have changed where that ROI comes from, shifting value away from broad informational content and toward bottom-of-funnel pages that AI summaries cannot fully answer.
Traffic from AI platforms remains marginal while Google remains dominant, and the businesses being hurt are mostly the ones whose organic traffic was informational and low-converting to begin with.
AI Overviews and Zero-Click Searches
Zero-click behavior is the real pressure point, and it predates AI. For every 1,000 US Google searches, only 360 clicks reach the open web.
The remaining 640 either end inside Google or lead to another search. Organic click share fell from 44.2% to 40.3% year over year, and by broader counts, around 60% of searches now end without a click.
Encouragingly, 52% of sources cited inside AI Overviews already rank in the top 10, which means traditional ranking work remains the primary path into AI answers.
And 63% of practitioners report that AI Overviews have positively affected their organic traffic, visibility, or rankings.
Traffic From AI Platforms vs Google
Google sends 345x more traffic to websites than ChatGPT, Gemini, and Perplexity combined. AI search accounts for less than 1% of referral traffic overall, even while AI search traffic has grown 527% year over year. Growth from a very small base is still a very small base.
Optimization overlap is high. Research shows 87% of ChatGPT Search citations match Bing’s top 10 results, and 56% match Google’s top 10. Ranking well in traditional search already earns most of the AI citations available.
What Marketers Are Doing About It
Competition is intensifying, with 57.6% of SEO professionals reporting a significant rise in industry competition driven by AI tools lowering the barrier to content production.
AI-generated content now accounts for 17.3% of pages in Google’s top 20 results.
The response is adaptation rather than retreat. 41% of marketers say their top priority is updating SEO strategy for AI-driven search changes, not abandoning the channel.
On content access, 32% of website owners allow AI platforms to crawl their content while 11% block AI scrapers entirely.
(Source: Ahrefs 2, AIOSEO, Semrush, SparkToro 2, BrightEdge 2, HubSpot, Seer Interactive)
SEO Market Size and Budget Commitment Statistics
The global SEO services market is worth $83.98 billion in 2026 and is projected to reach $148.86 billion by 2030.
That is 77% total growth over four years, which works out to a compound annual growth rate of roughly 15.4%.
Budget behavior confirms what the ROI data implies. If SEO were losing its value, spending would be falling.
Instead, 92% of marketers plan to maintain or increase SEO investment in 2026, in the same year that AI Overviews doubled in prevalence.
Market trajectory is summarized below.
| Metric | Figure |
|---|---|
| Global SEO services market, 2026 | $83.98 billion |
| Global SEO services market, 2030 (projected) | $148.86 billion |
| Total growth, 2026 to 2030 | 77% |
| Implied compound annual growth rate | ~15.4% |
| Marketers maintaining or increasing SEO budget in 2026 | 92% |
| Small businesses investing in SEO | 74% |
Global SEO Services Market Size
A 15.4% CAGR through 2030 places SEO among the faster-growing segments of digital marketing spend. That growth is happening alongside AI adoption, not in spite of it, which supports the reading that AI is changing SEO practice rather than replacing it.
Marketer Budget Intentions for 2026
92% of marketers are holding or raising SEO spend, and 74% of small businesses invest in the channel at all. The demand context is unchanged.
Google still handles 8.5 billion searches per day, which is about 99,000 every second, and holds 90.83% global search market share. 68% of all online experiences still begin with a search engine.
(Source: AIOSEO, HubSpot State of Marketing)
Final Thoughts
SEO ROI depends more on the quality of the strategy than the industry.
Strong campaigns can generate high returns, but most take around nine months to break even and deliver their best results over several years.
AI is reducing the value of basic informational content, while comparison pages, product-focused content, and other high-intent pages are becoming more important.
The main conclusion is simple, SEO works best when businesses invest in strategic content, focus on revenue-generating searches, and measure performance over the long term rather than expecting quick results.

