Large language models now reach more people than any consumer software category in history, with ChatGPT alone crossing 1.1 billion monthly users and 88% of organizations running AI in at least one business function.
The global LLM market is on track to grow 36% in 2026 alone, moving from $7.77 billion to $10.57 billion.
The numbers underneath that growth tell a more complicated story. ChatGPT’s share of AI web visits fell 12 points in four months.
Anthropic tripled its enterprise API share while OpenAI’s was cut nearly in half.
Programming went from 11% of all token volume to more than 50% in a single year. Meanwhile, 74% of organizations now rank inaccuracy as their top AI risk, and hallucination rates across leading models still range from 22% to 94%.
This article breaks down the numbers behind LLM adoption, market share, users, models, usage, revenue, and risk.
Read on to get full insights.
LLM Statistics Key Highlights (2026)
- 88% of organizations use AI in at least one business function, up from 78% a year earlier.
- The global LLM market will grow from $7.77 billion in 2025 to $10.57 billion in 2026, a 36% increase.
- ChatGPT’s share of AI application web visits fell from 72.5% in October 2025 to 60.5% in February 2026.
- Google’s Gemini grew its web visit share from 13.9% to 23.9% over the same four months.
- Anthropic now takes 40% of enterprise LLM API spend, up from 12% in 2023.
- ChatGPT has passed 1.1 billion monthly users, making it the fastest app ever to reach that mark.
- Programming grew from 11% to over 50% of total token volume on multi-model routing platforms in one year.
- Reasoning models now handle more than half of all tokens, up from almost nothing in early 2025.
- 74% of organizations name inaccuracy as their biggest AI risk, ahead of cybersecurity at 72%.
- Anthropic’s revenue grew roughly 8.6 times in a year, from about $700 million in 2024 to $6 billion in 2025.
LLM Adoption Statistics
LLM adoption has become the default rather than the exception, with 88% of organizations worldwide now using AI in at least one business function.
That figure was 78% a year earlier and 67% the year before that, which works out to a 21-point gain across two years.
Only about 20% of US business leaders report having implemented AI across multiple functions or fully integrated it into operations, so the 88% headline describes reach rather than maturity.
Generative AI specifically sits at 70% of organizations, up from 33% just two years earlier, while agentic deployment remains in single digits across nearly every function measured.
Population-level adoption tells a similar story of speed. Generative AI reached 53% adoption within three years, though the spread between countries is wide. Singapore sits at 61% while the United States sits at 28.3% and ranks 24th globally despite leading the world in AI investment.
88% of organizations now use AI in at least one business function
Organizational AI adoption climbed from 67% to 78% to 88% across three consecutive annual readings. Generative AI adoption more than doubled over the same window, moving from 33% to 70%.
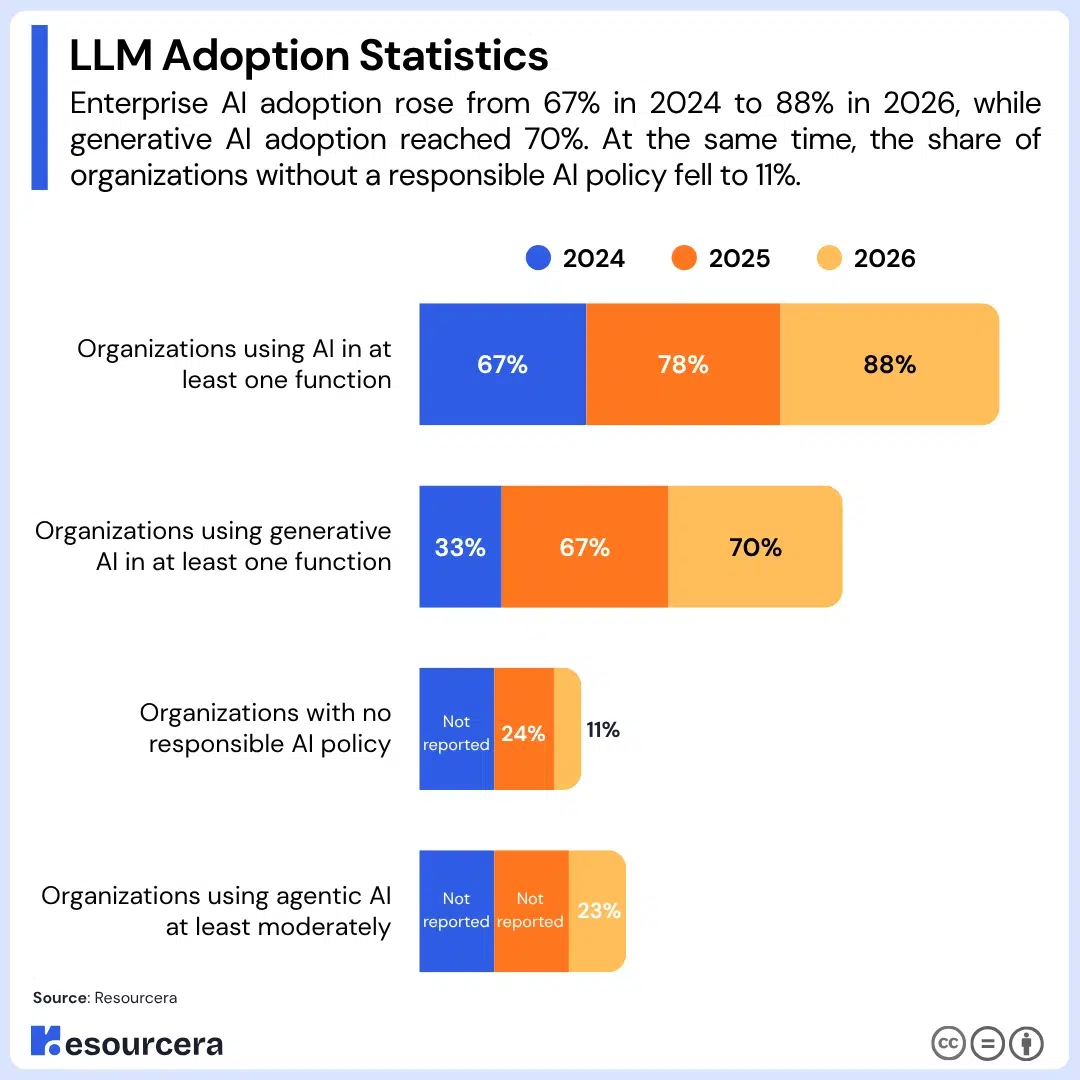
This is the year-over-year adoption picture across the three most recent survey cycles.
| Metric | 2024 | 2025 | |
|---|---|---|---|
| Organizations using AI in at least one function | 67% | 78% | 88% |
| Organizations using generative AI in at least one function | 33% | 67% | 70% |
| Organizations with no responsible AI policy | Not reported | 24% | 11% |
| Organizations using agentic AI at least moderately | Not reported | Not reported | 23% |
LLM adoption by business function
Generative AI adoption grew fastest in IT, which jumped from 4% to 27% in a single year. Every function measured recorded at least a sixfold increase over the same period.
The table below shows function-level generative AI adoption across the two most recent full years of comparable data.
| Business function | 2023 adoption | 2024 adoption |
|---|---|---|
| IT | 4% | 27% |
| Risk management | 2% to 4% | 26% |
| Logistics | 2% to 4% | 26% |
| Sales and customer operations | 4% | 25% |
| Product design and R&D | 3% | 25% |
| Marketing | 2% | 22% |
Retail moved faster than any single function, climbing from 17% adoption in 2023 to 40% in 2024.
21% of US workers now use AI in their job
One in five American workers reports doing at least some of their work with AI, up from 16% the year before. The gain is concentrated among degree holders, where usage rose from 20% to 28%.
Global employee usage runs meaningfully higher at 58% reporting semi-regular or regular AI use. Regional variation is stark, with usage above 80% in India, China, Nigeria, the UAE, and Saudi Arabia against 40% to 48% across most of North America and Europe.
Frequency remains the weak point. Only 15% of leaders and 20% of employees use generative AI daily, and 27% of US workers use general-purpose chatbots daily or weekly out of the 40% who have touched any AI tool at work in the past year.
85% of developers regularly use AI tools
Developers are the most saturated professional group, with 85% reporting regular AI tool use and 51% using AI tools every single day. Broader developer survey data puts the figure at 84% currently using or planning to use AI coding tools, up from 76% in 2024.
LLM adoption in education
Student adoption has moved close to universal, with 92% of students now using some AI tool for learning, up from 66% the previous year. Use of ChatGPT specifically for assessments grew from 53% to 88% over the same period.
Among younger students, the curve is steeper still. 26% of US teens aged 13 to 17 had used ChatGPT for schoolwork by late 2024, double the share from a year earlier, and 79% of US students reported awareness of the tool.
(Source: Stanford HAI, Pew Research Center 1, McKinsey 1, Deloitte, SurveyMonkey, HEPI, Second Talent)
LLM Market Size and Growth
The global LLM market will reach $10.57 billion in 2026, growing 36% from $7.77 billion in 2025.
From there, it is projected to compound at roughly 34% annually to reach close to $150 billion by 2035, a 14.2 times expansion over nine years.
This table maps the market year by year from the 2025 base to the 2035 endpoint.
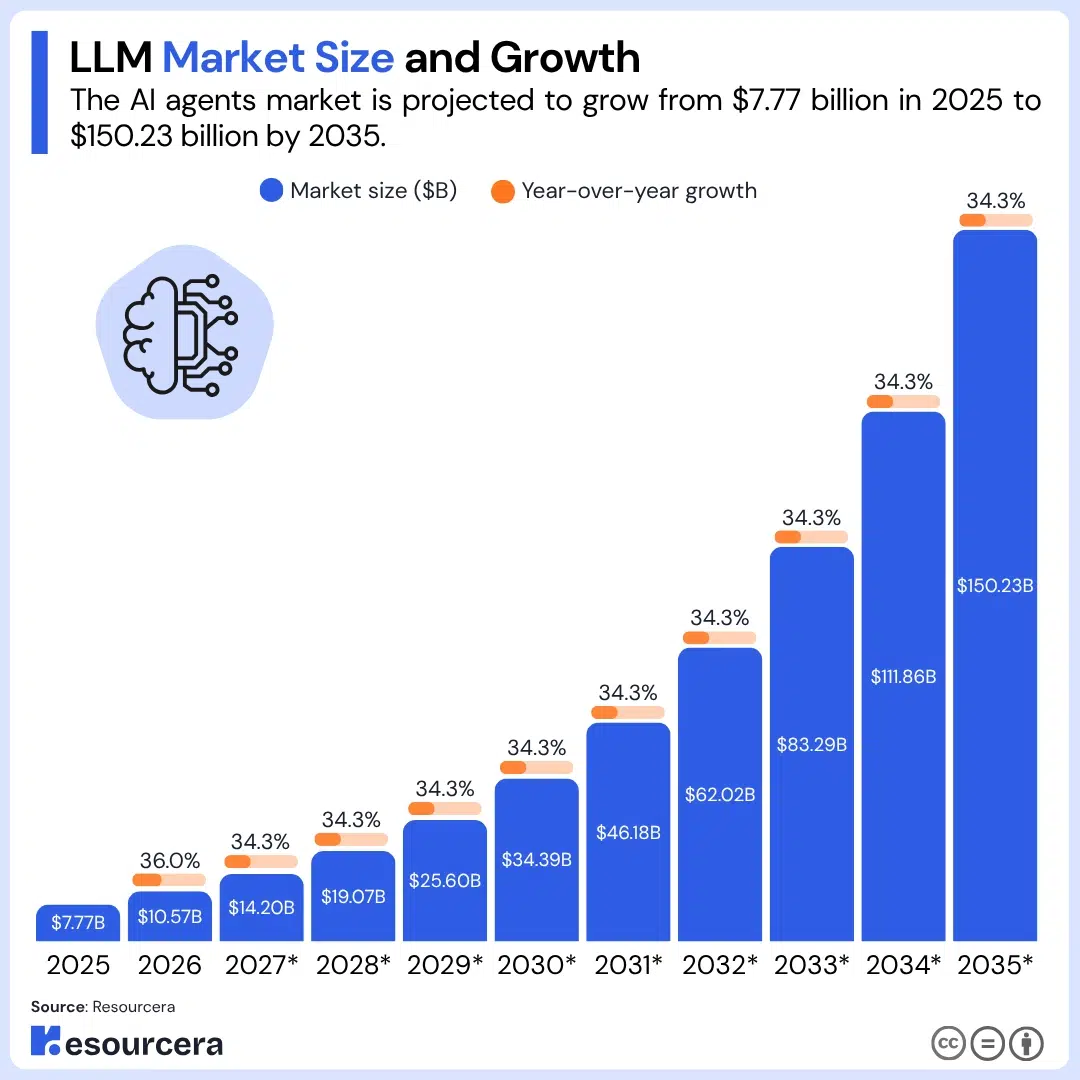
Figures for 2027 onward are projected at the stated compound rate, so they show the shape of the forecast rather than individually reported values.
| Year | Market size ($B) | Year-over-year growth |
|---|---|---|
| 2025 | $7.77 billion | – |
| 2026 | $10.57 billion | 36.0% |
| 2027* | $14.20 billion | 34.3% |
| 2028* | $19.07 billion | 34.3% |
| 2029* | $25.60 billion | 34.3% |
| 2030* | $34.39 billion | 34.3% |
| 2031* | $46.18 billion | 34.3% |
| 2032* | $62.02 billion | 34.3% |
| 2033* | $83.29 billion | 34.3% |
| 2034* | $111.86 billion | 34.3% |
| 2035* | $150.23 billion | 34.3% |
The market crosses $100 billion between 2033 and 2034, roughly eight years out from the current base.
Worldwide AI spending, the broader category, will grow 47% in 2026 to reach $2.59 trillion. Working backward, that implies 2025 spending of roughly $1.76 trillion. Generative AI model spending specifically is forecast to grow 80.8% in 2026, faster than the AI market as a whole.
LLM market size by region
North America holds the largest regional share at 33% of the global LLM market. The United States market alone is projected to grow from $1.92 billion to $37.98 billion by 2035, a 19.8 times increase at a 39.3% compound rate that outpaces the global average.
Asia Pacific is expected to be the fastest growing region through 2035. Earlier regional data put North America at 32.7% of the market with a value of $1.47 billion in 2024, and at 40.8% of global generative AI revenue, which confirms how concentrated early spending was.
The on device segment is expanding on its own track, growing from $1.92 billion in 2024 toward $16.8 billion by 2033 at a 27.4% rate. North America accounts for over 36% of that segment.
LLM market size in the US
The United States market alone is projected to grow from $1.92 billion to $37.98 billion by 2035, a 19.8 times increase at a 39.3% compound rate that outpaces the global average.
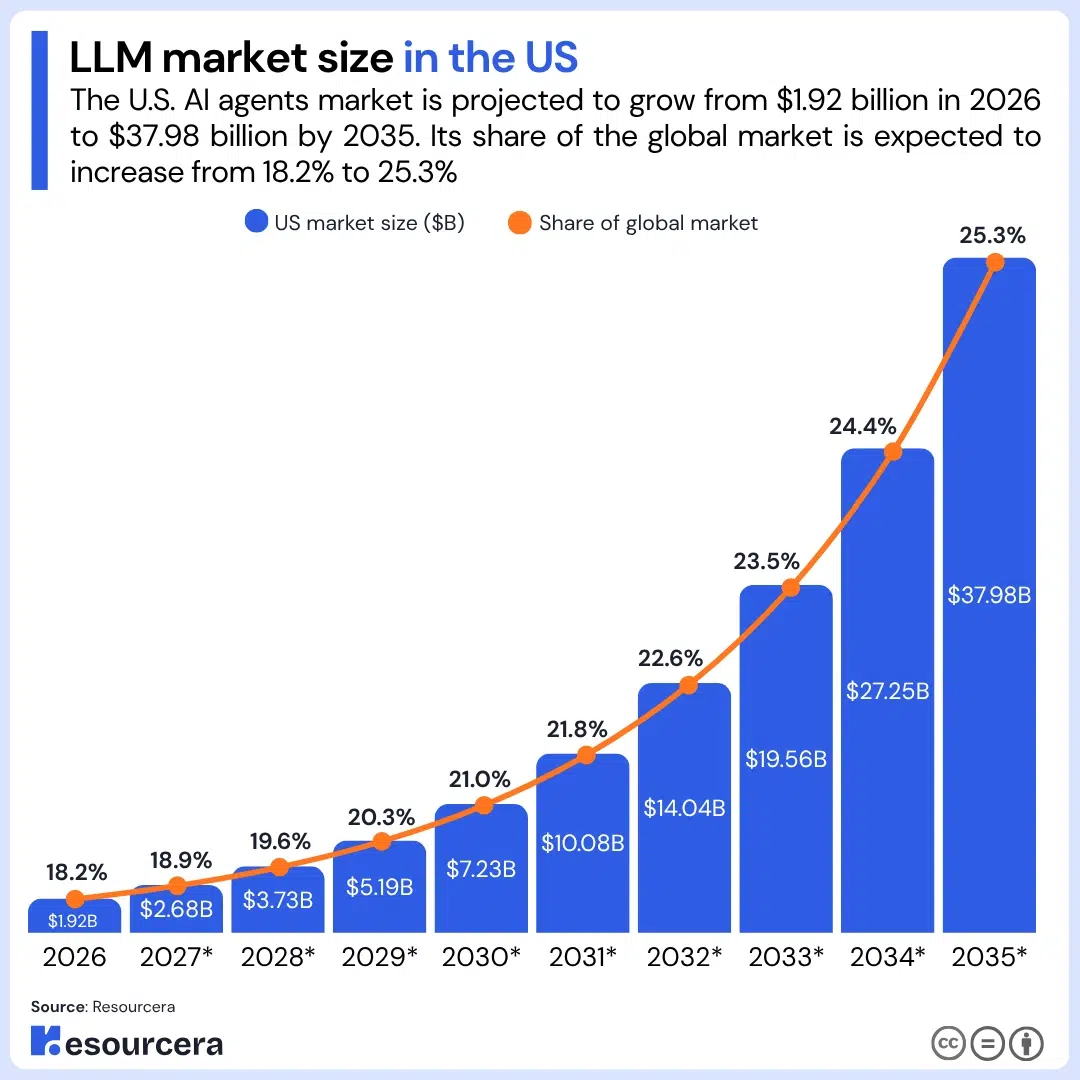
This table tracks the US market year by year, with 2027 onward projected at the stated rate.
| Year | US market size ($B) | Share of global market |
|---|---|---|
| 2026 | $1.92 billion | 18.2% |
| 2027* | $2.68 billion | 18.9% |
| 2028* | $3.73 billion | 19.6% |
| 2029* | $5.19 billion | 20.3% |
| 2030* | $7.23 billion | 21.0% |
| 2031* | $10.08 billion | 21.8% |
| 2032* | $14.04 billion | 22.6% |
| 2033* | $19.56 billion | 23.5% |
| 2034* | $27.25 billion | 24.4% |
| 2035* | $37.98 billion | 25.3% |
The US grows five points faster than the global market each year, which lifts its share of global spend from 18.2% to 25.3% over the decade. That runs against the expectation of Asia Pacific leading growth, so the two forecasts are not fully reconcilable and both should be read as directional.
LLM market share by segment
Chatbots and virtual assistants lead all applications at 28% share, and on-premises deployment leads at 59%. Both segments have grown their share slightly over the past two years rather than losing ground to newer categories.
Here is how the leading segment in each category has shifted.
| Segment category | Leading segment | Earlier share | 2026 Share |
|---|---|---|---|
| Application | Chatbots and virtual assistants | 27.1% (2024) | 28% |
| Deployment | On premises | 57.7% (2023) | 59% |
| Industry vertical | Retail and ecommerce, now healthcare | 27.5% retail (2024) | Healthcare leads |
On premises dominance is driven by data privacy requirements in regulated industries, though cloud deployment is expected to grow faster from here.
Healthcare has overtaken retail and ecommerce as the largest vertical, with finance projected to grow fastest.
Enterprise LLM and API spending
Enterprise generative AI spending tripled year over year, rising from $11.5 billion to $37 billion, with AI applications now representing about 6% of the entire software market. API spending specifically climbed from $500 million in 2023 to $8.4 billion by mid 2025, a 16.8 times increase in 18 months.
Individual company budgets have moved past experimental scale. 37% of enterprises now spend more than $250,000 annually on LLMs, 73% spend more than $50,000, and 72% plan to increase spending further.
This is the full generative AI spending breakdown by category across the two years where comparable data exists.
| Spend category | 2023 ($M) | 2024 ($M) | Growth multiple |
|---|---|---|---|
| Foundation models | $500 million | $3,500 million | 7.0x |
| Model training | $500 million | $3,000 million | 6.0x |
| Deployment and inference | $600 million | $2,300 million | 3.8x |
| Data and infrastructure | $50 million | $400 million | 8.0x |
| Vertical AI | $100 million | $1,200 million | 12.0x |
| Departmental AI | $200 million | $1,800 million | 9.0x |
| Horizontal AI | $300 million | $1,600 million | 5.3x |
Vertical AI grew fastest at 12 times, which suggests spending is shifting from general-purpose tooling toward industry-specific applications.
(Source: Precedence Research, Gartner, Menlo Ventures, Grand View Research, Market.us, Kong, Growth Market Reports, Second Talent)
LLM Market Share 2026
ChatGPT remains the clear leader with 60.5% of AI application web visits as of August 2026, but that figure is down from 72.5% in October 2025.
The 12-point drop over four months works out to roughly 3 points of share lost per month, a 16.6% relative decline.
Gemini captured nearly all of that movement, growing from 13.9% to 23.9% of web visits over the same four months.
Together the two platforms account for 84.4% of AI application web visits, which leaves everything else, including Claude, DeepSeek, Perplexity, Grok, and Copilot, competing for the remaining 15.6%.
The enterprise picture is inverted. Anthropic leads enterprise API spend despite holding a single-digit share of consumer web visits, which shows that consumer popularity and commercial deployment are measuring two different markets.
ChatGPT’s share of AI web visits fell from 72.5% to 60.5% in four months
ChatGPT lost 12 points of web visit share between October 2025 and February 2026 while Gemini gained 10. Total AI web visits continued growing over the period, so the decline reflects competition rather than shrinking usage.
This is the month-by-month application share movement across the tracked window.
| Metric | Oct 2025 | Feb 2026 |
|---|---|---|
| ChatGPT web visit share | 72.5% | 60.5% |
| Gemini web visit share | 13.9% | 23.9% |
| Combined ChatGPT and Gemini | 86.4% | 84.4% |
| Chat category share of all AI apps | 88% to 92% | 88% to 92% |
Chat as a category holds 88% to 92% of the entire AI application market across every month measured, and within that category ChatGPT and Gemini together held about 84% in February 2026.
Every other category, including coding assistants, search engines, image generation, audio, and interactive AI, remains niche by comparison.
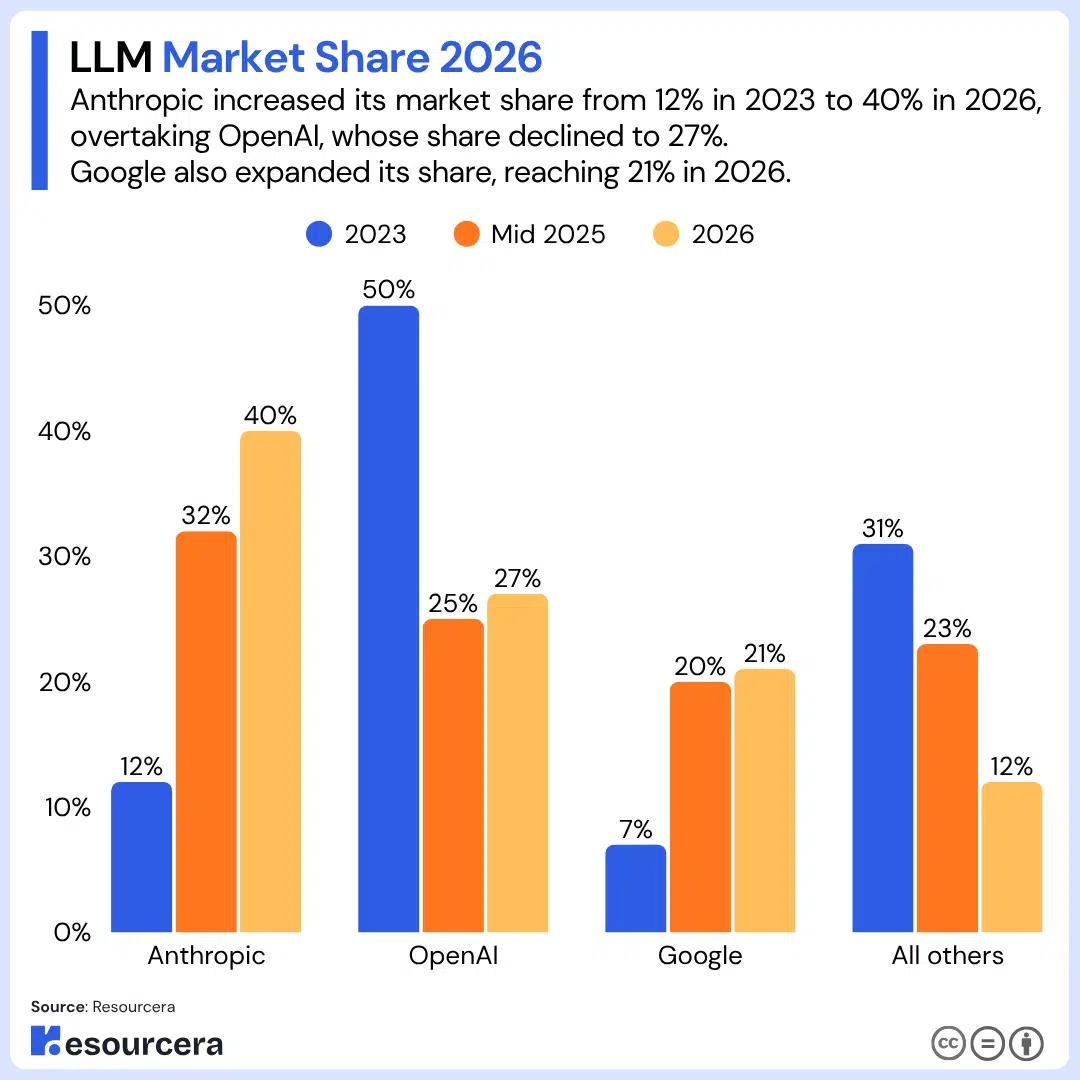
Anthropic holds 40% of enterprise LLM API spend
Anthropic now takes 40% of enterprise LLM API spend, up from 12% in 2023, a 3.3 times increase driven largely by dominance in coding tools.
OpenAI’s enterprise share fell from 50% to 27% across the same period, a 23-point drop that represents a 46% relative decline.
The table below tracks enterprise API spend share across all three readings available.
| Provider | 2023 | Mid 2025 | 2026 | Change from 2023 |
| Anthropic | 12% | 32% | 40% | +28 points |
| OpenAI | 50% | 25% | 27% | -23 points |
| 7% | 20% | 21% | +14 points | |
| All others | 31% | 23% | 12% | -19 points |
Anthropic now leads OpenAI by 13 points in enterprise spend while trailing badly in consumer visits.
Multi-model deployment has become the enterprise standard, with 37% of enterprises running five or more models in production and open source usage settling at about 13% of workloads, down from 19% six months prior.
DeepSeek served 14.37 trillion tokens, more than the next two model families combined
DeepSeek leads all model authors by token volume at 14.37 trillion tokens over a 12-month window, which is 1.5 times the combined volume of Qwen and Meta LLaMA. DeepSeek alone accounts for 42.5% of the top 10 authors’ total volume of 33.8 trillion tokens.
This is the complete top 10 ranking by total token volume, with each author’s share of the top 10 total calculated.
| Rank | Model author | Total tokens (trillions) | Share of top 10 |
|---|---|---|---|
| 1 | DeepSeek | 14.37 | 42.5% |
| 2 | Qwen | 5.59 | 16.5% |
| 3 | Meta LLaMA | 3.96 | 11.7% |
| 4 | Mistral AI | 2.92 | 8.6% |
| 5 | OpenAI | 1.65 | 4.9% |
| 6 | Minimax | 1.26 | 3.7% |
| 7 | Z-AI | 1.18 | 3.5% |
| 8 | TNGTech | 1.13 | 3.3% |
| 9 | MoonshotAI | 0.92 | 2.7% |
| 10 | 0.82 | 2.4% |
The top three authors control 70.8% of measured token volume. Note that this ranking reflects developer routing activity on a multi model platform and excludes both native app usage and enterprise arrangements where developers supply their own API keys, so it understates the commercial position of closed providers like OpenAI and Anthropic considerably.
Open weight models hold roughly 30% of token volume
Open weight models have settled at approximately one third of total token volume, with the split holding steady in late readings. Proprietary models from North American providers still serve about 70% on average.
Chinese open source models drove most of the growth in the open segment. Starting from a weekly share as low as 1.2% in late 2024, they reached nearly 30% of total usage in some weeks and averaged 13.0% across the year.
Rest of world open source models averaged 13.7% over the same window.
Concentration inside the open segment has broken down. Two DeepSeek models once accounted for over half of all open source token usage. By late 2025, no single open model held more than 25% of open source tokens, with volume spread across five to seven models instead.
LLM market share by country
The United States accounts for 47.17% of global token volume, more than five times the next largest country. Singapore ranks second at 9.21%, followed by Germany at 7.51% and China at 6.01%.
Here is the full country ranking by share of global tokens.
| Rank | Country | Share of global tokens |
|---|---|---|
| 1 | United States | 47.17% |
| 2 | Singapore | 9.21% |
| 3 | Germany | 7.51% |
| 4 | China | 6.01% |
| 5 | South Korea | 2.88% |
| 6 | Netherlands | 2.65% |
| 7 | United Kingdom | 2.52% |
| 8 | Canada | 1.90% |
| 9 | Japan | 1.77% |
| 10 | India | 1.62% |
| – | Others (60+ countries) | 16.76% |
Consumer and developer markets diverge sharply by country. The United States accounts for 85.5% to 90.5% of web visits to AI applications but only 47.17% of token volume, while China generates roughly 8% of web visits against a far higher token share.
That gap means Chinese usage runs through APIs and programmatic workloads rather than visible consumer activity.
Continental distribution shows the same rebalancing. North America holds 47.22% of tokens, Asia 28.61%, and Europe 21.32%, with Asia’s share of spend more than doubling from about 13% to 31% over the measured period.
(Source: AIMultiple, OpenRouter, OpenRouter Rankings, Similarweb, Typedef, Menlo Ventures)
LLM User Statistics
ChatGPT has passed 1.1 billion monthly users, making it the fastest application in history to reach that milestone.
Gemini follows at 750 million monthly users and Claude at 245 million, which puts the three leaders at just over 2 billion combined.
Growth has been extraordinary by any historical measure. ChatGPT went from 100 million monthly users in February 2023 to over 1.1 billion by June 2026, an 11-times increase in roughly 40 months that works out to a compound annual growth rate above 105%.
The top three AI assistants now account for 89% of time spent on AI assistant apps. That leaves the remaining field, including AI companion apps and content generation tools, fragmented and open to new entrants.
LLM platform user comparison
ChatGPT leads all standalone AI platforms with over 1.1 billion monthly users, 1.76 times Gemini’s total and 4.49 times Claude’s. Google’s embedded AI products reach further still, with AI Overviews at 2.5 billion monthly users.
The table below compares the latest reported figure for every major platform alongside its users as of 2026.
| Platform | Latest reported users |
|---|---|
| Google AI Overviews | 2.5 billion |
| ChatGPT | 1.1 billion+ |
| Google AI Mode | 1 billion+ |
| Gemini app | 750 million |
| Gemini app (company reported) | 900 million |
| Anthropic Claude | 245 million |
| Perplexity | 15 million |
| Microsoft Copilot | 33 million+ |
Gemini’s figure is disputed. Independent tracking puts the app at 750 million monthly users in June 2026, while Google’s own May 2026 disclosure claimed 900 million. Both are included above so the gap is visible rather than hidden.
Paid conversion sits well below reach. ChatGPT reported 50 million paying subscribers in 2026, which is under 5% of its monthly user base, alongside more than 2 million paying business users.
LLM user demographics
The early gender gap in LLM usage has closed, with women accounting for 52% of ChatGPT users by July 2025, up from 37% in January 2024.
Young adults aged 18 to 25 generate 46% of all ChatGPT messages, making them the largest age cohort by volume.
Work usage runs opposite to overall volume. Only 22.5% of messages from users aged 18 to 25 are work-related, against 31.4% for users aged 36 to 45, the highest share of any group.
Sentiment still splits along gender lines even as usage has evened out. 69% of men describe AI as a valuable assistant and collaborator against 61% of women, and women are meaningfully more likely to say that using AI at work feels like cheating.
Income and seniority predict frequency. 52% of US professionals earning over $125,000 use LLMs daily, compared with 20.8% of professionals aged 18 to 24.
Adoption is growing fastest where the base was smallest. ChatGPT usage in low income countries grew more than four times faster than in high income countries by mid 2025.
(Source: TechCrunch, OpenAI and NBER, Google, SurveyMonkey, Tenet)
LLM Model Statistics
There is no reliable count of how many large language models exist, because most model repositories are fine-tunes or experiments rather than distinct models.
Model count keeps climbing while usage concentrates. Multi-model routing platforms support more than 300 active models from over 60 providers, yet the top three model authors account for over 70% of measured token volume.
The bigger shift is in what kind of model gets used. Reasoning models went from a negligible slice of usage in early 2025 to more than half of all tokens, and medium-sized models have taken share from small ones.
Reasoning models now handle more than half of all tokens
Tokens routed through reasoning optimized models exceeded 50% by late 2025, up from effectively nothing in the first quarter of that year. The shift followed the release of higher capability systems including GPT-5, Claude 4.5, and Gemini 3.
Leadership within the reasoning category turns over quickly. xAI’s Grok Code Fast 1 currently processes the largest share of reasoning traffic, ahead of Gemini 2.5 Pro and Gemini 2.5 Flash, with Grok 4 Fast and OpenAI’s gpt-oss-120b completing the top group. Gemini 2.5 Pro led the category only weeks earlier.
Medium sized models are taking share from small models
Small models under 15 billion parameters are losing usage share despite a steady supply of new releases. Medium models between 15 and 70 billion parameters have gone from a negligible segment to a competitive one, and large models above 70 billion parameters have diversified rather than consolidated.
The medium category effectively did not exist before Qwen2.5 Coder 32B arrived in November 2024.
It matured through Mistral Small 3 in January 2025 and GPT-OSS 20B in August 2025, which suggests users are optimizing for a balance of capability and efficiency rather than reaching for either extreme.
Context windows and parameter counts compared
Context windows among widely deployed models range from 8,000 tokens to 1 million, a 125 times spread.
Parameter counts among openly published models span from 1.6 billion to 405 billion.
The table below compares the specifications of the model generation that established the current competitive landscape. These are earlier releases and later versions have since shipped, so treat the numbers as a reference for how the field was structured rather than as current frontier specs.
| Model | Developer | Parameters | Context window |
|---|---|---|---|
| Gemini 1.5 | Not disclosed | 1,000,000 tokens | |
| Llama 3.1 | Meta | 405 billion | 128,000 tokens |
| Command R | Cohere | Not disclosed | 128,000 tokens |
| Claude 3.5 Sonnet | Anthropic | Not disclosed | 200,000 tokens |
| GPT-4 | OpenAI | Not disclosed | 32,000 tokens |
| Grok-1 | xAI | 314 billion | Not disclosed |
| PaLM 2 | 340 billion | Not disclosed | |
| Falcon 180B | Technology Innovation Institute | 180 billion | Not disclosed |
| Mixtral 8x22B | Mistral AI | 141 billion total, 39 billion active | Not disclosed |
| DBRX | Databricks and Mosaic ML | 132 billion total, 36 billion active | Not disclosed |
| Stable LM 2 12B | Stability AI | 12 billion | Not disclosed |
| Pythia | EleutherAI | 70 million to 12 billion | Not disclosed |
| XGen-7B | Salesforce | 7 billion | 8,000 tokens |
| Gemma | Google DeepMind | 2 billion and 7 billion | 8,000 tokens |
Mixture of experts architectures show up repeatedly in the larger models, activating between 27% and 28% of total parameters per input, which is how providers deliver large model capability at lower inference cost.
LLM benchmark performance
Benchmark leadership has changed hands repeatedly and rarely holds for more than a release cycle.
Claude 3 Opus led all models in 2023 with an average score of 84.83%, ahead of Gemini 1.5 Pro at about 80%, while OpenAI o1 posted the top math score at 94.8% as of March 2024.
Benchmark scores translate poorly to production. Model performance degrades significantly on domain-specific real-world data, and one test on insurance industry data returned only 22% accuracy that fell to zero on expert-level queries. Improvement on deep reasoning tasks that require multi-step logic, architecture decisions, or system-level thinking remains under 10%.
(Source: Statista, Prompt Quorum, Keywords Everywhere, OpenRouter, Second Talent, Tenet)
LLM Usage Statistics
Programming has become the single largest use case for large language models, growing from roughly 11% of total token volume in early 2025 to more than 50% in recent weeks.
That is a 4.5 times increase in one year and a 39-point gain in share.
Consumer usage looks nothing like developer usage. Roughly 75% of ChatGPT conversations focus on practical guidance and information seeking, about 70% of usage is personal rather than work-related, and only 1.9% of conversations involve relationships or personal reflection.
The shape of individual requests has changed as much as the mix of tasks. Average prompt length has grown nearly fourfold and average sequence length has nearly tripled, which points to models being used to reason over supplied material rather than generate text from scratch.
Programming grew from 11% to over 50% of token volume in one year
Programming related requests grew from about 11% of total token volume in early 2025 to over 50% by late in the year.
Anthropic’s models have dominated the category throughout, accounting for more than 60% of programming related spend for most of the observed period.
The competitive picture within programming is shifting at the edges. Anthropic’s share fell below 60% for the first time during the week of November 17, OpenAI expanded from roughly 2% to about 8% since July, and Google held steady at approximately 15%.
Open source providers including Z.AI, Qwen, and Mistral AI are gaining ground, with MiniMax rising fastest among recent entrants.
What people actually ask LLMs to do
Half of all ChatGPT usage involves asking for information, advice, or explanations, at 49%. Task completion accounts for 40% and creative expression for 11%.
This is the full breakdown of consumer usage by intent and context.
| Usage dimension | Category | Share |
|---|---|---|
| Intent | Asking for information, advice, research | 49% |
| Intent | Doing, including writing, planning, coding | 40% |
| Intent | Expressing, including creative writing and reflection | 11% |
| Context | Personal use | ~70% |
| Context | Work related use | ~30% |
| Specific use case | Tutoring and teaching | ~10% of all messages |
| Specific use case | Relationships and personal reflection | 1.9% |
Practical tasks account for roughly 75% of all conversations. Within work related conversations specifically, about 80% focus on information retrieval and decision making rather than coding or software development, which means the coding-heavy picture from developer platforms does not describe how most workers use these tools.
Roleplay accounts for about 52% of open source model usage
Roleplay is the largest single category for open weight models at roughly 52% of open source token volume, with programming second.
Together the two categories account for the majority of all open source usage.
Nearly 60% of roleplay tokens fall under roleplaying games, with writers resources at 15.6% and adult content at 15.4%, which points to interactive fiction and scenario generation rather than casual chat.
Chinese open source models show a different profile. Roleplay drops to around 33% while programming and technology together make up a combined majority at 39%, which means models like Qwen and DeepSeek are competing directly in technical work.
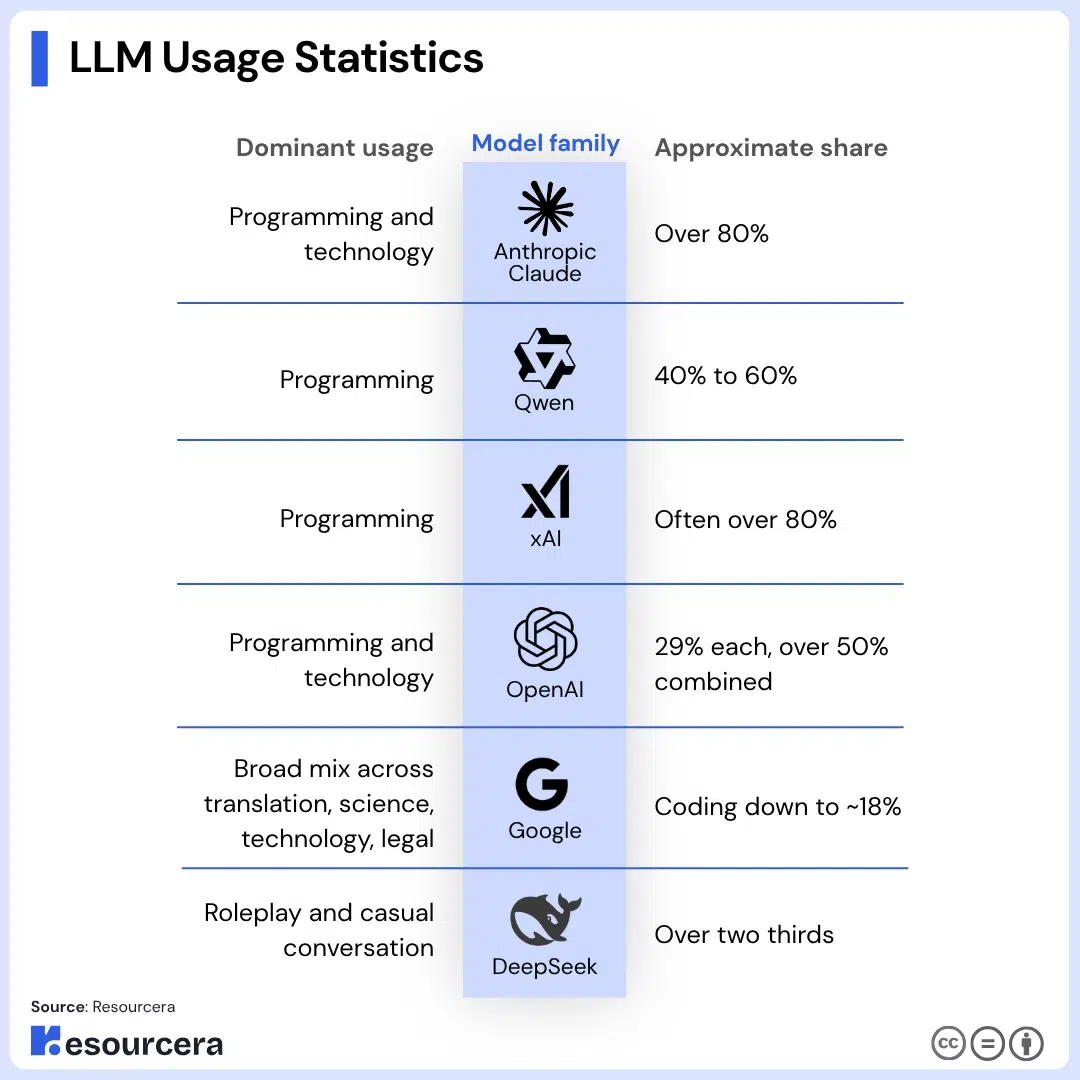
Provider level usage profiles diverge sharply. This table shows how each major model family’s token volume breaks down.
| Model family | Dominant usage | Approximate share |
|---|---|---|
| Anthropic Claude | Programming and technology | Over 80% |
| Qwen | Programming | 40% to 60% |
| xAI | Programming | Often over 80% |
| OpenAI | Programming and technology | 29% each, over 50% combined |
| Broad mix across translation, science, technology, legal | Coding down to ~18% | |
| DeepSeek | Roleplay and casual conversation | Over two thirds |
How professionals use LLMs at work
Research and information gathering is the most common workplace use case at 51.7%, followed by creative writing at 47% and email and communications at 45%.
Coding and scripting sits at 27.3%, notably higher than the share of respondents whose jobs actually involve coding.
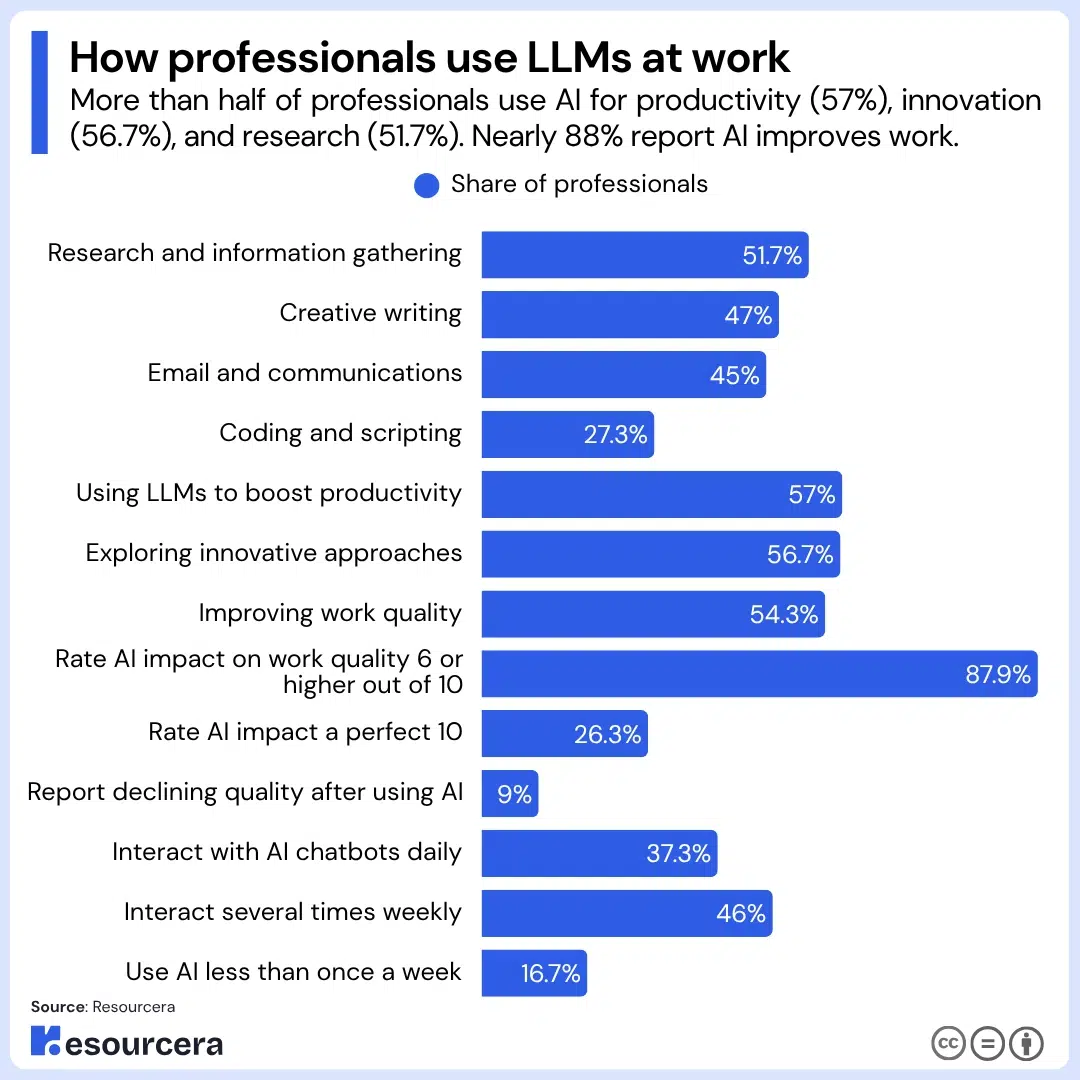
The table below covers the full set of reported workplace applications and perceived benefits.
| Workplace metric | Share of professionals |
|---|---|
| Research and information gathering | 51.7% |
| Creative writing | 47% |
| Email and communications | 45% |
| Coding and scripting | 27.3% |
| Using LLMs to boost productivity | 57% |
| Exploring innovative approaches | 56.7% |
| Improving work quality | 54.3% |
| Rate AI impact on work quality 6 or higher out of 10 | 87.9% |
| Rate AI impact a perfect 10 | 26.3% |
| Report declining quality after using AI | 9% |
| Interact with AI chatbots daily | 37.3% |
| Interact several times weekly | 46% |
| Use AI less than once a week | 16.7% |
Named benefits skew toward time rather than quality. 26.7% name time savings as the most important benefit, followed by creativity and idea generation at 19%, accuracy and consistency at 17%, decision making at 16%, and data analysis at 11%.
Women were more likely to name creativity as the key benefit at 22.3% against 16.2% of men.
Platform loyalty is high. 61.3% of AI users rely on a single platform, and ChatGPT is the leading choice among single-platform users at a 38% share. 82.2% of ChatGPT users visited no competing platform at all, against 49.1% for Gemini.
Average prompt length has grown nearly fourfold
Average prompt tokens per request have grown roughly four times, from around 1,500 to over 6,000, while completions have nearly tripled from about 150 to 400 tokens.
Average sequence length has more than tripled from under 2,000 tokens in late 2023 to over 5,400 by late 2025.
Programming drives almost all of that growth. Requests involving code understanding, debugging, and generation routinely exceed 20,000 input tokens and average three to four times the length of general-purpose prompts, while other categories remain flat.
Tool calling has risen alongside sequence length. Tool provision is concentrated among models explicitly built for agentic work, with Claude Sonnet and Gemini Flash leading, and Claude 4.5 Sonnet gaining share rapidly from late September onward.
LLM usage by language
English accounts for 82.87% of all token volume, more than 16 times the next largest language. Simplified Chinese follows at 4.95% and Russian at 2.47%.
Here is the full language distribution by token share.
| Language | Token share |
|---|---|
| English | 82.87% |
| Chinese (Simplified) | 4.95% |
| Russian | 2.47% |
| Spanish | 1.43% |
| Thai | 1.03% |
| Other combined | 7.25% |
(Source: Amperly, OpenRouter, OpenAI and NBER, Tenet)
LLM Revenue Statistics
OpenAI leads the commercial LLM market with an annualized revenue run rate above $20 billion, roughly 2.2 times its projected full year 2025 revenue of about $13 billion. Anthropic follows at a $14 billion run rate reached by early 2026.
Anthropic grew faster off a smaller base. Its revenue climbed roughly 8.6 times in a single year, from about $700 million in 2024 to $6 billion in 2025, then more than doubled again on a run rate basis to $14 billion by early 2026.
Consumer monetization remains thin relative to reach. Working from a $20 billion run rate against over 1.1 billion monthly users, OpenAI generates roughly $18 per user per year, which reflects how much of its revenue comes from a small paying minority and enterprise contracts rather than broad consumer conversion.
OpenAI is larger in absolute revenue while Anthropic is more enterprise concentrated, with about 80% of Anthropic’s revenue coming from enterprise and developer workloads. Anthropic also carries the higher valuation multiple relative to revenue.
This table compares every reported financial metric across both companies.
| Metric | OpenAI | Anthropic |
|---|---|---|
| Revenue 2024 | ~$6 billion | ~$700 million |
| Revenue H1 2025 | $4.3 billion | Not reported |
| Revenue 2025 | ~$13 billion projected | ~$6 billion |
| Annualized run rate | $20+ billion (2025) | $14 billion (early 2026) |
| Year over year growth | 2.2x | 8.6x |
| Valuation | ~$730 billion | $380 billion |
| Latest funding round | $110 billion | $30 billion |
| Paying consumer subscribers | 50 million | Not reported |
| Business customers | 2 million+ paying business users | 300,000+ |
| Revenue from enterprise and developers | Not disclosed | ~80% |
Claude Code alone reached a $2.5 billion annualized run rate, which is about 18% of Anthropic’s total run rate from a single product. Business subscriptions for Claude Code quadrupled during early 2026 and enterprise customers now generate more than half of its revenue.
Google monetizes through cloud rather than standalone subscriptions. Alphabet’s cloud business surpassed a $50 billion annual run rate with Gemini named as a major driver.
Returns at the buyer end justify the spending for most organizations. Generative AI delivers about $3.70 in return per dollar invested on average, with top performers reaching $10.30, and 74% of organizations report positive ROI. Financial services shows the highest return potential, followed by media, telecommunications, and retail.
(Source: Microsoft and IDC, Typedef)
LLM Adoption by Industry
Healthcare now leads the LLM market by industry vertical, overtaking retail and ecommerce which held 27.5% share in 2024. Finance is projected to grow fastest from here.
Value creation is concentrated rather than spread evenly. About 75% of generative AI value comes from four areas, namely customer operations, marketing, engineering, and R&D, and 43% of organizations report their greatest return from productivity applications specifically.
Vendor leadership varies sharply by sector, which means no single provider dominates enterprise deployment across the board.
Which provider leads which industry
Google leads retail and ecommerce with a 43% share, while Microsoft Azure AI leads manufacturing with 44%. OpenAI leads technical functions, with about 53% of IT and engineering teams reporting use of its tools.
This table shows the leading provider and its share in each sector where data exists.
| Sector or function | Leading provider | Share |
|---|---|---|
| Retail and ecommerce | Google Gemini | 43% |
| Manufacturing | Microsoft Azure AI | 44% |
| IT and engineering | OpenAI | 53% |
| Healthcare | Google Cloud AI | 42% |
| Finance, operations, and HR | Google Cloud AI | 38% |
Google’s enterprise footprint extends well beyond those sectors. More than 85,000 enterprises build with Gemini models, enterprise usage grew 35 times year over year, and Google has sold over 8 million paid Gemini Enterprise seats across more than 2,800 organizations.
95% of the world’s top 20 SaaS companies and 80% of the top 100 companies use Gemini products in some capacity.
Model selection for commercial deployment
Over 50% of firms planning commercial deployment choose Llama and Llama-style models, making open-weight architectures the most commonly selected option. Embedding models such as BERT follow at 26% and multimodal models trail at just 7%.
Language work is where the opportunity concentrates. Language tasks account for 62% of total worked hours, and 65% of those tasks can be automated or augmented, which explains why text-focused models still dominate deployment plans over multimodal alternatives.
Automation potential varies enormously by occupation. Office support roles reach 87% automation potential with generative AI against 66% without it, while educator and workforce training roles show the largest relative jump, from 15% to 54%.
Financial services shows the deepest single deployment on record, with nearly 60% of Bank of America’s clients using LLM-powered products for guidance on investments, insurance, and retirement planning.
(Source: Accenture, McKinsey 2, Bank of America, Precedence Research, Statista, Tenet, Second Talent)
LLM Accuracy, Trust, and Risk Statistics
Inaccuracy has overtaken every other concern as the top cited AI risk, named by 74% of organizations and up 14 percentage points in a single year. It now ranks ahead of cybersecurity at 72%, regulatory compliance at 63%, and privacy at 54%.
The concern is well founded. Hallucination rates across 26 leading foundation models range from 22% to 94%, which means even top-performing models produce inaccurate output roughly one time in five.
Governance is improving but has not caught up with deployment. Average responsible AI maturity rose to 2.3 on a 4-point scale, up from 2.0 the year before, yet only about 30% of organizations have reached level 3 or higher in strategy, governance, and agentic controls.
Hallucination rates range from 22% to 94% across leading models
Testing across 26 leading foundation models produced hallucination rates spanning 22% to 94%. Even the best performing models in that set are wrong about one time in five.
Real world data degrades performance further. One test on insurance industry data returned 22% accuracy that dropped to zero on mid level and expert level requests, and improvement on tasks requiring multi step reasoning or system level thinking remains under 10%.
Bias persists across every model tested. All major models show measurable gender bias, with GPT-2 reducing female related word usage by 43% compared with human writing, and even the least biased model used 24.5% fewer female specific terms than human text. In hiring test scenarios models favored white sounding names 85% of the time.
95% of enterprise generative AI pilots fail to deliver rapid revenue impact
Only 5% of generative AI programs achieve rapid revenue acceleration, with broader research showing failure rates of 85% to 95% for enterprise implementations. Just 54% of models successfully move from pilot to production, and even fewer reach meaningful scale.
The causes are organizational rather than technical. Common blockers include unclear business objectives, insufficient governance, and infrastructure not designed for inference workloads.
Strategic vendor partnerships show 67% success rates against 33% for internal builds, and the average enterprise invests $1.9 million in generative AI initiatives before seeing whether it works.
Governance is lagging adoption
Only 21% of companies report having a mature governance model for autonomous agents, even though 74% expect to deploy agentic AI within two years. The gap between capability and control shows up in nearly every risk category measured.
This table sets adoption against the governance in place to manage it.
| Governance metric | Figure |
|---|---|
| Organizations already using AI agents | 82% |
| Organizations with security policies governing agents | 44% |
| Organizations reporting agents took unintended actions | 80% |
| Companies with mature agent governance model | 21% |
| Organizations that have reached responsible AI maturity level 3+ | ~30% |
| Organizations with a strong responsible AI framework | 6% |
| Organizations with no responsible AI policy at all | 11% |
| Organizations citing knowledge and training gaps as top barrier | ~60% |
Explicit ownership is the strongest single predictor of maturity. Organizations with clear assigned responsibility for responsible AI score 2.6 on average against 1.8 for those without it, and organizations investing $25 million or more in responsible AI are far more likely to see AI impact exceed 5% of EBIT.
Incident response is where the gap becomes operational. AI incident rates have held steady at around 8%, but almost 60% of organizations that experienced an incident rate their own response as satisfactory or worse.
Separately, 97% of organizations experienced generative AI security incidents in 2023, and 44% report at least one negative generative AI outcome.
Data readiness is the other bottleneck. 70% of organizations face data problems, including weak governance or limited training data; 59% say they need major data upgrades before scaling, and only 49% of data sources are cloud based.
Organizations are responding by enabling rather than blocking. Outright bans on generative AI use fell 21 percentage points year over year, 90% of companies expanded privacy programs in direct response to AI, and 93% plan further investment.
Concern about intellectual property and copyright risk actually fell from 69% to 55%, which suggests risk priorities are shifting rather than uniformly rising.
Sovereign AI has become a purchasing criterion. 77% of companies now factor an AI solution’s country of origin into vendor selection and 58% build their AI stack primarily with local vendors.
(Source: SailPoint, Cisco, Fortune and MIT, Nature, McKinsey, Stanford HAI, Deloitte, Second Talent)
LLMs and Search Visibility
Google AI Overviews now appear in roughly 18% of searches, based on averaging findings across five independent studies with a range of 12% to 30%. Those summaries reach over 1.5 billion users each month.
Click behavior has shifted measurably. Click through rate drops about 34% when an AI Overview is present, averaging four studies with a range from 15.49% to 56.1%.
Traffic volume tells a different story than traffic share. Google still sends roughly 210 times more clicks than ChatGPT, Perplexity, and Gemini combined, and AI drives just 0.1% of total referral traffic, so the visibility problem is currently larger than the traffic problem.
Where LLMs pull their citations from
AI Overviews cite 13.3 sources on average, and only 33.42% of those links overlap with the top 10 organic results. Nearly 90% of ChatGPT citations come from pages ranked 21 or lower.
Concentration is still high at the top. The 50 largest domains supply 28.9% of all AI Overview citations, and 43.42% of AI Overviews cite Google itself, which limits how many genuine external clicks a brand can win.
Cross platform overlap is minimal. Only 14% of top sources appear across Google AI, ChatGPT, and Perplexity, with just seven out of 50 sources shared, which means winning visibility on one engine does not carry to another.
Content signals that measurably improve citation odds are worth noting for anyone publishing data driven content. Adding a source line lifted visibility in generative results by 132.4%, adding a relevant statistic lifted it by 65.5%, and using a more authoritative tone lifted it by 89.1%.
Traffic quality partly offsets traffic volume. An AI search visitor is worth 4.4 times a classic organic visitor, ChatGPT users click 1.4 external links per visit against Google’s 0.6, and 90% of buyers click sources featured in an AI Overview.
Reading behavior inside the panel matters as much as being cited. 88% of users click to expand truncated AI Overviews, but 70% of searchers stop reading after the first third, so a mention that comes late is a mention most users never see.
(Source: Originality.ai, Ahrefs, Semrush, SE Ranking, Pew Research Center 2, Conductor, Amsive, Seer Interactive, Google)
The Future of LLMs
Agentic AI use is expected to jump from 23% to 74% of companies within two years, a 3.2 times increase and a 51 point gain.
That is a faster ramp than physical AI covering robotics and automated machinery, which is projected to grow from 58% to 80% over the same window.
The agentic market is forecast to grow from $9.14 billion in 2026 to $139.19 billion by 2034, a 40.6% compound rate that outpaces the broader LLM market.
Only 5% of companies expect agents to be fully integrated as a core part of operations, and 85% expect to customize agents rather than deploy off-the-shelf products.
Adoption forecasts extend into infrastructure decisions. 30% of enterprises are expected to automate more than half of their network operations using AI in 2026, up from under 10% in mid 2023.
Labor market effects are already visible and uneven. AI job postings requiring agentic skills surged over the past year alongside a nearly 20% decline in employment for software developers aged 22 to 25 from their 2024 peak, which suggests disruption is landing by career stage rather than across the workforce evenly.
Public sentiment is improving while anxiety persists. 59% of people globally now say AI products have more benefits than drawbacks, up from 55% the year before, even as 52% separately report feeling nervous about AI powered products.
Longer range projections point to continued expansion. The generative AI market is forecast to reach $1.3 trillion within ten years, generative AI could raise labor productivity by 0.1% to 0.6% annually through 2040, and measured productivity gains currently average 7.8% with peaks around 25%.
(Source: Deloitte, Stanford HAI, Gartner, Bloomberg Intelligence, McKinsey 2, Hostinger)