

YouTube TV has more than 10 million subscribers in 2026, making it one of the largest pay TV providers in the United States.
It is also projected to become the largest US pay TV provider by 2027.
The service launched in 2017 at $34.99 per month with a relatively small channel lineup. Today, YouTube TV costs $82.99 per month, offers more than 100 live channels, and accounts for around 44% of the live TV streaming market. Its subscriber base is now larger than Hulu + Live TV, Sling TV, and Fubo combined.
In this article, we break down the latest YouTube TV statistics, including subscriber growth, revenue, pricing, and market share.
Let’s quickly get into the details.
Key YouTube TV Statistics (2026)
- YouTube TV has more than 10 million subscribers as of 2026.
- YouTube TV is the third largest pay TV provider in the US, behind Charter and Comcast.
- The service holds roughly 44% of the US live TV streaming market.
- YouTube TV added about 750,000 subscribers in Q3 2025 alone.
- Estimated YouTube TV revenue reached about $6 billion in 2023.
- YouTube as a whole generated more than $60 billion in revenue in 2025, more than Netflix.
- NFL Sunday Ticket reached about 1.8 million subscribers in September 2024.
- The Disney and ESPN blackout in late 2025 lasted two weeks and triggered $20 subscriber credits.
- The base plan costs $82.99 per month, 137% more than the launch price.
YouTube TV Subscriber Statistics
YouTube TV passed 1 million subscribers in 2019 and crossed 10 million roughly six years later, all while the wider pay TV market lost tens of millions of customers.
How Many Subscribers Does YouTube TV Have?
YouTube TV has more than 10 million subscribers as of 2026.
It added roughly 750,000 subscribers in Q3 2025. That was a slower pace than YouTube TV managed in previous third quarters, and the January 2025 price increase is the most likely reason. Plus, Google confirmed 8 million subscribers in February 2024.
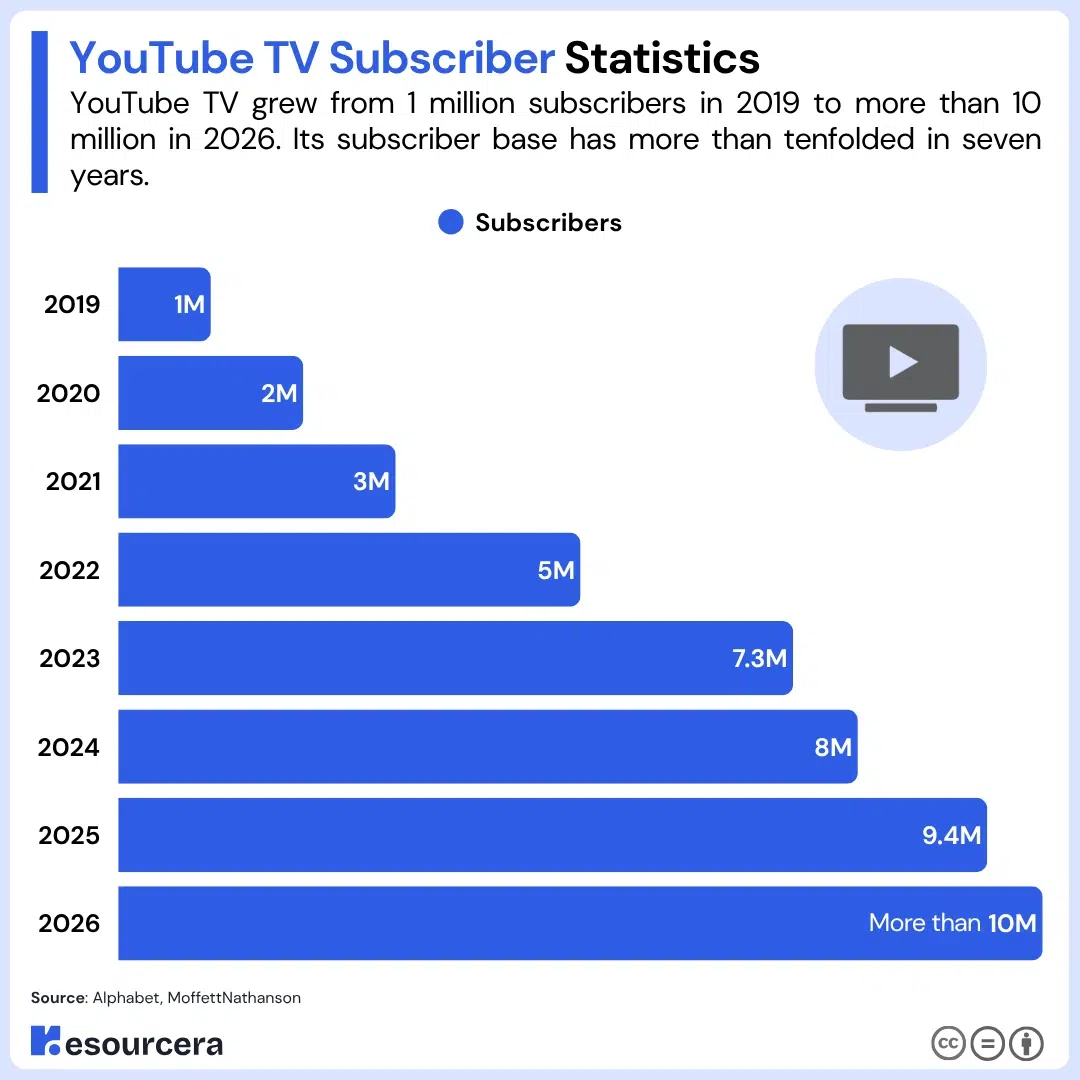
The table below tracks every publicly reported subscriber milestone since 2019.
| Date | Subscribers |
|---|---|
| 2019 | 1 million |
| 2020 | 2 million |
| 2021 | 3 million |
| 2022 | 5 million |
| 2023 | 7.3 million |
| 2024 | 8 million |
| 2025 | 9.4 million |
| 2026 | More than 10 million |
YouTube TV took about five years to reach its first 5 million subscribers and only three more years to double that.
YouTube TV Churn Statistics
Monthly churn across the live TV streaming category ran at 4.5% in Q3 2025. Since 2023, that rate has moved between 4.1% and 7.1% depending on the quarter and the sports calendar.
Cancellations spike in the first quarter of each year once football season ends.
Live TV streaming services collectively lost about 948,000 subscribers in Q1 2026, part of a total US pay TV loss of 2.03 million in those three months.
Sources: Alphabet, MoffettNathanson, Antenna, Bloomberg
YouTube TV User Demographics
Public demographic data on YouTube TV subscribers is limited, since detailed audience breakdowns sit behind paid enterprise research licenses.
The available survey data shows live TV streaming subscription rates are highest among adults aged 18 to 44, at roughly 9%, and fall sharply among those 65 and over. The core audience has consistently been described as cord cutters and cord nevers, with meaningful adoption above the age of 35.
One point is worth stating clearly. Demographics for the free YouTube platform do not describe YouTube TV subscribers.
The free platform reaches billions of users worldwide, while YouTube TV is a US subscription service with under 11 million customers, and the two audiences differ sharply in age, income, and geography.
Sources: YouGov, TechCrunch
YouTube TV Revenue and Financial Statistics
YouTube TV generates billions in annual revenue, though Google reports it inside a larger segment rather than as a standalone line item.
YouTube TV Revenue
YouTube TV generated roughly $6 billion in revenue in 2023, up from about $900 million in 2019. That represented around 13% of YouTube’s total revenue for the year.
The service also turned profitable during this period. YouTube TV posted an operating loss of about $300 million in 2023, then swung to roughly $200 million in operating income in 2024, its first profitable year.
Alphabet disclosed total YouTube revenue for the first time in early 2026. The table below shows the most recent figures.
| Metric | Figure |
|---|---|
| YouTube total revenue 2025 | More than $60 billion |
| YouTube ad revenue 2025 | $40.37 billion |
| YouTube ad revenue Q4 2025 | $11.38 billion |
| YouTube ad revenue 2024 | $36.15 billion |
| Subscriptions, platforms and devices Q4 2025 | $13.6 billion |
| Paid subscriptions across Google services Q4 2025 | More than 325 million |
YouTube now earns more than Netflix, which reported $45.2 billion in revenue for 2025. Valued as a standalone company, YouTube would be worth somewhere between $500 billion and $560 billion.
Sources: Alphabet Q4 2025 earnings, Alphabet FY2024 report, Forbes, Netflix
YouTube TV Pricing Statistics
Pricing is the most transparent part of the YouTube TV story. Every increase since launch was announced publicly, so the timeline below carries no estimation at all.
YouTube TV Price Increase History
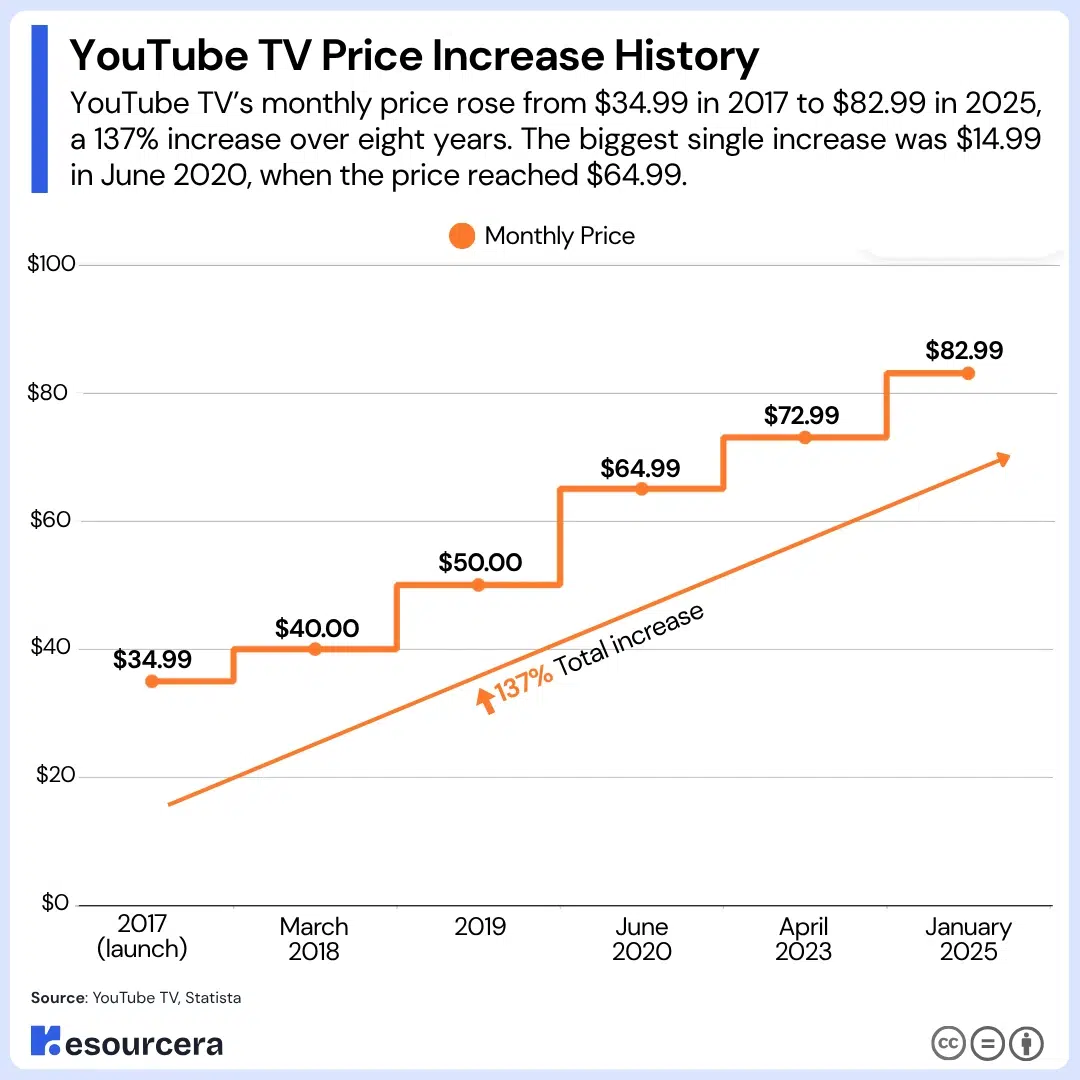
YouTube TV launched at $34.99 per month in 2017 and now costs $82.99. The table below tracks every change.
| Effective Date | Monthly Price | Increase |
|---|---|---|
| 2017 (launch) | $34.99 | Launch price |
| March 2018 | $40.00 | $5.05 |
| 2019 | $50.00 | $10.00 |
| June 2020 | $64.99 | $14.99 |
| April 2023 | $72.99 | $8.00 |
| January 2025 | $82.99 | $10.00 |
How Much Has YouTube TV Gone Up Since Launch?
YouTube TV costs 137% more than it did at launch. The base plan has risen by $48 per month, taking the annual cost from about $420 to about $996.
The January 2025 increase alone was a 14% jump. It was announced in December 2024 and applied to existing subscribers on their first billing cycle after January 13, 2025.
YouTube TV vs Competitor Pricing
YouTube TV and Hulu + Live TV now cost exactly the same at the entry tier, which makes channel lineup and interface the deciding factors rather than price. On tracked channel counts, YouTube TV carries 78 against Hulu’s 75.
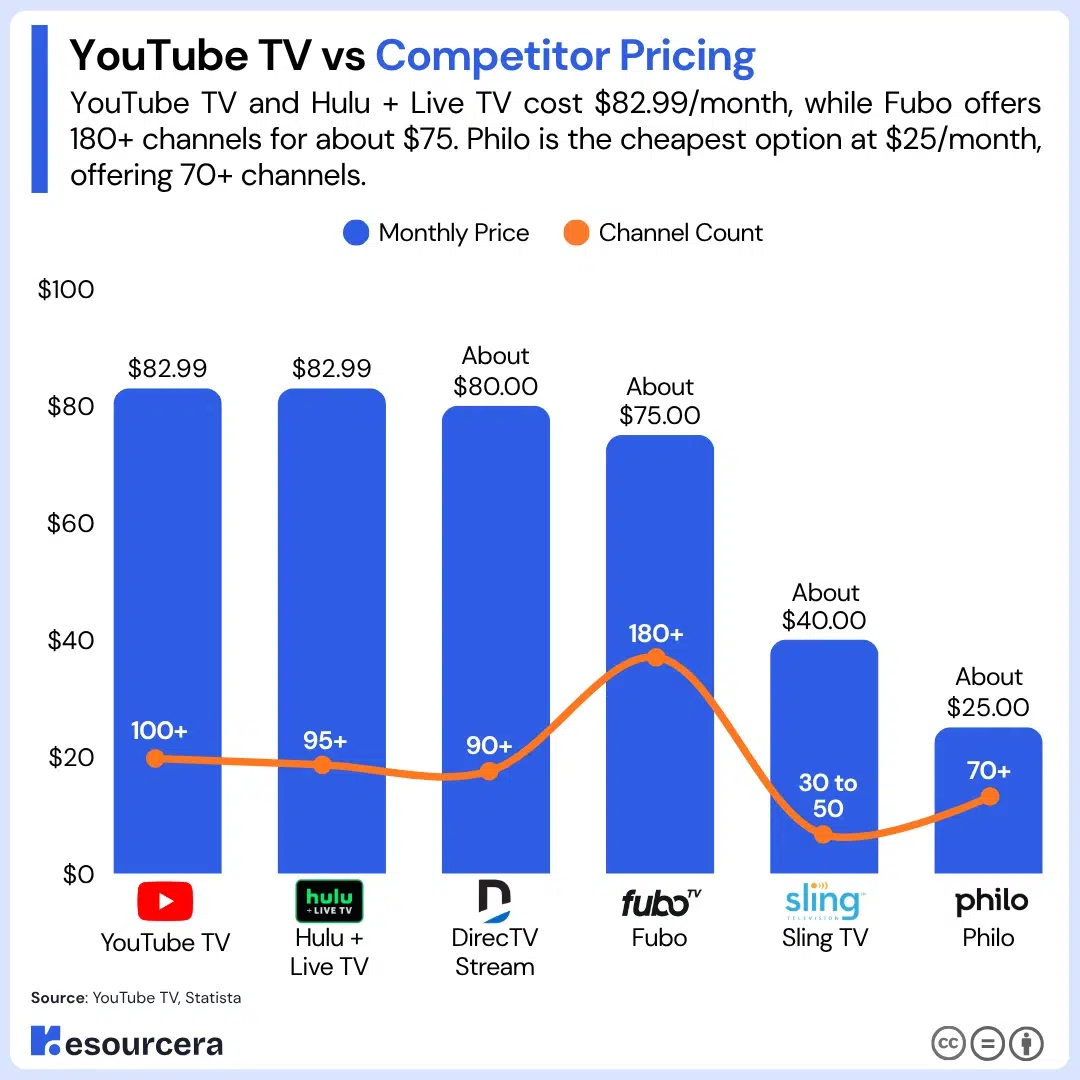
The table below compares base plan pricing across the major live TV streaming services.
| Service | Monthly Price | Channel Count |
|---|---|---|
| YouTube TV | $82.99 | 100+ |
| Hulu + Live TV | $82.99 | 95+ |
| DirecTV Stream | About $80.00 | 90+ |
| Fubo | About $75.00 | 180+ |
| Sling TV | From $40.00 | 30 to 50 |
| Philo | From $25.00 | 70+ |
Sources: YouTube TV, Statista
YouTube TV Market Share and Competitive Position
YouTube TV competes in two markets at once. Among live TV streaming services, it is the runaway leader, and among all pay TV providers including cable and satellite, it now ranks third.
YouTube TV Market Share Among Live TV Streaming Services
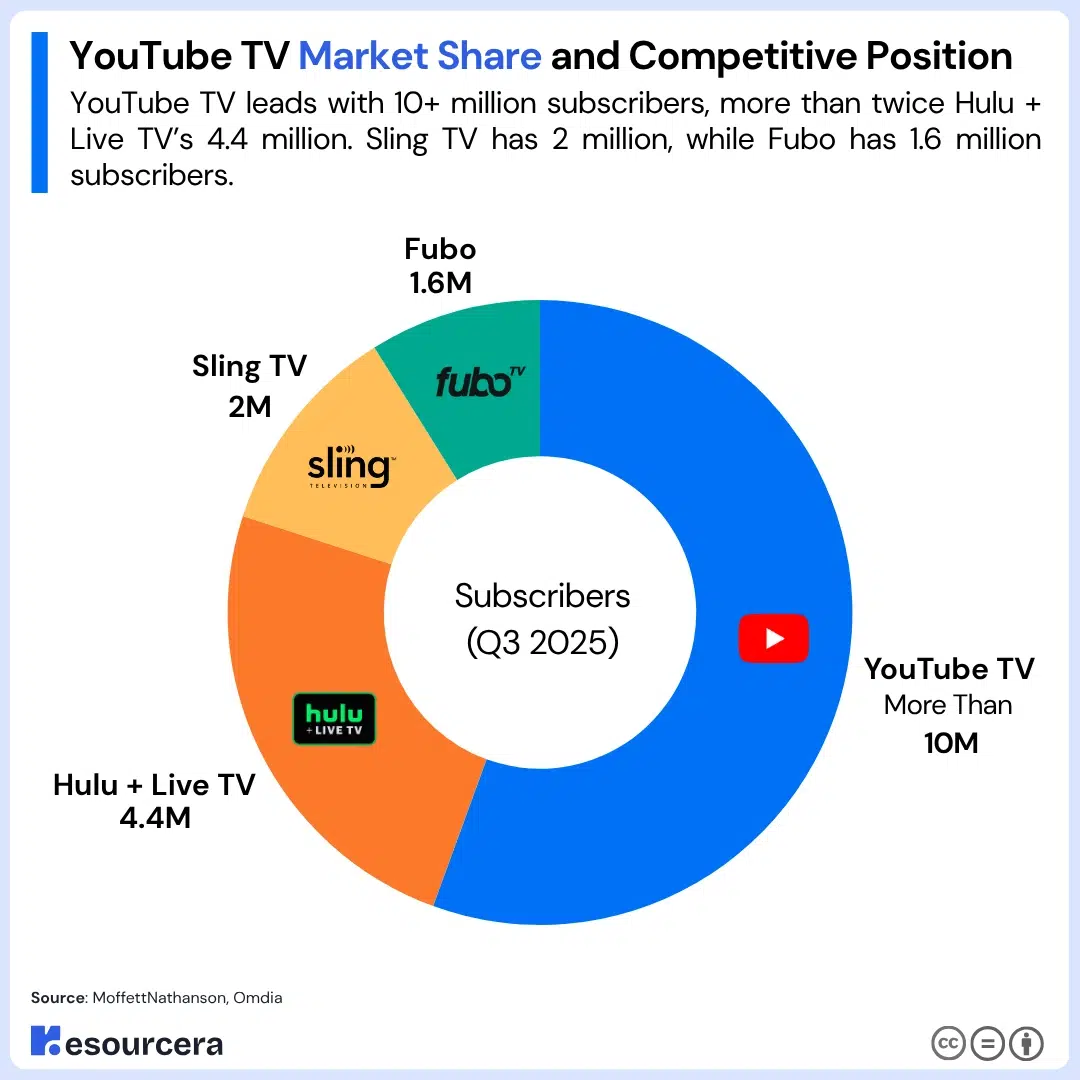
YouTube TV holds roughly 44% of the US live TV streaming market, up six percentage points year over year. It has more subscribers than its three closest rivals combined.
| Service | Subscribers (Q3 2025) | Year Over Year Change |
|---|---|---|
| YouTube TV | More than 10 million | Up, 750,000 added in Q3 |
| Hulu + Live TV | 4.4 million | Down 4% |
| Sling TV | 2.0 million | Down 7% |
| Fubo | 1.6 million | Up, 270,000 added in Q3 |
The competitive landscape shifted in October 2025 when Fubo and Hulu + Live TV completed their merger, creating a combined business of about 6 million subscribers with Disney holding roughly 70% ownership. The merged company is now the sixth largest pay TV provider in the US, still well behind YouTube TV.
YouTube TV vs Cable and Satellite Providers
Measured against every pay TV provider in the country, YouTube TV ranks third.
| Provider | Subscribers | Type |
|---|---|---|
| Charter (Spectrum) | 11.4 million | Cable |
| Comcast (Xfinity) | 10.6 million | Cable |
| YouTube TV | More than 10 million | Streaming |
The gap is closing quickly. Charter and Comcast are both losing subscribers every quarter while YouTube TV continues to add them.
YouTube TV is forecast to become the largest US pay TV operator in 2027. Projections for the end of that year put YouTube TV at 10.4 million subscribers, Charter at 10.0 million, and Comcast at 9.2 million.
That would mark the first time in the history of American television that the largest pay TV operator is a virtual provider with no physical network of its own.
Sources: thewrap, Antenna, Businesswire, nScreenMedia
Cord Cutting Statistics and the Pay TV Decline
YouTube TV is growing inside a market that is shrinking fast, and that context matters. The service is not expanding the pay TV market. It is taking a larger share of a smaller one.
The table below tracks total US pay TV subscribers.
| Year | Total US Pay TV Subscribers |
|---|---|
| 2018 | 92.3 million |
| 2019 | 89.1 million |
| 2020 | 85.6 million |
| 2021 | 80.7 million |
| 2022 | 76.0 million |
| 2023 | 71.2 million |
The decline has continued. The US pay TV market ended Q1 2026 with 62.23 million subscribers, split between 40.90 million traditional and 21.33 million streaming, after losing 2.03 million in a single quarter.
Pay TV now reaches fewer than 55% of American households, the lowest penetration since 1989.
Sources: Leichtman Research Group, Lightreading
NFL Sunday Ticket Statistics
NFL Sunday Ticket was the largest content deal in YouTube TV history and the single biggest driver of new subscribers the service has used.
The NFL Sunday Ticket Deal
Google holds exclusive residential rights to NFL Sunday Ticket under a seven-year agreement announced in December 2022. The deal is worth roughly $2 billion per year for residential rights plus about $200 million in distribution rights, and it runs from the 2023 season through 2029.
DirecTV had held the package since 1994 and was paying about $1.5 billion per year before losing it. The NFL had originally sought $2.5 billion per season.
NFL Sunday Ticket Subscriber Numbers
The package has grown steadily across its first two seasons under YouTube.
- 1.8 million subscribers in September 2024, up 33.2% year over year
- 1.3 million subscribers through September 2023, the first season under YouTube
- 61% of subscriptions came through YouTube TV rather than standalone purchase
- 250,000 additional YouTube TV subscribers were driven by the package through September 2023
- About 1 million standalone subscribers bought it through YouTube Primetime Channels
Google reported that the most recent season delivered the highest paid subscriber total Sunday Ticket has ever recorded, without releasing a figure.
Sources: Antenna, MoffettNathanson, CNBC, Sportico
YouTube on TV Screens vs YouTube TV
These are two different products that share a name. YouTube TV is the paid live television subscription covered throughout this page. YouTube on TV screens means watching the free YouTube platform on a connected television, with no subscription involved.
The figures below cover the second of those and are included for context.
| Month | YouTube Share of US TV Viewing |
|---|---|
| February 2023 | 7.9% |
| February 2025 | 11.6% |
| April 2025 | 12.4% |
| May 2025 | 12.5% |
| July 2025 | 13.4% |
| September 2025 | 12.6% |
| November 2025 | 13.9% |
| December 2025 | 12.7% |
YouTube has ranked first among all media distributors for extended stretches since early 2025. Its July 2025 peak of 13.4% gave it a four-point lead over Disney at 9.4%, the widest margin any company has recorded since this measurement began in November 2023.
Viewers worldwide now watch more than one billion hours of YouTube content on television sets every day.
One methodology note applies to the table above. YouTube TV viewing is counted within the broadcast and cable segments rather than inside the YouTube figure, so these percentages exclude YouTube TV entirely.

