


Artificial intelligence will displace 92 million jobs worldwide by 2030 while creating 170 million new ones, leaving a net gain of 78 million positions.
Combined, that churn touches 22% of every formal job on the planet. The picture inside the United States is sharper. Between 10% and 15% of US jobs are vulnerable to elimination over the next four to five years, which works out to 16.5 million to 24.8 million positions.
Far more jobs, 50% to 55% of the US total, will be reshaped rather than removed.
The gap between those two numbers explains most of the confusion in this debate. Task automation potential is not the same thing as job loss, and job loss is not the same thing as unemployment.
This report covers how many jobs AI will replace and when, which roles are already shrinking, what US labor data shows right now, how employers are actually responding, and which workers carry the most risk.
Key Highlights AI Jobs Replacement Statistics 2026
- By 2030, around 92 million jobs worldwide could disappear, while 170 million new jobs could be created.
- An average of 18.4 million jobs could be displaced each year through 2030.
- In the United States, 10% to 15% of jobs could disappear within the next four to five years. Around 50% to 55% of jobs could change significantly within just two to three years.
- About 43% of US jobs include tasks that are at least 40% automatable. The remaining 57% have a lower risk of automation.
- Humans currently complete 47% of all work tasks without help from machines. By 2030, this share is expected to fall to 33%.
- AI was linked to 54,836 announced job cuts in the United States in 2025. This represented 4.7% of the 1.17 million job cuts announced that year.
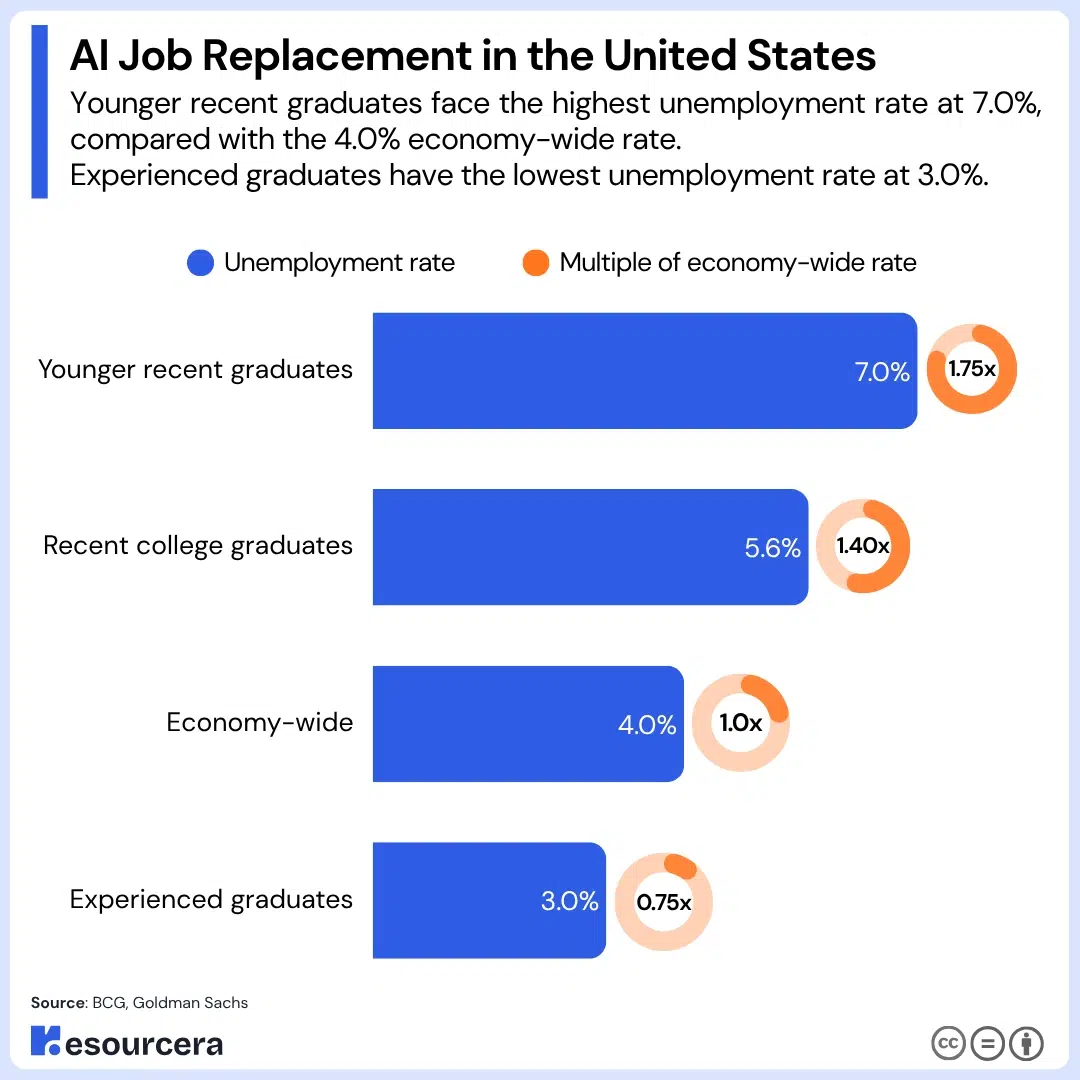
- Recent US college graduates have an unemployment rate of 5.6%. This is 1.4 times higher than the overall unemployment rate and 1.87 times higher than the rate for experienced graduates.
- Around 79% of employed US women work in jobs with a high risk of automation, compared with 58% of employed men.
- By 2030, around 39% of workers’ main skills are expected to change. This is lower than the peak of 57% recorded in 2020.
How Many Jobs Will AI Replace by 2030?
By 2030, AI will replace over 92 million jobs worldwide, while creating 170 million new AI jobs
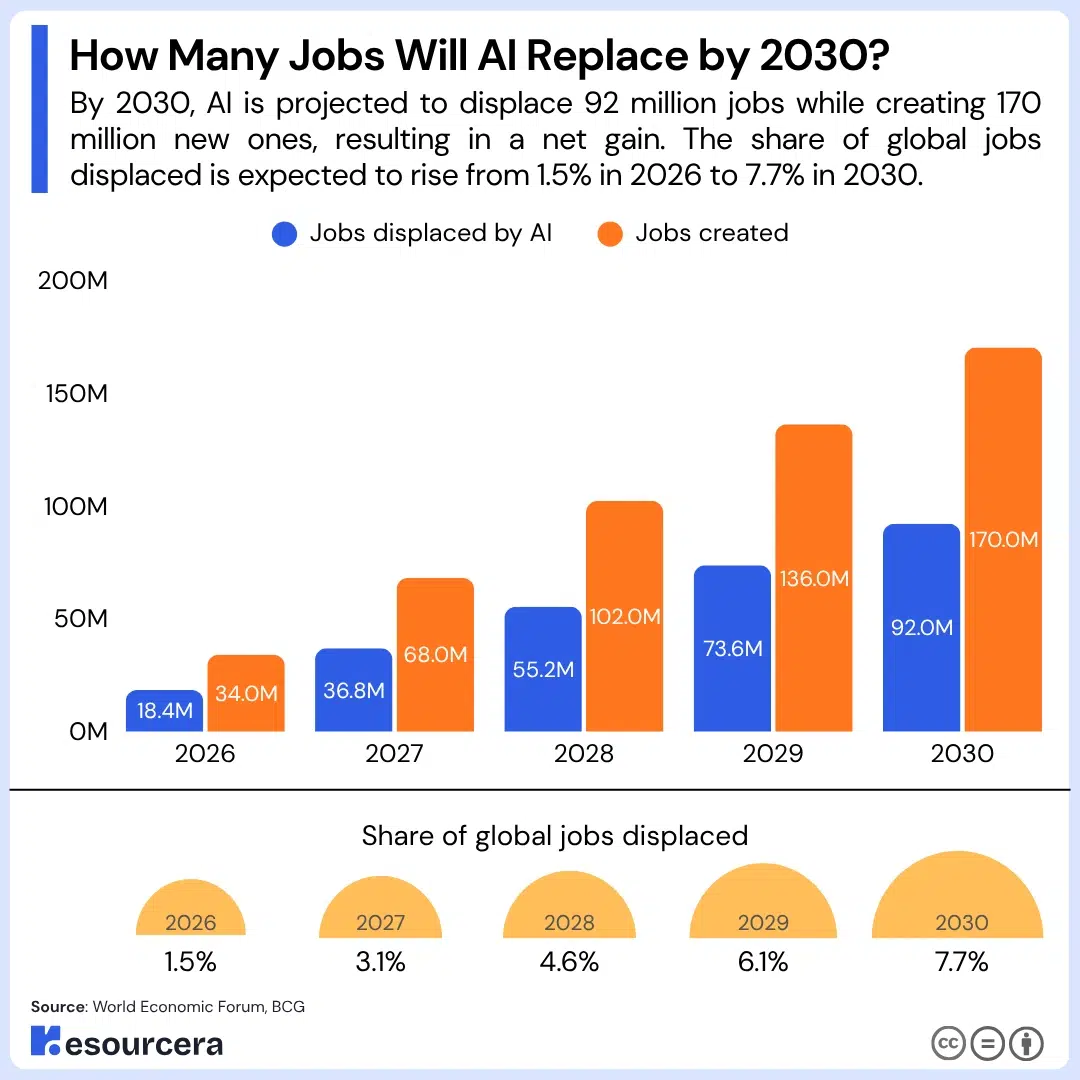
That is 8% of formal employment removed, 14% added, and 22% of all jobs either created or destroyed inside five years.
In the US, over 30% of current jobs can be automated by 2030, while 60% of the organisational tasks will be assisted by AI.
Infact, over 23% of U.S. companies have already replaced employees with LLMs.
Displacement will not arrive as a single event. Spread across the forecast window, it averages 18.4 million jobs per year globally, offset by 34 million created.
| Year | Jobs displaced by AI | Jobs created | Share of global jobs displaced |
|---|---|---|---|
| 2026 | 18.4 million | 34.0 million | 1.5% |
| 2027* | 36.8 million | 68.0 million | 3.1% |
| 2028* | 55.2 million | 102.0 million | 4.6% |
| 2029* | 73.6 million | 136.0 million | 6.1% |
| 2030* | 92.0 million | 170.0 million | 7.7% |
The annual figures above distribute the 2025 to 2030 totals evenly across the period. Real displacement will almost certainly back-load, because adoption is still climbing and integration capacity is the constraint rather than model capability.
On that reading, the 2026 and 2027 rows overstate what will actually happen, and the 2029 and 2030 rows understate it.
(Sources: World Economic Forum, BCG, Goldman Sachs)
Replaced vs Reshaped by AI: What These Numbers Actually Measure
Only 10% to 15% of US jobs face elimination, while 50% to 55% will change substantially but survive. Between three and five jobs get reshaped for every one that disappears.
Whether automation removes a job or transforms it comes down to two questions. Does AI substitute for the worker or augment them, and does cheaper output expand total demand or leave it fixed?
A role where AI does the work and demand stays flat loses headcount. A role where AI does the work but lower costs unlock new customers may hold steady or grow.
Applying both questions across roughly 1,500 US role types produces six distinct outcomes.
| Segment | Share of US jobs | Extimated jobs | How AI affects the role |
|---|---|---|---|
| Limited exposure | 34% | 56.1 million | AI has little impact |
| Enabled | 23% | 38.0 million | AI becomes part of daily work |
| Rebalanced | 14% | 23.1 million | AI supports workers and changes their tasks |
| Divergent | 12% | 19.8 million | AI replaces some tasks, while demand can grow |
| Substituted | 12% | 19.8 million | AI replaces many tasks and demand remains limited |
| Amplified | 5% | 8.3 million | AI improves productivity while demand grows |
Call center representatives sit in the substituted group. Their work is structured, interactions are transactional, and total call volume is fixed by customer base size.
Software engineers sit in the amplified group despite heavy coding automation, because organizations have effectively unlimited unmet demand for software and simply build more when it gets cheaper.
The divergent group deserves more attention than it gets. Insurance sales agents and IT support technicians fall here, and the effect is not uniform across the role.
Entry-level work gets automated while senior work expands, which hollows out the middle of a career ladder rather than the role itself.
43% of US jobs cross the 40% task automation threshold
About 43% of US jobs have at least 40% of their tasks classified as automatable with current AI capability. That threshold matters because it is the point where redesigning a role starts to make business sense.
The other 57% fall below it. These jobs depend on physical presence, hands-on work, or sustained human interaction, and no current AI capability touches any of the three.
Physicians and teachers are the clearest examples. AI can assist with documentation or preparation, but the core of the work stays human.
(Source: BCG)
How Much of Today’s Work Is Already Done by Machines
Humans currently perform 47% of all work tasks alone. By 2030, that falls to 33%, a drop of 14 percentage points or roughly 30% of the current human-only share.
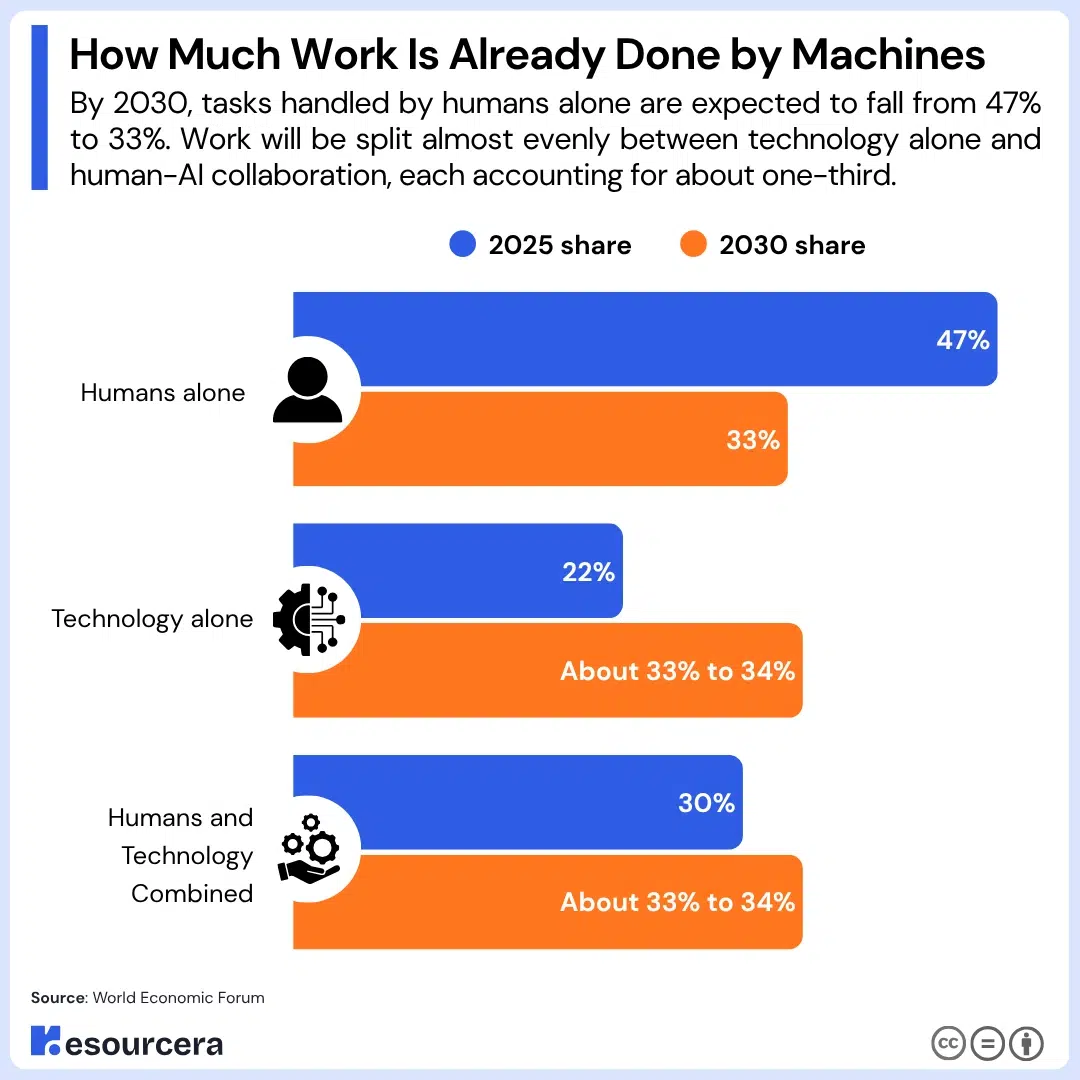
The share handled by technology alone, or by humans and machines together, rises from 52% to about 67% over the same period, an increase of 29%.
| Task delivery method | 2025 share | 2030 share |
| Humans alone | 47% | 33% |
| Technology alone | 22% | About 33% to 34% |
| Humans and technology combined | 30% | About 33% to 34% |
The direction of that shift matters more than its size. Of the 14-point reduction in human-only task share, 81.5% comes from straight automation and only 19% from expanded human-machine collaboration.
Automation, not augmentation, is doing most of the work, which is a meaningful correction to the “AI as copilot” framing that dominates vendor messaging.
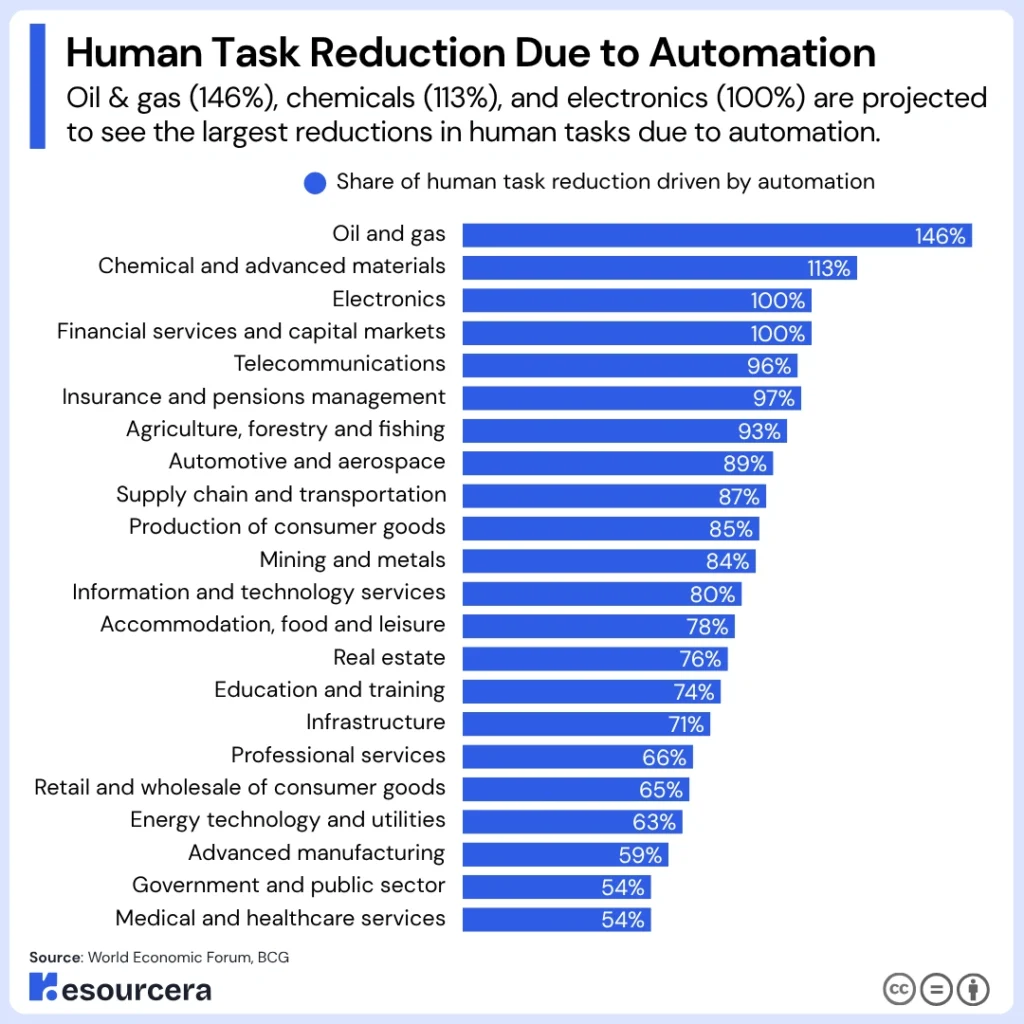
The balance varies sharply by industry.
| Industry | Share of human task reduction driven by automation |
|---|---|
| Oil and gas | 146% |
| Chemical and advanced materials | 113% |
| Electronics | 100% |
| Financial services and capital markets | 100% |
| Telecommunications | 96% |
| Insurance and pensions management | 97% |
| Agriculture, forestry and fishing | 93% |
| Automotive and aerospace | 89% |
| Supply chain and transportation | 87% |
| Production of consumer goods | 85% |
| Mining and metals | 84% |
| Information and technology services | 80% |
| Accommodation, food and leisure | 78% |
| Real estate | 76% |
| Education and training | 74% |
| Infrastructure | 71% |
| Professional services | 66% |
| Retail and wholesale of consumer goods | 65% |
| Energy technology and utilities | 63% |
| Advanced manufacturing | 59% |
| Government and public sector | 54% |
| Medical and healthcare services | 54% |
Figures above 100% mean automation is absorbing not only work humans do alone but also work currently split between humans and machines.
Oil and gas at 146% is the extreme case. Healthcare and the public sector sit at the other end, close to an even split between automation and collaboration.
These are proportions, not volumes. Both humans and machines may be producing far more total output in 2030, so a smaller human share of tasks does not automatically mean less human work.
(Source: World Economic Forum)
Jobs Most Likely to Be Replaced by AI
Clerical, secretarial, and routine information-processing roles dominate every decline forecast.
Postal service clerks, bank tellers, data entry clerks, cashiers, and administrative assistants sit at the top of the global list, and the same job family leads US occupational projections and UK employer expectations.
The convergence is what makes this finding solid. Three independent methods- employer surveys, government demand modelling, and business adoption plans- all name the same roles.
| Rank | Fastest-declining role, 2025 to 2030 | Primary decline driver |
|---|---|---|
| 1 | Postal service clerks | Broadening digital access |
| 2 | Bank tellers and related clerks | AI and information processing |
| 3 | Data entry clerks | AI and information processing |
| 4 | Cashiers and ticket clerks | Robotics and automation |
| 5 | Administrative assistants and executive secretaries | AI and information processing |
| 6 | Printing and related trades workers | Broadening digital access |
| 7 | Accounting, bookkeeping and payroll clerks | AI and information processing |
| 8 | Material-recording and stock-keeping clerks | Robotics and automation |
| 9 | Transportation attendants and conductors | Robotics and automation |
| 10 | Door-to-door sales workers and street vendors | Broadening digital access |
| 11 | Graphic designers | AI and information processing |
| 12 | Claims adjusters, examiners and investigators | AI and information processing |
| 13 | Legal officials | AI and information processing |
| 14 | Legal secretaries | AI and information processing |
| 15 | Telemarketers | AI and information processing |
Eleven of the fifteen fastest-declining roles are also among the fifteen largest declines in absolute job numbers, which means these are not small niche occupations disappearing. They are high-headcount roles shrinking.
Graphic designers and legal secretaries entering this list is the genuine surprise. Two years earlier, graphic design was classified as a moderately growing job and legal secretaries did not appear on the decline list at all.
Both are now falling, and both declines trace to AI and information processing rather than to any other trend. That is the clearest single indicator that generative AI has moved past routine clerical work into knowledge work.
US projections put hard numbers on the same pattern.
| Occupation | Employment change, 2023 to 2033 | Jobs removed | Annualized rate |
|---|---|---|---|
| Bank tellers | -15.0% | 51,400 | -1.61% |
| Cashiers | -11.0% | 353,100 | -1.16% |
| Insurance appraisers, auto damage | -9.2% | 1,000 | -0.96% |
| Claims adjusters, examiners and investigators | -4.4% | 15,200 | -0.45% |
| Credit analysts | -3.9% | 2,800 | -0.40% |
Those five occupations alone account for 423,500 US positions disappearing over the decade, and cashiers make up 83% of that total.
Customer service representatives are projected to decline 5.0% and medical transcriptionists 4.7% over the same period.
Set against the all-occupations baseline of +4.0% growth, every one of these roles is losing ground twice over, shrinking in absolute terms while the wider labor market expands.
Manufacturing shows what a completed automation wave looks like
Since 2000, automation has removed about 1.7 million US manufacturing jobs. That figure is useful as a benchmark rather than a forecast.
It took roughly 25 years and produced job losses smaller than the low end of current AI estimates for a five-year window. Whether AI moves faster is the single biggest variable in every projection in this report.
(Sources: World Economic Forum, US Bureau of Labor Statistics, Office for National Statistics, National University)
Jobs AI Is Not Replacing and the New Roles It Is Creating
Technology roles lead the fastest-growing list in percentage terms, while frontline and care economy roles lead in absolute job numbers.
Several of the most AI-exposed occupations in the economy are growing faster than the market as a whole.
Software developers are the clearest case. US employment in the role will grow 17.9% between 2023 and 2033, which is 4.47 times the all-occupations rate of 4.0%, despite AI having largely mastered code generation.
| Occupation | Employment, in 2023 | Projected 2033 | Change | Percent change |
|---|---|---|---|---|
| Software developers | 1,692,100 | 1,995,700 | +303,700 | +17.9% |
| Personal financial advisors | 321,000 | 375,900 | +55,000 | +17.1% |
| Computer occupations | 5,021,800 | 5,608,500 | +586,800 | +11.7% |
| Database architects | 61,400 | 68,000 | +6,600 | +10.8% |
| Financial and investment analysts | 347,400 | 380,500 | +33,100 | +9.5% |
| Electrical engineers | 189,100 | 206,300 | +17,200 | +9.1% |
| Electronics engineers, except computer | 98,700 | 107,600 | +8,900 | +9.1% |
| Database administrators | 80,500 | 87,100 | +6,600 | +8.2% |
| Aerospace engineering technologists | 11,000 | 11,900 | +900 | +7.9% |
| Computer hardware engineers | 84,100 | 90,200 | +6,100 | +7.2% |
| Business and financial operations | 10,977,200 | 11,738,500 | +761,300 | +6.9% |
| Architecture and engineering occupations | 2,639,700 | 2,819,700 | +180,000 | +6.8% |
| Civil engineers | 341,800 | 363,900 | +22,100 | +6.5% |
| Aerospace engineers | 68,900 | 73,000 | +4,100 | +6.0% |
| Lawyers | 859,000 | 903,300 | +44,200 | +5.2% |
| Budget analysts | 50,800 | 52,700 | +2,000 | +3.9% |
| Legal occupations | 1,394,400 | 1,446,200 | +51,800 | +3.7% |
| Electrical and electronic engineering technologists | 99,600 | 102,600 | +3,000 | +3.0% |
| Paralegals and legal assistants | 366,200 | 370,500 | +4,300 | +1.2% |
| Total, all occupations | 167,849,800 | 174,589,000 | +6,739,200 | +4.0% |
Nineteen of the 22 occupations flagged as AI-exposed in US projections are growing, and fifteen are growing faster than the market.
That is a substantial counterweight to the displacement headlines, and it is drawn from the same official dataset that projects bank tellers and cashiers to shed 400,000 jobs.
The split inside the legal profession is instructive. Lawyers grow 5.2% while paralegals and legal assistants grow just 1.2%, roughly a quarter of the baseline rate.
AI absorbs document review and research, which is paralegal work, while judgment and advocacy remain with lawyers. The same pattern separates database architects at 10.8% from the clerical roles beneath them.
Farmworkers top the volume list with 35 million additional jobs by 2030, driven by climate and food system pressure rather than technology.
The wider point is that percentage growth and job volume measure different things. Technology roles grow fast from small bases. Frontline and care roles grow slowly from enormous ones, and they employ far more people.
Occupations at the lowest risk of AI displacement include air traffic controllers, chief executives, radiologists, pharmacists, residential advisors, photographers, and members of the clergy.
The list has no clean pattern by education or salary, which undercuts the assumption that AI risk tracks with pay.
AI adoption is also creating job categories outright. Forward-deployed engineers, systems integrators, and implementation project managers sit between AI capability and business operations, adapting workflows and connecting legacy systems.
Supply in these roles trails demand, which makes implementation capacity a genuine brake on how fast AI can displace anything.
(Sources: US Bureau of Labor Statistics, World Economic Forum, Goldman Sachs, BCG)
Which Trends Create and Destroy the Most Jobs
AI and information processing technologies are a net job creator through 2030, adding 11 million jobs while displacing 9 million.
Robots and autonomous systems are the single largest net job destroyer, with a net decline of 4.8 million.
That distinction gets lost constantly. Not all automation is AI, and not all AI-driven change is job loss. Separating the trends shows where the pressure actually sits.
| Trend | Net job effect by 2030 |
|---|---|
| Broadening digital access | +9.9 million |
| Growing working-age populations | +9.1 million |
| Investment in climate change adaptation | +5.5 million |
| Increased focus on labour and social issues | +5.2 million |
| Ageing and declining working-age populations | +3.8 million |
| Investment in carbon emission reduction | +3.1 million |
| Government subsidies and industrial policy | +2.8 million |
| AI and information processing technologies | +1.8 million |
| Restrictions to global trade and investment | +1.3 million |
| Energy generation, storage and distribution | +1.0 million |
| Geopolitical division and conflicts | +0.9 million |
| New materials and composites | +0.9 million |
| Rising cost of living and inflation | +0.8 million |
| Stricter anti-trust and competition regulation | +0.7 million |
| Semiconductors and computing technologies | +0.6 million |
| Quantum and encryption | +0.3 million |
| Biotechnology and gene technologies | +0.2 million |
| Sensing, laser and optical technologies | +0.1 million |
| Satellites and space technologies | +0.1 million |
| Slower economic growth | -1.6 million |
| Robots and autonomous systems | -4.8 million |
Only two of 21 trends are net negative, and one of them is economic slowdown rather than technology.
AI’s gross displacement of 9 million jobs is real and is the second-largest displacement figure of any technology trend.
It comes paired with 11 million jobs created, which is why the net lands positive. Robotics has no comparable creation effect, which is why it lands negative. The public conversation has these two almost exactly backwards.
(Source: World Economic Forum)
AI Job Replacement in the United States
The US sits furthest along the AI adoption curve, which makes its labor data the closest available leading indicator for everywhere else. That data shows targeted disruption in specific occupations and age groups rather than broad collapse.
Aggregate US employment has not moved in response to AI exposure. Specific sectors and specific worker groups clearly have.
10% to 15% of US jobs are vulnerable over the next five years
Against the 165 million US employment base, that range covers 16.5 million to 24.8 million positions. The productivity-based method lands at 9.9 million to 11.6 million. Both are large. Neither has arrived.
AI exposure has not yet moved US aggregate employment
There is no statistically significant correlation between AI exposure and job growth, unemployment rates, job finding rates, layoff rates, weekly hours, or hourly earnings growth.
The explanation is adoption. Only 9.3% of US companies reported using generative AI in production in a recent two-week window.
Contact center tools are among the most mature AI applications available, and penetration there remains limited relative to industry size.
The lag between capability and labor market impact is structural rather than a measurement gap. Economic impact depends on workflow redesign, legacy system integration, and the availability of people who can deploy these systems, and none of those scale as fast as a model release.
Recent graduate unemployment has risen to 5.6%
This is the clearest signal in current US data. Entry-level workers are absorbing the disruption first.
| Group | Unemployment rate | Multiple of economy-wide rate |
|---|---|---|
| Younger recent graduates | 7.0% | 1.75x |
| Recent college graduates | 5.6% | 1.40x |
| Economy-wide | 4.0% | 1.00x |
| Experienced graduates | 3.0% | 0.75x |
On top of that, 42.5% of younger graduates are underemployed, holding jobs that do not require a degree.
Unemployment among 20- to 30-year-olds in tech-exposed occupations has risen by almost 3 percentage points since the start of 2025, worse than for same-aged workers in other fields and worse than for tech workers overall.
The mechanism is straightforward. AI absorbs the structured, repeatable work that has historically justified large entry-level hiring cohorts.
When that work goes, the junior roles built around it go with it. The senior roles that survive require judgment and context that people normally build by doing exactly those junior jobs, which is a supply problem that will surface in five to ten years rather than now.
Tech employment has fallen below its pre-pandemic trend
Employment growth in computer systems design, software publishing, and web search portals has slowed sharply. Tech employment as a share of overall US employment has fallen steadily since November 2022 and now sits below a trend line that had been remarkably linear for years.
Part of that is a correction after pandemic-era over-hiring. But the share has now dropped below the pre-pandemic trend itself, which points past a hiring correction.
Employment growth has also fallen below trend in marketing consulting, graphic design, office administration, and telephone call centers, while finance, consulting, management, and corporate support have stalled after decades of steady growth.
Blue-collar employment has outpaced white-collar by roughly one million jobs
For decades, US job growth was led by white-collar work. Over the past three years, that reversed.
Blue-collar employment has added roughly one million more jobs than white-collar roles, with manual work rising modestly while office-based employment edges down.
The gains concentrate in construction and maintenance, both with limited exposure to current AI capability. If sustained, this marks a real shift in how opportunity is distributed across the US economy.
AI-attributed layoffs remain a small share of total US job cuts
US employers announced roughly 1.17 million job cuts in 2025, the highest annual total since 2020. AI was explicitly cited in 54,836 of them, or 4.7% of the total.
| Period | AI-cited job cuts | Share of that year’s announced cuts |
|---|---|---|
| 2023 and 2024 combined | 16,989 | Under 1% |
| 2025 | 54,836 | 4.7% |
| Cumulative since 2023 | 71,825 | Not applicable |
AI-cited cuts in 2025 alone ran 3.23 times the combined total of the two prior years. Put differently, 76% of every AI-attributed job cut on record happened in a single year.
Sector-level cuts tell a sharper story than the AI attribution does.
| Sector | Announced cuts, 2024 | Announced cuts, 2025 | Change |
|---|---|---|---|
| Technology | 133,988 | 154,445 | +15.3% |
| Warehousing | 22,874 | 95,317 | +316.7% |
| Retail | 41,686 | 92,989 | +123.1% |
| Telecommunications | 10,331 | 38,035 | +268.2% |
Warehousing quadrupling is an automation story rather than an AI story, and it is a reminder that robotics is doing more measurable damage to headcount than language models are.
Announced hiring plans across the US fell to 507,647 in 2025, down 34.1% from 769,953 in 2024, the lowest total since 2010.
That slowdown in hiring is a larger effect than the layoffs, and it shows up in no AI displacement statistic anywhere.
One caution applies to all attribution figures. They record the reason companies give publicly. Restructurings that would have happened regardless are increasingly labelled AI, which inflates the count, while quiet hiring freezes attributed to nothing at all deflate it.
(Sources: BCG, Goldman Sachs, The Conversation, Challenger, Gray & Christmas)
AI Job Exposure Around the World
AI will affect nearly 60% of jobs in advanced economies but only about 26% in low-income countries. That gap of more than two to one means the technology hits the wealthiest labor markets hardest, reversing the usual pattern for disruptive technology.
The reason is composition. Advanced economies hold a far higher share of white-collar, information-processing work, and that is precisely the category current AI handles best.
| Economy group | Share of jobs exposed to AI | Share of core skills changing by 2030 |
|---|---|---|
| Advanced economies | About 60% | 33% to 37% |
| Global average | About 40% | 39% |
| Low-income economies | About 26% | 44% to 48% |
Exposure and disruption are not the same thing. Wealthier economies also have more capacity to absorb the shock through reskilling budgets, social protection, and job mobility, which is why the two columns above move in opposite directions.
Egypt and Zimbabwe sit at the top of the skill disruption list at 48%, while Denmark and the Netherlands sit at the bottom around 28% to 30%. The US sits at 35%, below the 39% global average.
The UK gives the clearest national picture outside the US, because its business surveys measure adoption directly rather than modelling forecasts. Nearly a quarter of UK businesses, 23%, were using some form of AI in late September 2025. Of those, only 4% reported that overall workforce headcount had decreased as a result.
That 4% figure deserves weight. Among businesses that have actually adopted AI, fewer than one in twenty report headcount falling because of it.
(Sources: World Economic Forum, National University, Office for National Statistics, Tenet)
How Many Companies Are Actually Replacing Workers With AI
Employers choose retraining over replacement by roughly three to one. Among UK businesses currently using AI, 33% are training or retraining existing staff to work with it, while 10% are automating or replacing roles outright.
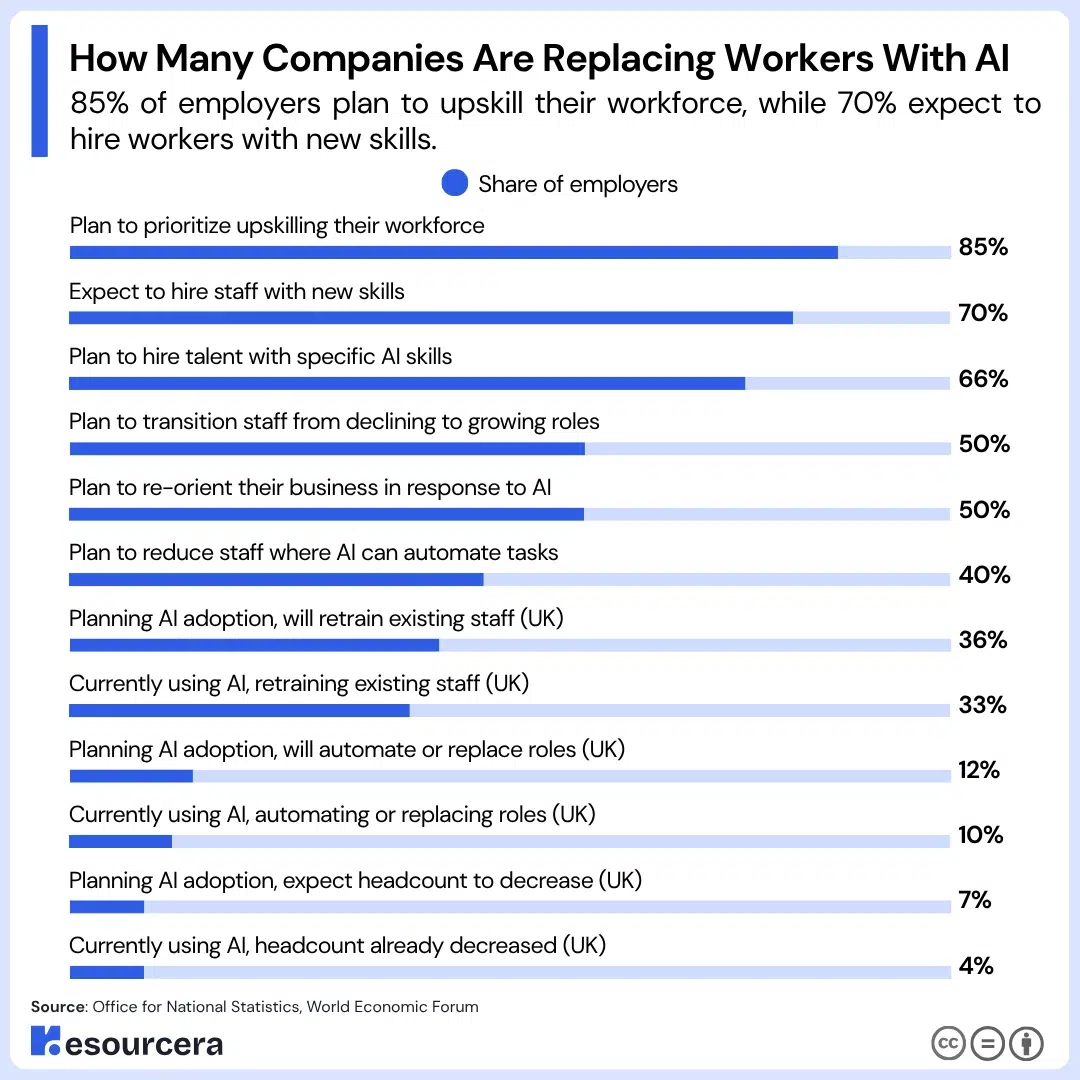
That ratio holds among businesses yet to adopt. Of those planning AI adoption within three months, 36% intend to retrain existing staff and 12% intend to replace roles, a 3.0 to 1 margin.
| Employer action | Share of employers |
|---|---|
| Plan to prioritize upskilling their workforce | 85% |
| Expect to hire staff with new skills | 70% |
| Plan to hire talent with specific AI skills | 66% |
| Plan to transition staff from declining to growing roles | 50% |
| Plan to re-orient their business in response to AI | 50% |
| Plan to reduce staff where AI can automate tasks | 40% |
| Planning AI adoption, will retrain existing staff (UK) | 36% |
| Currently using AI, retraining existing staff (UK) | 33% |
| Planning AI adoption, will automate or replace roles (UK) | 12% |
| Currently using AI, automating or replacing roles (UK) | 10% |
| Planning AI adoption, expect headcount to decrease (UK) | 7% |
| Currently using AI, headcount already decreased (UK) | 4% |
The pattern is consistent. Intentions to upskill run more than twice as high as intentions to cut, and reported headcount reductions run far below both.
Stated intent also runs consistently ahead of realized action, with 40% planning to cut where AI automates and 4% reporting it has happened.
Adoption is still too low to move national employment figures
UK business AI adoption climbed from 9% in September 2023 to 23% in late September 2025, a gain of 14 percentage points or 2.56 times in two years. That is roughly 60% growth per year.
Fast growth, but more than three-quarters of UK businesses were still not using AI in any form as of late 2025, and in the US the production-use figure sits at 9.3% of companies.
Firm size matters. Among UK businesses planning AI adoption, 7% expected headcount to fall as a result, rising to 11% for businesses with 10 or more employees. Larger organizations move faster because they have the resourcing, systems, and data access that deployment requires.
(Sources: Office for National Statistics, World Economic Forum, Goldman Sachs)
AI Job Replacement by Gender, Age, and Education
Displacement risk is not spread evenly. In the United States, 79% of employed women work in jobs at high risk of automation compared to 58% of men, a gap of 21 percentage points.
The gap widens on stricter measures of severe disruption, and it widens most in the wealthiest economies.
| Measure | Women | Men | Risk ratio |
|---|---|---|---|
| US jobs at high risk of automation | 79% | 58% | 1.36x |
| Global jobs facing severe disruption potential | 4.7% | 2.4% | 1.96x |
| High-income economy jobs at highest risk | 9.6% | 3.2% | 3.00x |
The driver is occupational concentration. Women are heavily represented in clerical, administrative, and customer service work, which is exactly the category leading every decline list. Men are more represented in physical and skilled trade roles, which automate far more slowly.
A second factor compounds it. Women are underrepresented in AI and STEM fields, which limits access to the new high-paying roles AI creates. High exposure on one side and restricted access on the other is a difficult combination to reverse.
Age shows a similar imbalance. Workers aged 18 to 24 are 129% more likely than those over 65 to worry that AI will make their job obsolete, and the entry-level data suggests that concern is well founded.
Education produces the most counterintuitive result in this report. Exposure rises with education rather than falling with it.
| Education level | Share in highly exposed jobs | Multiple of lowest group |
|---|---|---|
| Bachelor’s degree | 27% | 9.0x |
| Some college | 19% | 6.3x |
| High school only | 12% | 4.0x |
| No high school diploma | 3% | 1.0x |
Workers with a bachelor’s degree are nine times more likely to hold a highly exposed job than workers without a high school diploma. Current AI is far better at analysis, drafting, and summarizing than at plumbing, and the numbers reflect that directly. Every previous automation wave ran the other way.
(Sources: National University, Tenet)
What Workers Think About AI Replacing Their Jobs
About a third of employed adults, 32%, think AI could put their job at risk, and 23% think it could reduce their income. Those numbers run well ahead of measured displacement, which is normal during a technology transition.
What is not normal is how accurately worker sentiment tracks actual exposure. The groups most worried are the groups the data identifies as most at risk.
| Occupation group | Think AI could put their job at risk | Think AI could make their job easier |
|---|---|---|
| Administrative and secretarial | 43% | Below average |
| Sales and customer service | 41% | Below average |
| Associate professional | 36% | 34% |
| Professional | 33% | 41% |
| Managers, directors and senior officials | Not reported | 34% |
| Skilled trades | 20% | Below average |
| Caring, leisure and other services | 18% | Below average |
The 25-point spread between administrative workers at 43% and caring or service workers at 18% mirrors the actual exposure gap almost exactly. Workers are reading their own risk correctly, which is worth remembering when survey anxiety gets dismissed as panic.
Professional and managerial workers show the opposite pattern. They are more likely than any other group to expect AI will make their job easier, at 41% and 34%. That fits the augmentation picture, where senior judgment-heavy roles gain capability rather than lose headcount.
On the upside, 28% of employed adults think AI could make their job easier, 11% think it could cut their hours without cutting pay, 8% think it could improve their job prospects, and 7% think it could raise their income.
(Source: Office for National Statistics)
The Skills Shift Behind AI Job Displacement
39% of workers’ core skills will change by 2030. That is significant, but it is down from 44% in 2023 and well below the 57% peak recorded in 2020, a fall of 18 percentage points or roughly 32%.
Skill instability easing while AI capability accelerates looks contradictory until you look at training volume. The share of the workforce that has completed reskilling or upskilling rose from 41% in 2023 to 50% in 2025.
Companies are getting better at anticipating what they will need, and the falling number is a measure of preparedness rather than of slowing change.
| Survey year | Core skills expected to change within five years |
|---|---|
| 2016 | 35% |
| 2018 | 42% |
| 2020 | 57% |
| 2023 | 44% |
| 2025 | 39% |
The retraining requirement is still enormous. If the global workforce were 100 people, 59 would need training by 2030.
Of those, 29 could be upskilled within their current roles, and 19 could be upskilled and moved elsewhere in their organization. The remaining 11 would likely receive nothing, leaving their employment prospects at risk.
That last group is the real displacement number in this report. Not the 92 million jobs projected to disappear, but the 11 workers in every 100 who will not get the training to move into whatever replaces them.
Skill gaps are already the top constraint on business transformation, named by 63% of employers as a major barrier through 2030.
The fastest-rising skills are AI and big data, networks and cybersecurity, and technological literacy, in that order. Creative thinking, resilience, curiosity, and lifelong learning follow immediately behind, which is a useful correction to the assumption that the answer to AI is purely technical.
Only two skill categories are in net decline, and manual dexterity, endurance, and precision are the sharpest, with 24% of employers expecting their importance to fall.
Resilience, flexibility, and agility is the single biggest skill differentiator between growing and declining jobs, ahead of programming and technological literacy. Service orientation and customer service are the only skill measured that matters no more in growing roles than in declining ones.
(Source: World Economic Forum)
Will AI Create More Jobs Than It Replaces?
Yes, on the numbers. 170 million jobs created against 92 million displaced by 2030 leaves a net gain of 78 million positions and a creation-to-displacement ratio of 1.85 to 1.
About 60% of US workers today hold jobs in occupations that did not exist in 1940, which implies more than 85% of employment growth since then came from technology-created roles. Predictions that technology would permanently reduce the need for human labor have a long record and a poor one.
Labor-saving technology historically raises the US jobless rate by 0.3 percentage points for every 1-point gain in technology-driven productivity growth.
Generative AI will lift US labor productivity by around 15% once fully adopted, which translates to roughly a half-point rise in unemployment above trend during the transition. That effect typically disappears after about two years.
(Sources: World Economic Forum, Goldman Sachs, The Conversation)
Final Thoughts
Reshaping is confirmed. Replacement is coming but has not arrived.
More than half of US jobs sit below the automation threshold where redesign makes business sense, and no current AI capability moves them.
At the same time, the human share of work tasks drops from 47% to 33% by 2030, with 81.5% of that shift coming from automation rather than collaboration. Most jobs survive, and most surviving jobs change substantially.
Expect displacement to keep running well below the headline projections through 2028, because integration capacity, not model capability, is the binding constraint.
Expect entry-level roles to absorb most of what does happen. And expect AI-attributed layoffs to climb past 2025’s 4.7% share, partly because AI is genuinely responsible and partly because it is a convenient reason to name.
The number that decides the outcome is 11 in 100. That is the share of workers needing retraining who will not get it.

