Peacock is the youngest of the major American streaming services, and it has just had the biggest quarter of its life. In the first quarter of 2026, Peacock crossed $2 billion in revenue for the first time ever and grew its subscriber base to 46 million.
The quarter was powered by two of the largest live events on the American calendar, the Milan Cortina Winter Olympics and the NFL’s Super Bowl, both of which streamed on Peacock.
This post covers the state of Peacock in 2026, we include data on Peacock’s subscribers, revenue, viewing share, content library, and advertising.
Highlights From Peacock Statistics 2026
- Peacock has 46 million subscribers as of Q1 2026, a 12% year-over-year increase.
- Peacock crossed $2 billion in quarterly revenue for the first time in its history, growing 71% year over year.
- Peacock now accounts for 1.7% of all TV screen time in the United States, up from 1.4%.
- Peacock accounts for at least 27% of NBCUniversal’s entire Media segment revenue.
- The Milan Cortina Olympics and the Super Bowl added $2.2 billion of incremental revenue to NBCUniversal’s Media segment in a single quarter.
- Streaming as a whole now takes 47.6% of US TV viewing, more than cable and broadcast combined.
- Peacock launched in 2020 with 15,000 hours of content. It now carries more than 80,000 hours.
Peacock Subscribers 2026
Peacock has spent six years building its subscriber base, and 2026 is the year the growth curve turned back up after a flat 2025.
Peacock Has 46 Million Subscribers As Of Q1 2026
Peacock paid subscribers increased 12% year over year to 46 million in the first quarter of 2026. That is 5 million more subscribers than the 41 million Peacock reported a year earlier, and it is the largest subscriber base in the platform’s history.
Peacock remains a United States service, available only in the US and certain US territories. Every one of those 46 million subscribers is domestic, which makes the number more impressive than a straight comparison with global platforms suggests.
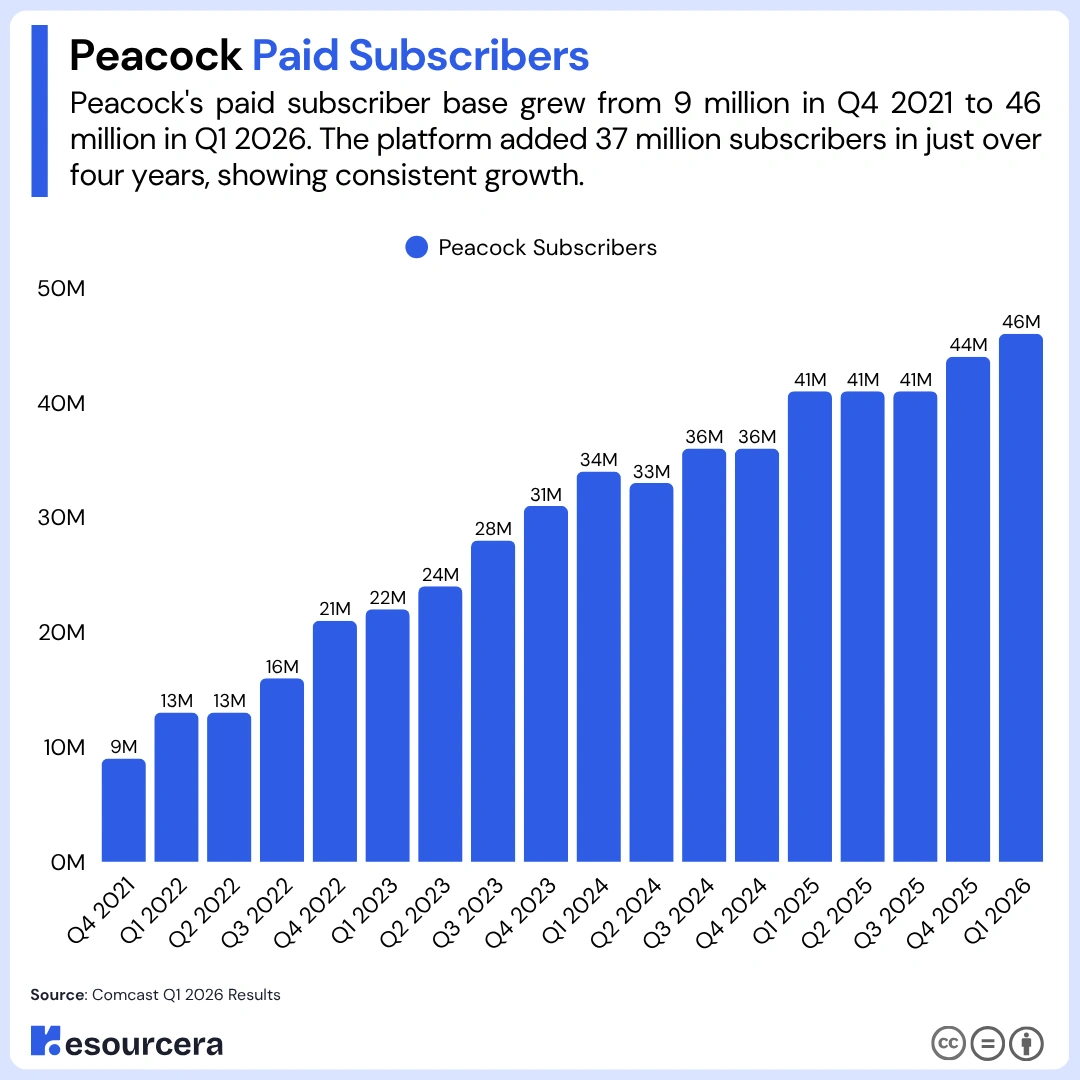
Here is a table showing Peacock’s paid subscriber count by quarter:
| Quarter | Peacock Subscribers |
|---|---|
| Q2 2021 | 4 million |
| Q3 2021 | N/A |
| Q4 2021 | 9 million |
| Q1 2022 | 13 million |
| Q2 2022 | 13 million |
| Q3 2022 | 16 million |
| Q4 2022 | 21 million |
| Q1 2023 | 22 million |
| Q2 2023 | 24 million |
| Q3 2023 | 28 million |
| Q4 2023 | 31 million |
| Q1 2024 | 34 million |
| Q2 2024 | 33 million |
| Q3 2024 | 36 million |
| Q4 2024 | 36 million |
| Q1 2025 | 41 million |
| Q2 2025 | 41 million |
| Q3 2025 | 41 million |
| Q4 2025 | 44 million |
| Q1 2026 | 46 million |
Source: Comcast Q1 2026 Results
Peacock Added 5 Million Subscribers In Twelve Months
Peacock went from 41 million subscribers in Q1 2025 to 46 million in Q1 2026. The platform added 5 million net subscribers over the past year, marking a strong turnaround after a largely flat 2025. Subscriber numbers stayed unchanged at 41 million from Q1 to Q3 2025 before returning to growth.
Source: Comcast Q1 2026 Results
Peacock Has Grown Its Subscriber Base 11.5 Times Since 2021
Peacock reported 4 million paid subscribers in Q2 2021. Five years later, that figure had grown to 46 million, equal to approximately 1.1% of global OTT subscribers. That is an 11.5-fold increase.
For context, no other major American streaming service has added subscribers that quickly from a standing start while operating in a single country.
77% Of Peacock Subscribers Choose The Ad-Supported Plan
The majority of Peacock sign-ups are ad-supported, at 77%. This makes Peacock the leading American streaming service by share of ad-supported users. Hulu is second at 55%.
This split is the reason Peacock’s advertising business matters as much as its subscription business. Most of the people on the platform are watching ads.
Here is a table showing the share of subscribers on leading streaming platforms by plan type:
| Platform | Ad-Supported Plan Subscribers | Ad-Free Plan Subscribers |
|---|---|---|
| Peacock | 77% | 23% |
| Hulu | 55% | 45% |
| Discovery+ | 45% | 55% |
| Paramount+ | 37% | 63% |
| Max | 19% | 81% |
| Disney+ | 19% | 81% |
| Netflix | 7% | 93% |
Source: Statista, OTT Statistics
Peacock Revenue And Financial Statistics 2026
Q1 2026 was the quarter Peacock stopped being a side project and started carrying a meaningful share of NBCUniversal’s revenue.
Peacock Crossed $2 Billion In Quarterly Revenue For The First Time
Comcast confirmed that Peacock revenue grew 71% year over year in Q1 2026, crossing $2 billion in a single quarter for the first time ever.
If we take a look back, Peacock registered revenue of $5.2 billion for the complete year 2025 and $4.9 billion in 2024.
Peacock has consistently surpassed its yearly revenue figures since 2020.
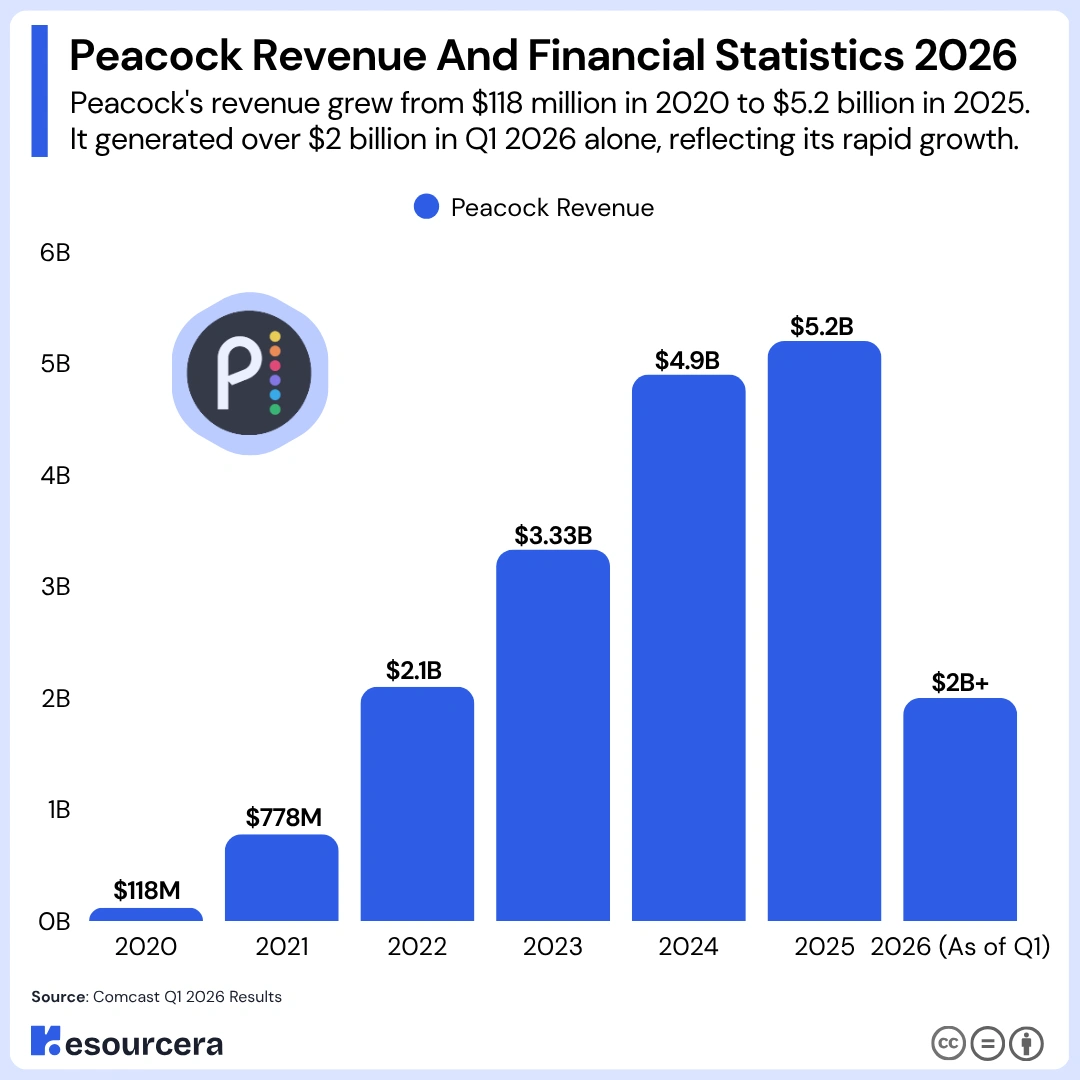
Here is a table showing Peacock’s revenue over the years:
| Period | Peacock Revenue |
|---|---|
| 2020 | $118 million |
| 2021 | $778 million |
| 2022 | $2.1 billion |
| 2023 | $3.33 billion |
| 2024 | $4.9 billion |
| 2025 | $5.2 billion |
| 2026 (As of Q1) | $2 billion+ |
Source: Comcast Q1 2026 Results.
Peacock Generates More Than A Quarter Of NBCUniversal’s Media Revenue
NBCUniversal’s Media segment brought in $7.28 billion in Q1 2026. Peacock contributed more than $2 billion of that.
That works out to at least 27.5% of the entire Media segment. Six years ago Peacock did not exist. Today it is more than a quarter of the revenue of the division that houses NBC, Bravo, Telemundo, and NBC Sports.
Source: Comcast Q1 2026 Results
Peacock Generates Around $43 Per Subscriber Per Quarter
Dividing Peacock’s quarterly revenue by its subscriber count gives a rough revenue-per-subscriber figure.
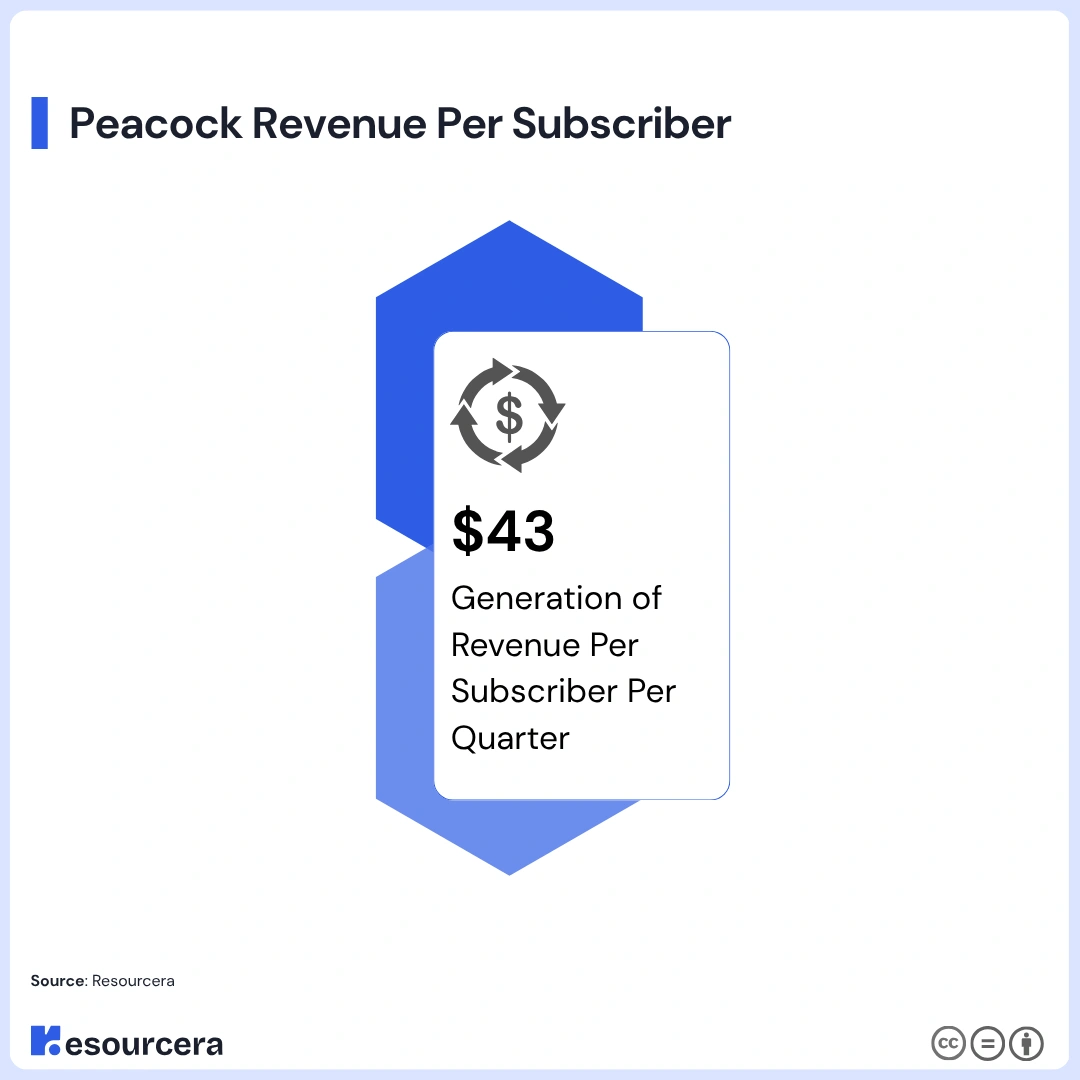
That comes to roughly $43 per subscriber for the quarter, or about $14.50 per month. Two caveats apply. This number includes advertising revenue, not just subscription fees, so it is not the same as subscription ARPU. And Q1 2026 was inflated by Olympics and Super Bowl advertising, so this is a peak, not a run rate.
Source: Calculted by resourcera from Comcast Q1 2026 Results
NBCUniversal’s Media Segment Posted A $426 Million Adjusted EBITDA Loss In Q1 2026
The Media segment recorded an adjusted EBITDA loss of $426 million in the quarter. Comcast attributed the decline primarily to programming costs for the Olympics and the Super Bowl, plus the impact of NBA rights.
It is worth being precise here. This is the loss for the whole Media segment, not for Peacock alone. Comcast did not break out a separate Peacock EBITDA figure in its Q1 2026 presentation.
Source: Comcast Q1 2026 Results
The Olympics And Super Bowl Effect On Peacock
Q1 2026 is the clearest example yet of how Peacock’s business actually works. Live events bring in enormous revenue and enormous costs in the same quarter.
The Milan Cortina Olympics and Super Bowl Added $2.2 Billion Of Incremental Revenue
The Milan Cortina Olympics and the NFL’s Super Bowl contributed $2.2 billion of incremental revenue to the Comcast Media segment in Q1 2026.
To put that in scale, that single line item is larger than Peacock’s entire revenue for the quarter. Two events, three weeks of programming between them, $2.2 billion.
Source: Comcast Q1 2026 Results
Media Revenue Grew 13% Even Without The Olympics And Super Bowl
Even without the events, NBCUniversal’s Media revenue still grew 13% year over year. With the events included, Media revenue grew 60.8% to $7.28 billion.
The 13% number is the one that matters for judging Peacock’s underlying health, because it shows the business is growing without needing a Winter Olympics every quarter.
Source: Comcast Q1 2026 Results
Distribution Revenue Grew 21% Excluding The Olympics, Driven By Peacock
Comcast named Peacock as the driver of a 21% increase in distribution revenue, excluding the Olympics. Distribution revenue is the money NBCUniversal makes from people paying to receive its content, which for Peacock means subscription fees.
This is the cleanest signal in the entire report that Peacock’s paid growth is real rather than an accounting artefact of the Olympics.
Source: Comcast Q1 2026 Results
Advertising Revenue Grew 5% Excluding Events, Driven By Sports Including The NBA
Excluding the Olympics and the Super Bowl, NBCUniversal advertising revenue still grew 5% year over year. Comcast credited sports, specifically calling out the NBA.
The NBA appears twice in the same earnings deck, once as a driver of advertising revenue and once as a driver of cost. That tension is the story of Peacock in 2026.
Source: Comcast Q1 2026 Results
The Events That Drove The Growth Also Drove The Losses
Media segment revenue grew 60.8% in Q1 2026. Media segment adjusted EBITDA went to a $426 million loss.
Both facts have the same cause. Rights and programming costs for the Olympics, the Super Bowl, and the NBA all land in the same quarter as the revenue they generate, and in Q1 2026 the costs won. This is the trade Comcast has chosen to make: buy the events that bring people to Peacock, and absorb the margin damage while the subscriber base compounds.
Source: Comcast Q1 2026 Results
Peacock After The Versant Separation
The biggest structural change in Peacock’s history happened quietly on the second day of 2026.
Comcast Completed The Versant Separation On 2 January 2026
Comcast spun off Versant Media Group into an independent, publicly traded company, completing the separation on 2 January 2026. Versant took a set of NBCUniversal’s cable networks with it.
Every Comcast revenue and EBITDA figure for Q1 2026 is now presented on a pro forma basis to reflect this, as if the separation had happened on 1 January 2024. This is why year-over-year comparisons from before 2026 need care.
Source: Comcast Q1 2026 Results
Peacock Is Now A Larger Share Of A Smaller Media Segment
Comcast rebuilt its segment reporting in Q1 2026. The Media segment now excludes Versant’s historical results, and the regional sports networks were moved out of Media into Corporate and other.
The practical effect is that Peacock’s share of the Media segment is now measured against a leaner base. When Peacock accounts for more than 27% of Media revenue in 2026, that is a share of a division deliberately reorganised around streaming, broadcast, and sports.
Source: Comcast Q1 2026 Results
The Office And Peacock’s Content Economics
One show moved an entire NBCUniversal segment in Q1 2026, and it did so by being renewed on Peacock.
The Office Renewal On Peacock Helped Double Studios Adjusted EBITDA
NBCUniversal’s Studios segment grew revenue 21.2% to $3.43 billion and grew adjusted EBITDA 102.4% to $555 million in Q1 2026. Comcast attributed that growth to higher content licensing revenue and named the renewal of The Office on Peacock as the driver.
Source: Comcast Q1 2026 Results
Peacock Pays NBCUniversal’s Own Studios For Its Biggest Show
The Office is produced by Universal Television, an NBCUniversal studio. Peacock is an NBCUniversal service. When Peacock renews the rights to The Office, the payment moves from one part of the company to another and shows up as revenue in Studios.
This is a normal part of how vertically integrated media companies work, but it explains something readers often find confusing: a single library sitcom can visibly move a multi-billion-dollar segment’s profit line because the internal licensing deal is worth that much.
Source: Comcast Q1 2026 Results
Peacock’s Share Of US TV Viewing
Nielsen’s The Gauge measures what Americans actually watch, across every platform. It is the most reliable read on Peacock’s real-world footprint.
Peacock Accounts For 1.7% Of All US TV Screen Time
As of April 2026, Peacock takes 1.7% of total TV screen time in the United States. That places it 8th among all streaming platforms measured, behind Paramount+ and ahead of Warner Bros. Discovery.
YouTube leads all of television with 13.4%, followed by Netflix at 7.8%.
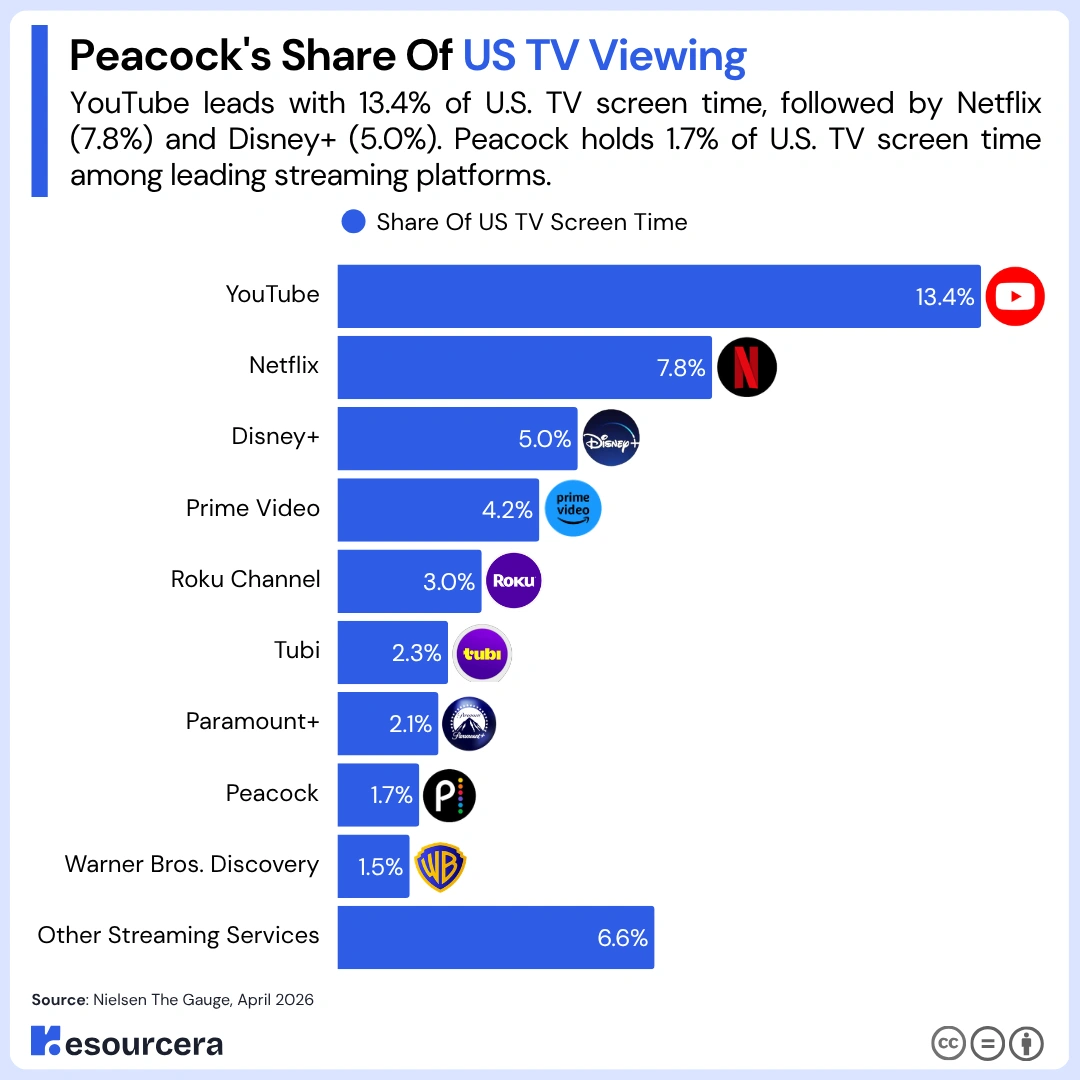
Here is a table showing the share of US TV screen time by streaming platform:
| Streaming Platform | Share Of US TV Screen Time |
|---|---|
| YouTube | 13.4% |
| Netflix | 7.8% |
| Disney+ | 5.0% |
| Prime Video | 4.2% |
| Roku Channel | 3.0% |
| Tubi | 2.3% |
| Paramount+ | 2.1% |
| Peacock | 1.7% |
| Warner Bros. Discovery | 1.5% |
| Other Streaming Services | 6.6% |
Source: Nielsen The Gauge, April 2026
Peacock’s Screen Time Share Grew From 1.4% To 1.7%
Peacock had been stuck at 1.4% of US TV screen time for several reporting periods. As of April 2026 it is at 1.7%.
That is a 21.4% relative increase in Peacock’s share of American television. In a measurement where a tenth of a percentage point is meaningful, three tenths is a genuine shift.
Source: Nielsen.
Peacock Holds 3.6% Of All Streaming Time In The US
Streaming as a category accounts for 47.6% of US TV viewing. Peacock’s 1.7% is a slice of that.
Peacock therefore takes about 3.6% of all time Americans spend streaming.
Source: Nielsen.
Streaming Now Beats Cable And Broadcast Combined
Streaming took 47.6% of US TV viewing in April 2026. Cable took 21.6% and broadcast took 19.9%, which is 41.5% between them.
Streaming is now 6.1 percentage points ahead of cable and broadcast added together. This is the environment Peacock is growing into, and it is why Comcast is willing to lose money on Media EBITDA to buy streaming share.
Here is a table showing how Americans watched television in April 2026:
| Viewing Type | Share Of US TV Viewing |
|---|---|
| Streaming | 47.6% |
| Cable | 21.6% |
| Broadcast | 19.9% |
| Other | 11.0% |
Source: Nielsen.
Peacock’s Content Library: 2020 Versus 2026
Peacock’s catalogue is one of the clearest measures of how much the service has changed. The comparison below uses Peacock’s own content addendum from its January 2020 launch against its current published figures.
Peacock Launched With 15,000 Hours Of Content And Now Has More Than 80,000
At launch in January 2020, Peacock’s own content addendum described a library of 15,000+ hours across its Premium tier. Peacock now advertises more than 80,000 hours of on-demand content.
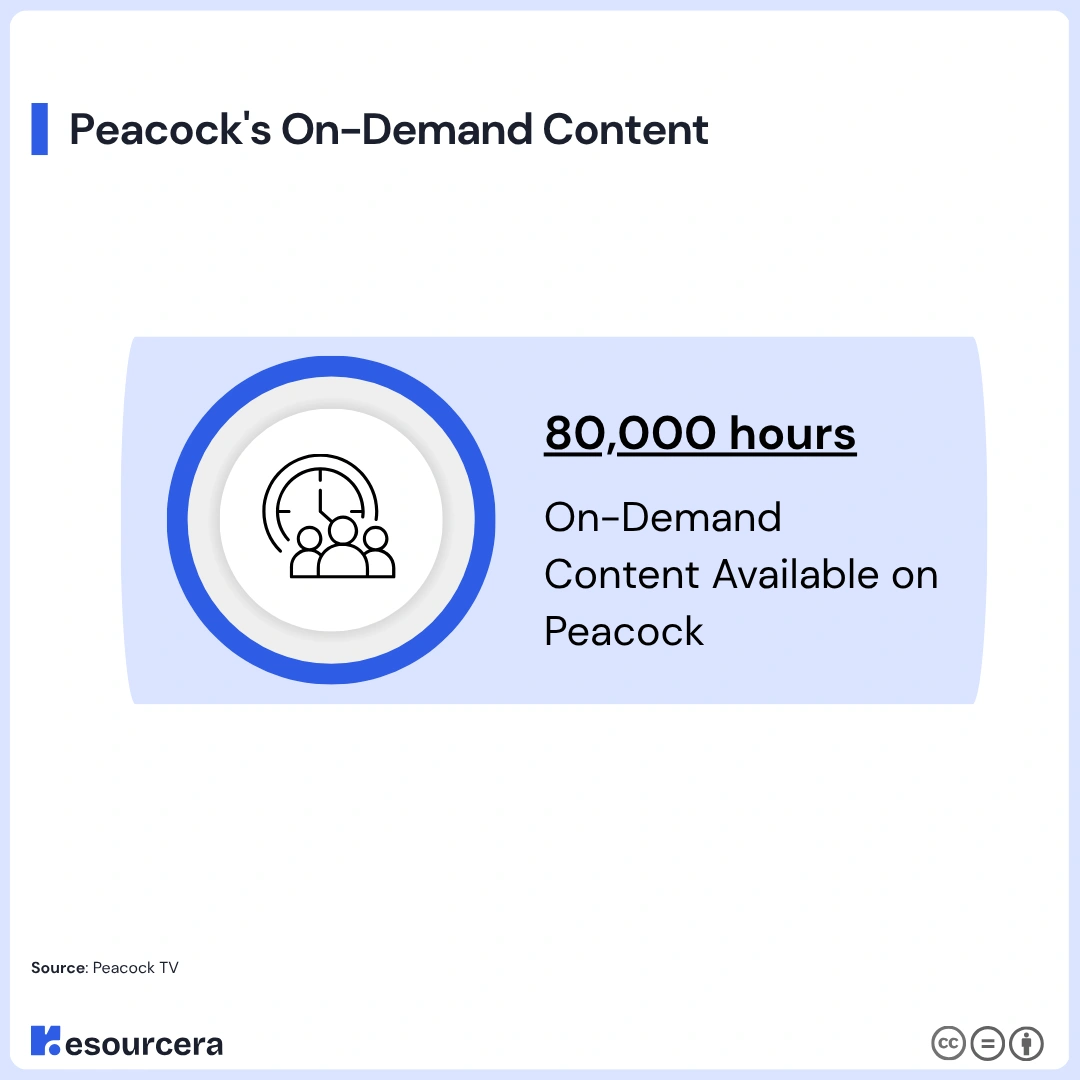
That is a 433% increase, or roughly 5.3 times the library it started with, in six years.
Here is a table comparing Peacock at launch with Peacock today:
| Metric | Peacock At Launch (Jan 2020) | Peacock In 2026 |
|---|---|---|
| Total content hours | 15,000+ | 80,000+ |
| Film library | 600+ titles | Universal, DreamWorks, Illumination, Focus |
| Live channels | Dozens of virtual channels planned | 81+ |
| Subscribers | 0 (pre-launch) | 46 million |
| Annual revenue | $118 million (2020) | $2 billion+ in Q1 2026 alone |
Source: Peacock TV
Peacock Launched With A 10,000-Hour Television Series Library
Of the 15,000 hours Peacock launched with, more than 10,000 were television series. The film library accounted for 1,200+ hours across 600+ titles.
The scripted anchor at launch was the Dick Wolf library, with over 1,000 hours of Law and Order and Chicago programming, alongside The Office and Yellowstone.
Source: Peacock TV.
Peacock’s Sports Strategy Started With The Olympics And The Premier League
Peacock was built around live sport from day one. Its launch commitments included live coverage of the Tokyo Olympics, over 1,000 hours of exclusive Paralympics streaming, 2,000 hours of Premier League coverage across more than 140 live matches, and Ryder Cup coverage.
Six years later the same strategy is producing $2.2 billion incremental revenue quarters from the Olympics and the Super Bowl, and NBA rights costs large enough to push a segment into a loss. The playbook has not changed. Only the scale has.
Source: Peacock Content Addendum
Peacock Statistics For Marketers
Peacock built its advertising model deliberately, and most of the rules it set at launch still define how the platform sells ads today.
Peacock Committed To Five Minutes Of Ads Per Hour Or Less
Peacock’s launch playbook promised the lightest ad load in the industry at five minutes per hour or less. That is roughly a third of the ad load of linear television.
Peacock also committed to frequency caps, so viewers are not shown the same advertisement repeatedly, and to patent-pending quality assurance tools covering resolution and bit rate.
Source: Peacock Advertising and Partnerships Fact Sheet, NBCUniversal
Peacock Launched With Ten Distinct Ad Formats
Peacock did not launch with a single ad unit. Its opening roster included ten formats, each designed for a different viewing moment.
Here is a table of Peacock’s launch ad formats:
| Ad Format | What It Does |
|---|---|
| ShoppableTV | Turns content into a purchase moment |
| Prime Pods | Single 60-second ownable pods that cut ad load |
| Pause Ads | Full-screen takeover when a viewer pauses |
| Binge Ads | Watch three episodes, a sponsor gives you the fourth ad-free |
| Engagement Ads | Interactive units such as trivia and product galleries |
| Trending Ads | Ads placed alongside the day’s most topical content |
| Solo Ads | One single ad within an entire episode |
| Curator Ads | Brands sponsor editorially curated collections |
| Explore Ads | Contextual content on pause with a phone-based call to action |
| On Command Ads | Xfinity voice remote integration for exclusive offers |
Source: Peacock Blog.
ShoppableTV Converts Almost 30% Better Than Ecommerce Benchmarks
NBCUniversal reported that ShoppableTV delivers an average conversion rate almost 30% higher than ecommerce benchmarks.
This is the format that turns a viewing moment directly into a purchase, and it is the reason Peacock’s ad business is not simply a cheaper version of a TV spot buy.
Source: Peacock TV Press Releases, NBCUniversal.
Peacock Users Favour A Brand 24% More If They See It On The Platform
People who see a brand advertised on Peacock favour it in the real world 24% more. Alongside that, NBCUniversal reports a 50% purchase intent lift and a 12% lift in purchase consideration from integration into Peacock Originals.
Source: NBCUniversal
71% Of People Prefer The Peacock Ad Experience To Other AVODs
With roughly a third of the ad load of linear television and under five minutes of ads per hour, 71% of viewers say they prefer Peacock’s ad experience to other ad-supported streaming services.
Source: NBCUniversal
Peacock Demographics
Peacock’s audience is broad, but it leans slightly female and heavily millennial.
52% Of Peacock Users Are Female And 48% Are Male
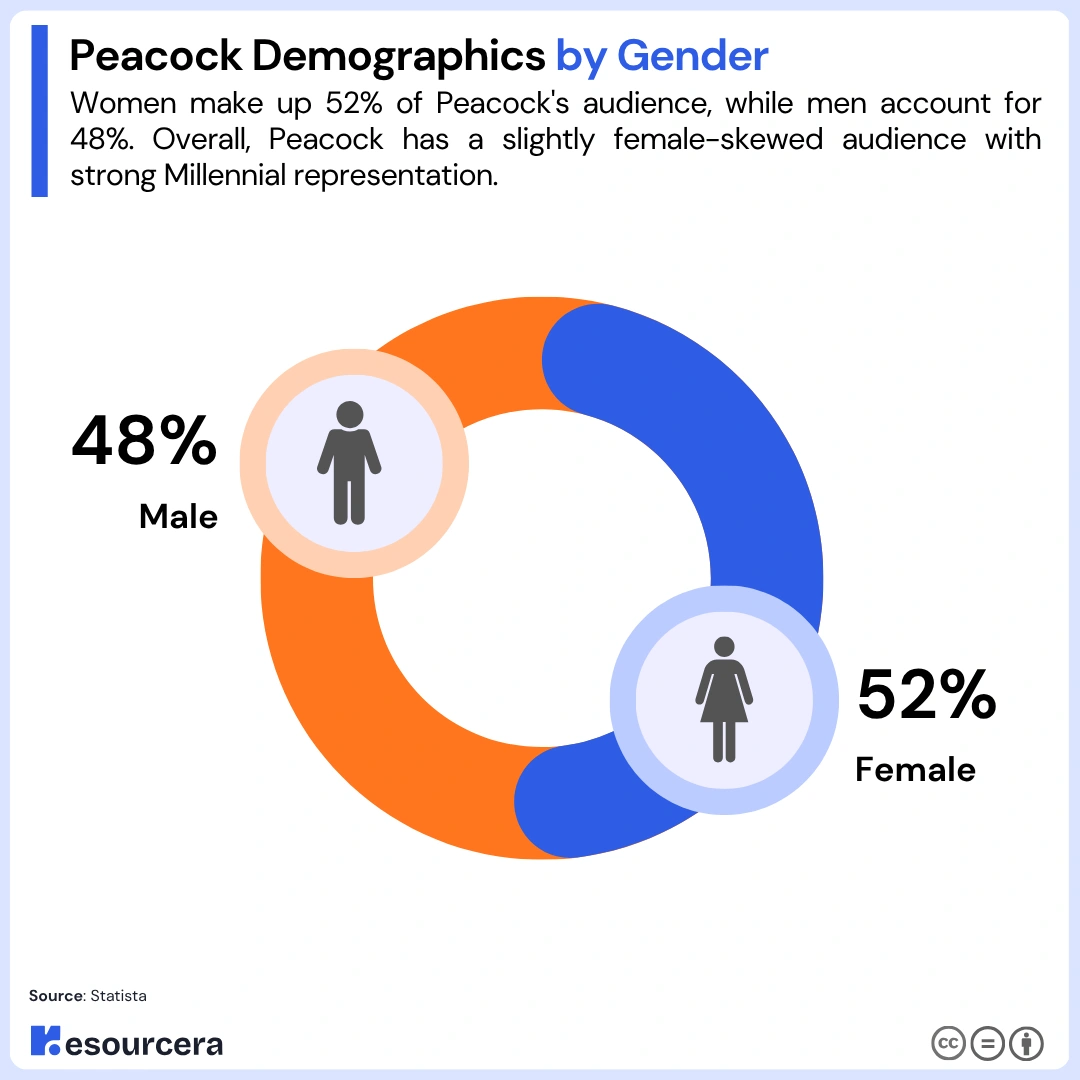
The split is close to even. Netflix the largest streaming service in the world, reports a similar 51:49 split.
31.86% Of Peacock Users Are Aged 25 To 34
Millennials are Peacock’s largest audience by a wide margin. The 35 to 44 group is second at 21.62%. Everyone aged 55 and over accounts for just 16.09% combined.
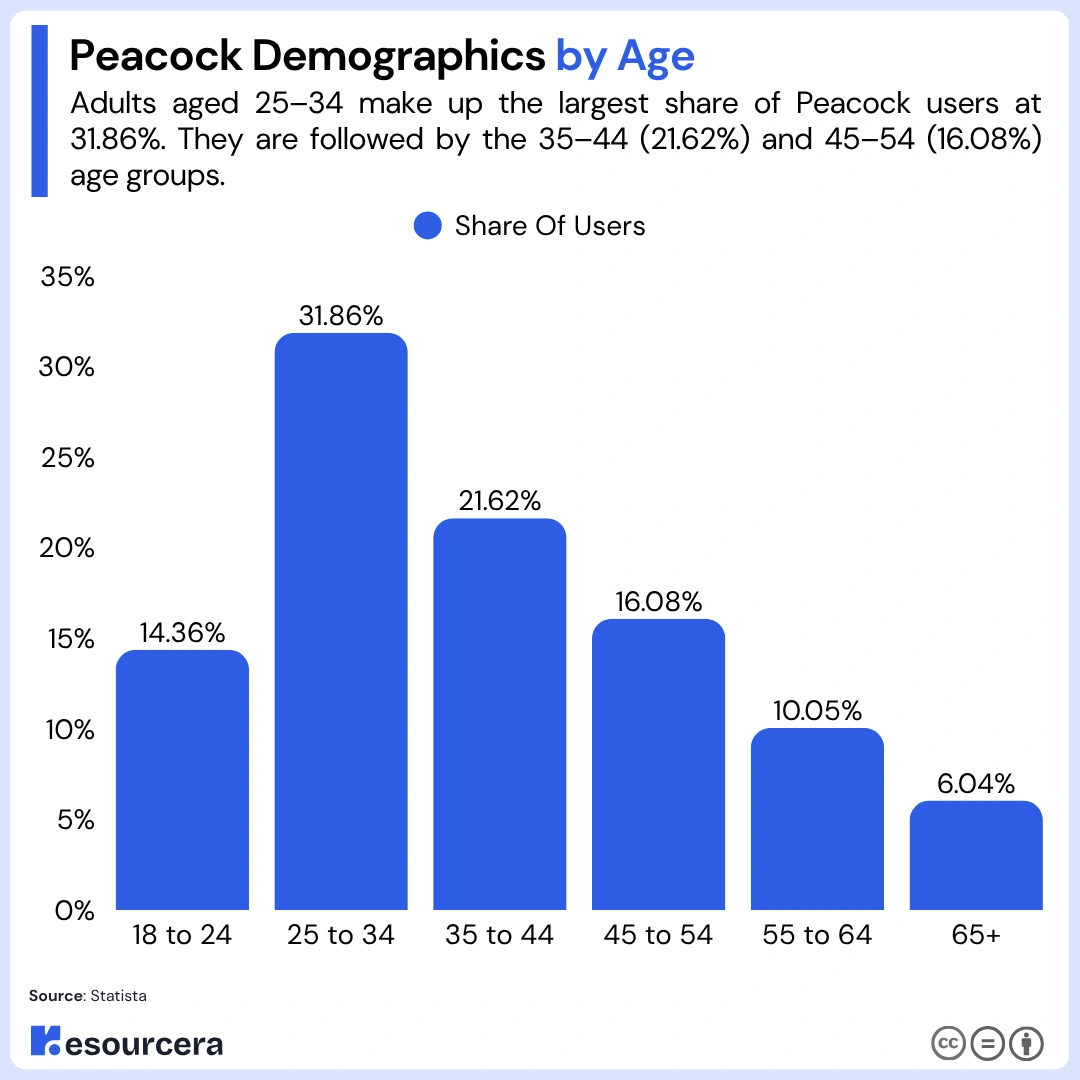
Here is a table showing Peacock’s user base by age:
| Age | Share Of Users |
|---|---|
| 18 to 24 | 14.36% |
| 25 to 34 | 31.86% |
| 35 to 44 | 21.62% |
| 45 to 54 | 16.08% |
| 55 to 64 | 10.05% |
| 65+ | 6.04% |
Peacock Is Most Popular Among Millennials And Gen Z
Peacock is streamed daily by 13% of Gen Z and 11% of millennials in the United States. Baby boomers are the least likely to stream it daily, at 3%.
Source: Statista
Conclusion: Peacock Has 46 Million Subscribers And Its First $2 Billion Quarter
Peacock enters the rest of 2026 with 46 million subscribers, its first-ever $2 billion quarter, 71% year-over-year revenue growth, and 1.7% of all American television screen time.
The cost of getting there is visible in the same numbers. The Olympics, the Super Bowl, and NBA rights pushed NBCUniversal’s Media segment to a $426 million adjusted EBITDA loss in the quarter that produced the record revenue. Comcast is buying scale, and it is paying for it now.
The strategy has not changed since January 2020. Peacock launched with 15,000 hours of content and a bet on live sport. It now has more than 80,000 hours and the same bet, just with the Super Bowl and the Olympics instead of the Ryder Cup. In six years it has gone from nothing to more than a quarter of NBCUniversal’s Media revenue.