


Google handles more than 5 trillion searches every year. That works out to billions of queries every single day, and each one is a small window into what people want to know, buy, watch, or find.
So what are people actually typing into that search box?
This page lists the 100 most searched things on Google in the United States and the 100 most searched things worldwide, along with monthly search volumes and the intent behind each term.
All search volume figures on this page were pulled using Semrush keyword data. NSFW terms, misspellings, and duplicate variations have been removed so the lists stay clean and useful.
Most Searched Things on Google: Key Highlights
Here are the headline numbers from our analysis of the top 100 lists.
- YouTube is the most searched thing on Google, with 185 million monthly searches in the US and 1.3 billion worldwide.
- Amazon is the second most searched term in the US at 151 million monthly searches.
- 63 of the top 100 US searches carry navigational intent, meaning people are using Google to reach a site they already know.
- 91 of the top 100 US searches are navigational, informational, or both. Only 9 are purely commercial or transactional.
- ChatGPT is now the 7th most searched term in the US at 55.6 million monthly searches, ahead of Walmart, eBay, and Instagram.
- “What is my ip” is the most asked question on Google in the US at 980,000 monthly searches.
- “What is today” is the most asked question globally at 5.05 million monthly searches.
- Translation terms appear 10 times across the global top 100 in six different languages.
- Weather terms appear 7 times across the global top 100, including Clima, Tiempo, Meteo, and Hava Durumu.
- Only 4 of the top 100 global searches carry commercial intent, which makes this list almost useless as a keyword target list.
What Is the Most Searched Thing on Google
The most searched thing on Google is YouTube. It holds the top spot in both the United States and the global rankings, and it is not a close race in either one.
Below is a breakdown of the single most searched term in each market, plus the most asked question.
Most Searched Thing on Google in the US
YouTube is the most searched thing on Google in the US, with 185 million searches per month. Amazon sits in second place with 151 million, followed by Facebook at 101 million.
The gap between first and second place is around 34 million monthly searches. The gap between second and third is even wider at 50 million.
Most Searched Thing on Google Worldwide
YouTube is also the most searched thing on Google worldwide, with 1.3 billion monthly searches. That is more than twice the volume of the second place term.
Facebook takes second place globally with 549.4 million monthly searches, followed by Translate at 502.2 million.
Notice that Translate ranks third worldwide but does not crack the global top 10 in most people’s expectations. Translation is one of the highest volume needs on the entire internet.
Most Searched Question on Google
The most asked question on Google in the US is “what is my ip” at 980,000 monthly searches. Globally, the most asked question is “what is today” at 5.05 million monthly searches.
Both of these tell the same story. People use Google to answer very small, very practical questions that they could technically answer another way.
Top 100 Most Searched Things on Google in the US
The US top 100 is dominated by platforms people visit every day. Streaming, shopping, email, social media, and news make up most of the list, with a handful of tools and games mixed in.
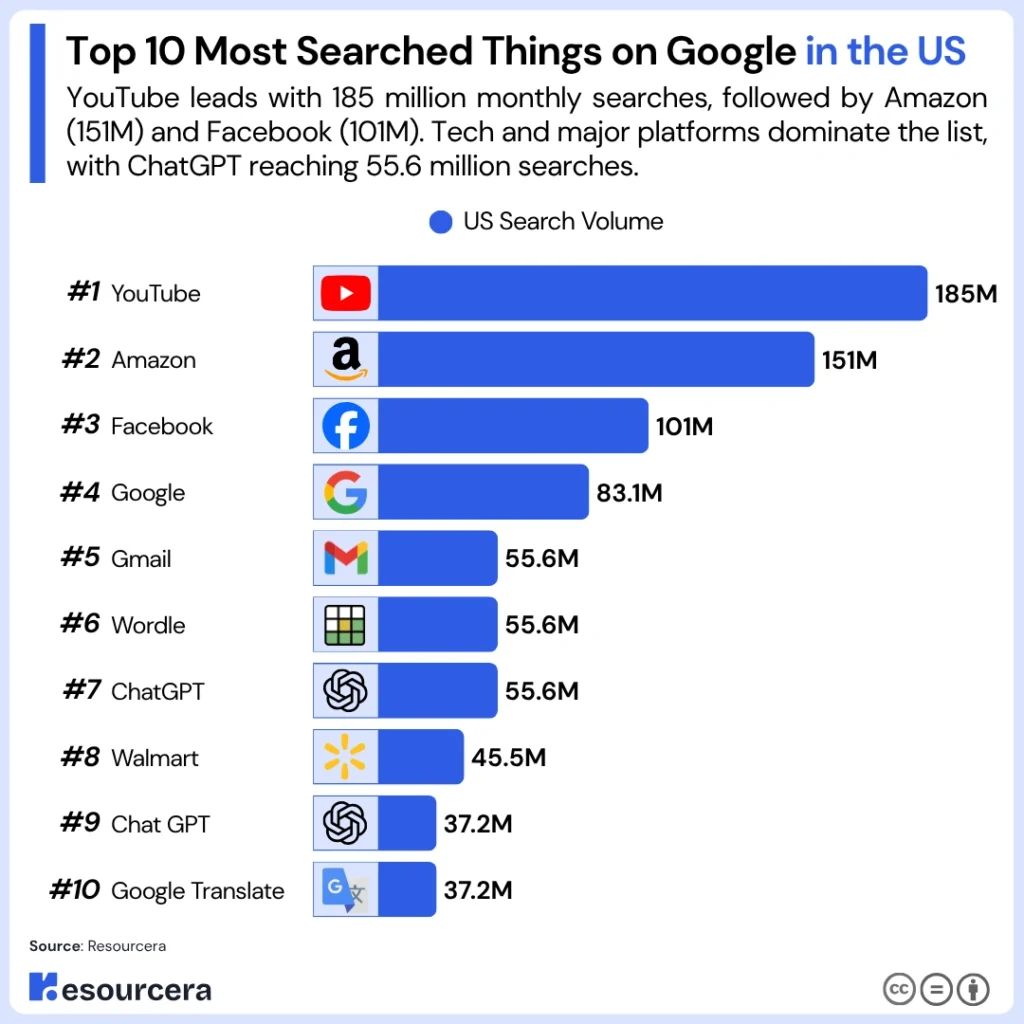
Search volumes below represent average monthly searches in the United States. The intent column shows the likely reason behind each search.
| # | Search Term | US Search Volume | Search Intent |
|---|---|---|---|
| 1 | YouTube | 185 million | Navigational |
| 2 | Amazon | 151 million | Navigational |
| 3 | 101 million | Navigational | |
| 4 | 83.1 million | Navigational | |
| 5 | Gmail | 55.6 million | Navigational |
| 6 | Wordle | 55.6 million | Informational |
| 7 | ChatGPT | 55.6 million | Informational, Navigational |
| 8 | Walmart | 45.5 million | Navigational |
| 9 | Chat GPT | 37.2 million | Informational |
| 10 | Google Translate | 37.2 million | Informational |
| 11 | News | 37.2 million | Informational, Commercial |
| 12 | eBay | 30.4 million | Navigational |
| 13 | Home Depot | 30.4 million | Transactional |
| 14 | Food Near Me | 30.4 million | Transactional |
| 15 | NFL | 30.4 million | Informational, Navigational |
| 16 | Translate | 30.4 million | Informational |
| 17 | Yahoo | 30.4 million | Navigational |
| 18 | Yahoo Mail | 30.4 million | Navigational |
| 19 | Calculator | 24.9 million | Informational |
| 20 | Amazon Prime | 24.9 million | Navigational, Transactional |
| 21 | NBA | 24.9 million | Informational, Navigational |
| 22 | Target | 20.4 million | Navigational |
| 23 | Trump | 20.4 million | Informational |
| 24 | Google Flights | 20.4 million | Navigational, Transactional |
| 25 | 20.4 million | Navigational | |
| 26 | Canva | 20.4 million | Navigational |
| 27 | Spotify | 16.6 million | Navigational |
| 28 | ESPN | 16.6 million | Navigational |
| 29 | Costco | 16.6 million | Navigational, Commercial |
| 30 | CNN | 16.6 million | Informational |
| 31 | Lowes | 16.6 million | Navigational |
| 32 | USPS Tracking | 16.6 million | Transactional |
| 33 | Best Buy | 13.6 million | Commercial |
| 34 | Blooket | 13.6 million | Navigational |
| 35 | Dow Jones | 13.6 million | Informational, Commercial |
| 36 | Traductor | 13.6 million | Informational |
| 37 | Indeed | 13.6 million | Navigational |
| 38 | Netflix | 13.6 million | Navigational |
| 39 | Gemini | 13.6 million | Navigational |
| 40 | Zillow | 13.6 million | Navigational |
| 41 | 13.6 million | Navigational | |
| 42 | Google Maps | 13.6 million | Navigational |
| 43 | Walgreens | 13.6 million | Navigational |
| 44 | Restaurants Near Me | 13.6 million | Transactional |
| 45 | X | 13.6 million | Navigational |
| 46 | Connections | 13.6 million | Informational, Navigational |
| 47 | English to Spanish | 11.1 million | Informational |
| 48 | Solitaire | 11.1 million | Informational |
| 49 | CVS | 11.1 million | Navigational |
| 50 | Wells Fargo | 11.1 million | Navigational |
| 51 | StreamEast | 11.1 million | Navigational, Transactional |
| 52 | Clima | 11.1 million | Informational |
| 53 | Roblox | 11.1 million | Navigational |
| 54 | Spanish to English | 9.1 million | Informational |
| 55 | Shein | 9.1 million | Navigational |
| 56 | Capital One | 9.1 million | Navigational |
| 57 | Weather | 9.1 million | Informational |
| 58 | Airbnb | 9.1 million | Transactional |
| 59 | Eight Sleep | 9.1 million | Navigational |
| 60 | Gimkit | 9.1 million | Informational, Commercial |
| 61 | Etsy | 9.1 million | Navigational |
| 62 | UFC | 9.1 million | Informational |
| 63 | Facebook Marketplace | 9.1 million | Commercial |
| 64 | American Airlines | 9.1 million | Navigational |
| 65 | MSN | 9.1 million | Navigational |
| 66 | UPS Tracking | 9.1 million | Transactional |
| 67 | Dominos | 9.1 million | Navigational |
| 68 | TikTok | 9.1 million | Navigational |
| 69 | 9.1 million | Navigational | |
| 70 | Speed Test | 9.1 million | Informational |
| 71 | Lakers | 9.1 million | Informational |
| 72 | 7.5 million | Navigational | |
| 73 | Gmail Login | 7.5 million | Navigational |
| 74 | Real Madrid | 7.5 million | Transactional |
| 75 | Math Solver | 7.5 million | Navigational |
| 76 | Harbor Freight | 7.5 million | Navigational |
| 77 | FedEx Tracking | 7.5 million | Informational, Transactional |
| 78 | Temu | 6.1 million | Informational, Commercial |
| 79 | Kahoot | 6.1 million | Navigational, Commercial |
| 80 | 123movies | 6.1 million | Navigational |
| 81 | PayPal | 6.1 million | Navigational, Transactional |
| 82 | Starbucks | 6.1 million | Navigational |
| 83 | Pizza Hut | 6.1 million | Navigational |
| 84 | Ikea | 6.1 million | Navigational |
| 85 | Nvidia Stock | 6.1 million | Informational, Commercial |
| 86 | Poki | 6.1 million | Navigational |
| 87 | Premier League | 6.1 million | Informational |
| 88 | Outlook | 6.1 million | Navigational |
| 89 | Twitch | 6.1 million | Navigational |
| 90 | Super Bowl 2025 | 5 million | Informational |
| 91 | Discord | 5 million | Navigational |
| 92 | Google Scholar | 4.1 million | Navigational |
| 93 | Social Security | 4.1 million | Informational |
| 94 | Snake Game | 4.1 million | Informational |
| 95 | DuckDuckGo | 4.1 million | Navigational |
| 96 | Champions League | 4.1 million | Informational |
| 97 | Facebook Login | 4.1 million | Navigational, Transactional |
| 98 | Clever | 4.1 million | Navigational |
| 99 | Speedtest | 2.7 million | Informational |
| 100 | McDonalds | 2.7 million | Navigational |
A few things stand out here. The top four spots are all navigational searches for major platforms. ChatGPT and ChatGPT appear separately at positions 7 and 9, and together they account for 92.8 million monthly searches. If they were combined, ChatGPT would rank fourth in the entire country.
Games also punch above their weight. Wordle, Solitaire, Roblox, Blooket, Connections, Gimkit, Poki, Snake Game, and Kahoot all appear on the list.
Top 100 Most Searched Things on Google Worldwide
The global list looks very different from the US list. It includes non-English terms, regional platforms, local lottery results, and cricket, none of which show up in the American top 100.
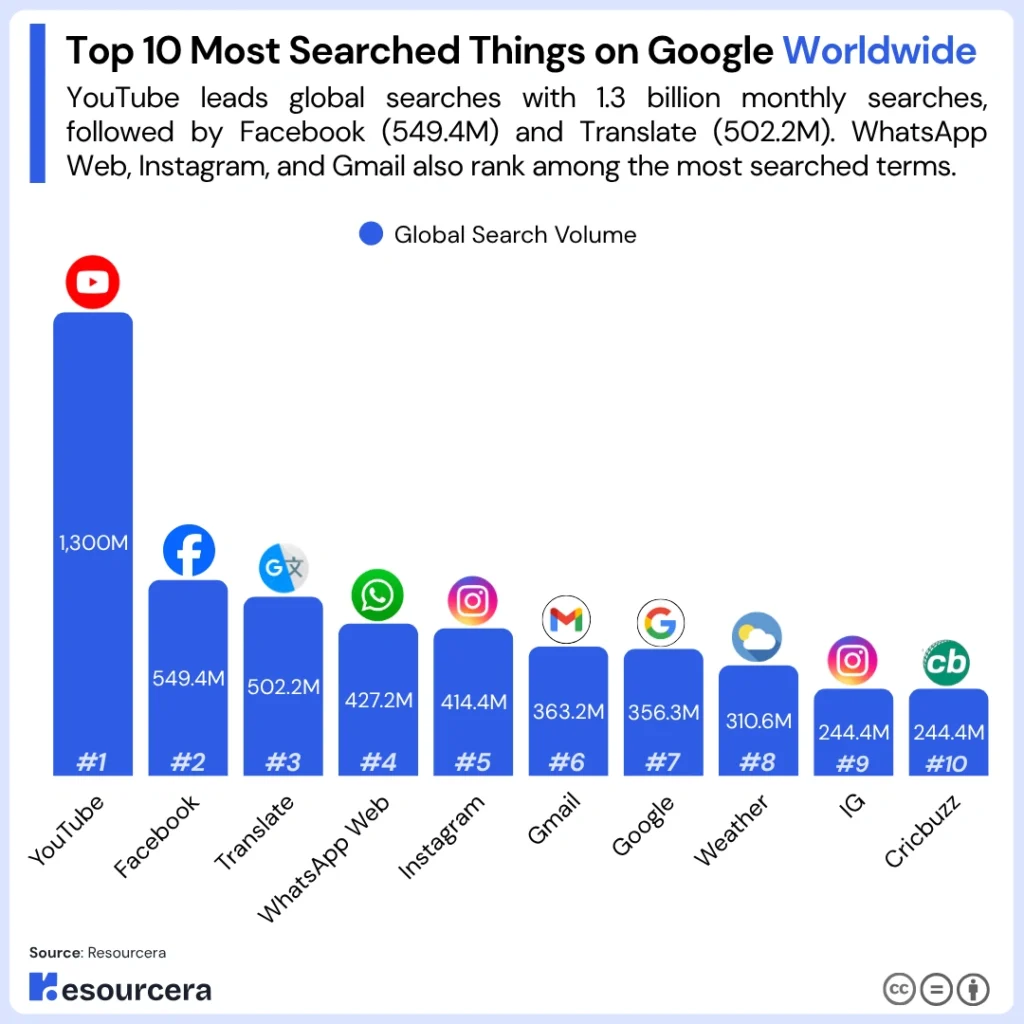
Search volumes below represent average monthly searches worldwide.
| # | Search Term | Global Search Volume | Search Intent |
|---|---|---|---|
| 1 | YouTube | 1.3 billion | Navigational |
| 2 | 549.4 million | Navigational | |
| 3 | Translate | 502.2 million | Informational |
| 4 | WhatsApp Web | 427.2 million | Navigational |
| 5 | 414.4 million | Navigational | |
| 6 | Gmail | 363.2 million | Navigational, Transactional |
| 7 | 356.3 million | Navigational | |
| 8 | Weather | 310.6 million | Informational |
| 9 | IG | 244.4 million | Navigational |
| 10 | Cricbuzz | 244.4 million | Navigational |
| 11 | Clima | 227.1 million | Informational |
| 12 | ChatGPT | 223.8 million | Informational, Navigational |
| 13 | Canva | 215.7 million | Navigational |
| 14 | Google Translate | 181.4 million | Informational |
| 15 | Chat GPT | 162.5 million | Navigational |
| 16 | Traductor | 156 million | Informational |
| 17 | Poki | 153.6 million | Navigational |
| 18 | Amazon | 151.3 million | Navigational |
| 19 | Satta King | 151.3 million | Navigational |
| 20 | 141.6 million | Navigational | |
| 21 | Google Maps | 125.5 million | Informational, Navigational |
| 22 | 108.1 million | Navigational | |
| 23 | TikTok | 102.5 million | Navigational |
| 24 | Sarkari Result | 101.2 million | Navigational |
| 25 | 99.7 million | Navigational | |
| 26 | погода | 96.9 million | Informational |
| 27 | Yahoo Mail | 94.9 million | Navigational |
| 28 | Wordle | 93.7 million | Informational, Navigational |
| 29 | Restaurants | 93.3 million | Transactional |
| 30 | Netflix | 90.1 million | Navigational |
| 31 | X | 87.5 million | Navigational |
| 32 | Roblox | 83.6 million | Navigational |
| 33 | IPL | 81.9 million | Informational, Navigational |
| 34 | Real Madrid | 80.8 million | Informational |
| 35 | FB | 78 million | Informational |
| 36 | Yahoo | 77.7 million | Navigational |
| 37 | переводчик | 77.2 million | Informational |
| 38 | NBA | 75.8 million | Informational, Navigational |
| 39 | Hotmail | 74.1 million | Navigational |
| 40 | Tradutor | 73.9 million | Informational |
| 41 | Lottery Sambad | 68.2 million | Informational, Transactional |
| 42 | News | 67.8 million | Informational, Commercial |
| 43 | Tiempo | 67.6 million | Informational |
| 44 | Speed Test | 65.4 million | Informational |
| 45 | eBay | 65.1 million | Navigational |
| 46 | BBC News | 63.4 million | Navigational |
| 47 | Spotify | 63.1 million | Navigational |
| 48 | Weather Tomorrow | 58.5 million | Informational |
| 49 | Betano | 58 million | Navigational, Commercial |
| 50 | Premier League | 57.7 million | Informational, Navigational |
| 51 | Flipkart | 56.8 million | Navigational |
| 52 | Map | 56.7 million | Navigational |
| 53 | ютуб | 56.5 million | Navigational |
| 54 | Walmart | 55.6 million | Navigational |
| 55 | Calculator | 53.2 million | Informational |
| 56 | Facebook Login | 52.9 million | Navigational, Transactional |
| 57 | 51 million | Navigational | |
| 58 | çeviri | 50.5 million | Navigational |
| 59 | Serie A | 50.4 million | Navigational |
| 60 | Outlook | 48.9 million | Navigational |
| 61 | Meteo | 48.7 million | Informational |
| 62 | Hava Durumu | 47.6 million | Informational |
| 63 | Google Traduction | 46.8 million | Informational, Commercial |
| 64 | Dpboss | 46.1 million | Informational |
| 65 | NFL | 45.6 million | Informational, Navigational |
| 66 | Barcelona | 45.5 million | Informational |
| 67 | Ikea | 44.7 million | Navigational |
| 68 | Yandex | 44.1 million | Navigational |
| 69 | Shein | 44.1 million | Transactional |
| 70 | Hotels | 43.6 million | Transactional |
| 71 | SkyScanner | 43.5 million | Navigational |
| 72 | ترجمة | 42.3 million | Informational |
| 73 | Restaurants Near Me | 41.5 million | Transactional |
| 74 | Champions League | 40.3 million | Informational |
| 75 | Airbnb | 40 million | Transactional |
| 76 | Temu | 39.8 million | Informational, Commercial |
| 77 | Live Score | 39.4 million | Navigational |
| 78 | Twitch | 39 million | Navigational |
| 79 | Indeed | 38.7 million | Navigational |
| 80 | 37.5 million | Navigational | |
| 81 | Amazon Prime | 37.4 million | Transactional |
| 82 | Google Flights | 37 million | Navigational, Transactional |
| 83 | Cricket | 36.4 million | Informational |
| 84 | Telegram | 36.4 million | Navigational |
| 85 | Food Near Me | 36.2 million | Transactional |
| 86 | Home Depot | 36 million | Transactional |
| 87 | Google Scholar | 35 million | Navigational, Transactional |
| 88 | Flashscore | 34 million | Navigational |
| 89 | WP | 33.8 million | Navigational |
| 90 | Flamengo | 32.6 million | Navigational |
| 91 | Discord | 31.7 million | Navigational |
| 92 | Speedtest | 30.7 million | Informational |
| 93 | Xổ Số Miền Nam | 30.7 million | Navigational |
| 94 | CNN | 28.5 million | Informational |
| 95 | Proxy | 27 million | Informational |
| 96 | Ibomma | 25.8 million | Informational |
| 97 | Gmail Login | 25.3 million | Navigational |
| 98 | Liverpool | 24.5 million | Informational |
| 99 | Futbol Libre | 20.4 million | Navigational |
| 100 | Manchester United | 19.3 million | Informational |
The global list has a much longer tail of everyday utility searches. Weather, translation, maps, calculators, and speed tests all appear multiple times in multiple languages.
It also reflects where Google is used most heavily. India alone contributes Cricbuzz, Satta King, Sarkari Result, IPL, Lottery Sambad, Flipkart, Dpboss, Cricket, and Ibomma to the top 100.
Most Searched Questions on Google
The top 100 lists above are mostly brand names. They tell you where people go, but not what people want to know.
Questions are a different data set entirely. They show the actual problems and curiosities people bring to search, and they are far more useful if you create content for a living.
Here are the 50 most asked questions on Google in the United States, ranked by average monthly search volume.
| # | Question | US Search Volume |
|---|---|---|
| 1 | what is my ip | 980,000 |
| 2 | how many days until christmas | 860,000 |
| 3 | what is today | 710,000 |
| 4 | what does 6 7 mean | 580,000 |
| 5 | how many weeks in a year | 530,000 |
| 6 | how to make a budget | 530,000 |
| 7 | what day is it | 510,000 |
| 8 | what does 67 mean | 510,000 |
| 9 | when is easter | 480,000 |
| 10 | when is easter 2026 | 470,000 |
| 11 | what to watch | 460,000 |
| 12 | how to screenshot on mac | 460,000 |
| 13 | when is the super bowl | 460,000 |
| 14 | when is thanksgiving | 400,000 |
| 15 | what is artificial intelligence | 360,000 |
| 16 | how to tie a tie | 360,000 |
| 17 | how many ounces in a gallon | 350,000 |
| 18 | how to change a tire | 350,000 |
| 19 | how many ounces in a cup | 340,000 |
| 20 | how to start a blog | 320,000 |
| 21 | how to screenshot on windows | 310,000 |
| 22 | how to learn javascript | 310,000 |
| 23 | when is mothers day | 300,000 |
| 24 | what is machine learning | 290,000 |
| 25 | what is juneteenth | 290,000 |
| 26 | what is phishing | 290,000 |
| 27 | when is father’s day | 280,000 |
| 28 | what time is the super bowl | 270,000 |
| 29 | what is an api | 270,000 |
| 30 | what is my ip address | 260,000 |
| 31 | when is the next full moon | 260,000 |
| 32 | what time does mcdonald’s stop serving breakfast | 260,000 |
| 33 | how many days till christmas | 260,000 |
| 34 | where is the super bowl 2026 | 260,000 |
| 35 | where to watch | 260,000 |
| 36 | how many people are in the world | 250,000 |
| 37 | is the government still shutdown | 240,000 |
| 38 | when is thanksgiving 2025 | 240,000 |
| 39 | when is daylight savings | 240,000 |
| 40 | how many seconds in a day | 240,000 |
| 41 | what is a vpn | 230,000 |
| 42 | how many ounces in a pound | 230,000 |
| 43 | what time is it | 230,000 |
| 44 | when is father’s day 2025 | 220,000 |
| 45 | how long to boil eggs | 220,000 |
| 46 | when is christmas | 220,000 |
| 47 | how many oz in a cup | 220,000 |
| 48 | how to delete instagram account | 210,000 |
| 49 | how many oz in a gallon | 210,000 |
| 50 | how many quarts in a gallon | 200,000 |
Look closely, and a pattern appears. Almost none of these questions are complicated. People ask Google for dates, unit conversions, quick definitions, and simple instructions.
The sections below break the list down by how each question starts.
Most Searched How To Questions
How-to questions are the backbone of instructional content. They are evergreen, they rarely go out of date, and they cover skills people need at every stage of life.
| Question | US Search Volume |
|---|---|
| how to make a budget | 530,000 |
| how to screenshot on mac | 460,000 |
| how to tie a tie | 360,000 |
| how to change a tire | 350,000 |
| how to start a blog | 320,000 |
| how to screenshot on windows | 310,000 |
| how to learn javascript | 310,000 |
| how to delete instagram account | 210,000 |
| how to gain weight | 200,000 |
| how to cook rice | 200,000 |
| how to write a check | 190,000 |
| how to clear cache | 180,000 |
Notice how many of these are one-time tasks. Most people tie a tie or change a tire rarely enough that they need to look it up every time.
Most Searched ‘What Is’ Questions
What is questions are definition searches. They spike when a new technology, holiday, or piece of slang enters public awareness.
| Question | US Search Volume |
|---|---|
| what is my ip | 980,000 |
| what is today | 710,000 |
| what is artificial intelligence | 360,000 |
| what is machine learning | 290,000 |
| what is juneteenth | 290,000 |
| what is phishing | 290,000 |
| what is an api | 270,000 |
| what is my ip address | 260,000 |
| what is a vpn | 230,000 |
| what is python | 200,000 |
| what is a url | 200,000 |
| what is cryptocurrency | 180,000 |
Technology terms dominate this group. Artificial intelligence, machine learning, VPNs, APIs, phishing, and cryptocurrency all appear in the top 100 questions.
Most Searched When Questions
When questions are almost entirely about dates. Holidays, sporting events, and calendar changes drive nearly all of the volume here.
| Question | US Search Volume |
|---|---|
| when is easter | 480,000 |
| when is easter 2026 | 470,000 |
| when is the super bowl | 460,000 |
| when is thanksgiving | 400,000 |
| when is mothers day | 300,000 |
| when is father’s day | 280,000 |
| when is the next full moon | 260,000 |
| when is daylight savings | 240,000 |
| when is christmas | 220,000 |
| when is halloween | 180,000 |
| when is black friday | 170,000 |
| when is labor day | 160,000 |
These are seasonal keywords with predictable spikes. They look modest as a 12-month average, but the real volume lands in a short window each year.
Most Searched Where, Who, and Is Questions
The remaining question types cover location, identity, and status checks. They are smaller in volume but reveal a lot about how people use search day to day.
| Question | US Search Volume |
|---|---|
| where is the super bowl 2026 | 260,000 |
| where to watch | 260,000 |
| where am i | 190,000 |
| is the government still shutdown | 240,000 |
| is youtube down | 170,000 |
| is today a holiday | 160,000 |
| how many people are in the world | 250,000 |
| what time is it | 230,000 |
“Where am i” and “what time is it” are worth pausing on. People search Google for information their own device already displays.
Most Searched Questions Worldwide
The global question list looks quite different. Non-English questions appear high up, and regional interests like Indian railways and cricket trivia break into the top 20.
| # | Question | Global Search Volume |
|---|---|---|
| 1 | what is today | 5,053,000 |
| 2 | what is my ip | 2,918,000 |
| 3 | امروز چندمه | 2,194,000 |
| 4 | what to watch | 1,661,000 |
| 5 | where’s my refund | 1,277,000 |
| 6 | how many days until christmas | 1,210,000 |
| 7 | where is my train | 1,162,000 |
| 8 | o que significa | 966,000 |
| 9 | how to create invoices | 930,000 |
| 10 | how to learn javascript | 929,000 |
| 11 | 令和何年 | 903,000 |
| 12 | how many weeks in a year | 887,000 |
| 13 | how to start a blog | 884,000 |
| 14 | whats my ip | 876,000 |
| 15 | how to change a tire | 783,000 |
| 16 | what does 67 mean | 768,000 |
| 17 | who called me | 767,000 |
| 18 | how many balls were originally there in one test over? | 724,000 |
| 19 | how to make a budget | 713,000 |
| 20 | what does 6 7 mean | 701,000 |
| 21 | what is a two-factor authentication method | 686,000 |
| 22 | what is two factor vs two step | 669,000 |
| 23 | when is easter | 667,000 |
| 24 | have i been pwned | 666,000 |
| 25 | cuándo juega el real madrid | 638,000 |
“What is today” gets more than five million searches worldwide every month. That single question outranks every other query on the list by a wide margin.
Most Searched Things on Google by Category
Ranking the top 100 by raw volume is useful, but grouping the same terms by category is where the patterns get interesting.
The sections below sort the US and global lists into the categories that appear most often.
Most Searched Brands
Brand names take up more of the top 100 than any other category. These are people using Google as a shortcut instead of typing a web address.
| Brand | US Search Volume |
|---|---|
| YouTube | 185 million |
| Amazon | 151 million |
| 101 million | |
| 83.1 million | |
| Gmail | 55.6 million |
| Walmart | 45.5 million |
| eBay | 30.4 million |
| Home Depot | 30.4 million |
| Yahoo | 30.4 million |
| Target | 20.4 million |
| 20.4 million | |
| Canva | 20.4 million |
The pattern holds worldwide too. Every one of the global top 10 except Translate and Weather is a brand name.
Most Searched Social Media Platforms on Google
Social platforms appear throughout both lists, and several appear more than once under different names.
| Platform | US Search Volume | Global Search Volume |
|---|---|---|
| 101 million | 549.4 million | |
| 20.4 million | 414.4 million | |
| 13.6 million | 37.5 million | |
| X | 13.6 million | 87.5 million |
| TikTok | 9.1 million | 102.5 million |
| 9.1 million | 108.1 million | |
| 7.5 million | 51 million | |
| Twitch | 6.1 million | 39 million |
| Discord | 5 million | 31.7 million |
| Telegram | Not in US top 100 | 36.4 million |
Facebook picks up extra volume from shorthand searches. Worldwide, “FB” adds another 78 million monthly searches on top of the main brand term, and “Facebook Login” adds 52.9 million more.
Instagram does the same. The abbreviation “IG” pulls 244.4 million global searches, which is more than half the volume of the full brand name.
Most Searched AI Tools on Google
AI tools are the fastest-moving category on either list. A few years ago, none of these terms would have appeared at all.
| AI Tool | US Search Volume | Global Search Volume |
|---|---|---|
| ChatGPT | 55.6 million | 223.8 million |
| Chat GPT | 37.2 million | 162.5 million |
| Gemini | 13.6 million | Not in global top 100 |
The split spelling matters here. Combined, ChatGPT and Chat GPT account for 92.8 million US searches and 386.3 million global searches every month.
That combined figure would place ChatGPT fourth in the US and third worldwide.
Most Searched Online Games
Games are heavily represented, especially browser games and puzzles that people play at work or school.
| Game | US Search Volume |
|---|---|
| Wordle | 55.6 million |
| Blooket | 13.6 million |
| Connections | 13.6 million |
| Solitaire | 11.1 million |
| Roblox | 11.1 million |
| Gimkit | 9.1 million |
| Kahoot | 6.1 million |
| Poki | 6.1 million |
| Snake Game | 4.1 million |
Several of these are classroom tools rather than pure games. Blooket, Gimkit, Kahoot, and Clever are all used in schools, which explains their strong US volume and weak global presence.
Most Searched Sports Terms
Sports drive enormous search volume, and the split between the two lists shows exactly how different American and global sporting interests are.
| Sports Term | US Search Volume | Global Search Volume |
|---|---|---|
| NFL | 30.4 million | 45.6 million |
| NBA | 24.9 million | 75.8 million |
| ESPN | 16.6 million | Not in global top 100 |
| UFC | 9.1 million | Not in global top 100 |
| Lakers | 9.1 million | Not in global top 100 |
| Real Madrid | 7.5 million | 80.8 million |
| Premier League | 6.1 million | 57.7 million |
| Champions League | 4.1 million | 40.3 million |
| Cricbuzz | Not in US top 100 | 244.4 million |
| IPL | Not in US top 100 | 81.9 million |
Cricbuzz is the standout. At 244.4 million monthly global searches, it outranks TikTok, Netflix, Amazon, and every football club on the list.
Football clubs also appear repeatedly worldwide. Real Madrid, Barcelona, Flamengo, Liverpool, and Manchester United all make the global top 100, along with Serie A, Flashscore, Live Score, and Futbol Libre.
Most Searched Near Me Terms
Near me searches are the clearest signal of local commercial intent anywhere on either list.
Food Near Me ranks 14th in the entire United States. That is higher than Instagram, Netflix, Spotify, and TikTok.
| Near Me Term | US Search Volume | Global Search Volume |
|---|---|---|
| Food Near Me | 30.4 million | 36.2 million |
| Restaurants Near Me | 13.6 million | 41.5 million |
| Restaurants | Not in US top 100 | 93.3 million |
Most Searched Translation Terms
Translation is the single most underrated category in search. It appears ten separate times across the global top 100 in six different languages.
| Translation Term | Language | Global Search Volume |
|---|---|---|
| Translate | English | 502.2 million |
| Google Translate | English | 181.4 million |
| Traductor | Spanish | 156 million |
| переводчик | Russian | 77.2 million |
| Tradutor | Portuguese | 73.9 million |
| çeviri | Turkish | 50.5 million |
| Google Traduction | French | 46.8 million |
| ترجمة | Arabic | 42.3 million |
Add these together, and translation-related terms account for more than 1.1 billion monthly searches worldwide. Only YouTube generates more.
Most Searched Weather Terms
Weather follows the same pattern as translation. It appears in several languages and adds up to enormous combined volume.
| Weather Term | Language | Global Search Volume |
|---|---|---|
| Weather | English | 310.6 million |
| Clima | Spanish and Portuguese | 227.1 million |
| погода | Russian | 96.9 million |
| Tiempo | Spanish | 67.6 million |
| Weather Tomorrow | English | 58.5 million |
| Meteo | Italian and French | 48.7 million |
| Hava Durumu | Turkish | 47.6 million |
Combined, weather searches pass 857 million per month globally. Clima also appears in the US top 100 at 11.1 million searches, driven by Spanish-speaking users in the United States.
Most Searched Email and Login Terms
Email platforms and login pages take up a surprising share of both lists. People search for the login page rather than bookmarking it.
| Term | US Search Volume | Global Search Volume |
|---|---|---|
| Gmail | 55.6 million | 363.2 million |
| Yahoo Mail | 30.4 million | 94.9 million |
| Gmail Login | 7.5 million | 25.3 million |
| Outlook | 6.1 million | 48.9 million |
| Facebook Login | 4.1 million | 52.9 million |
| Hotmail | Not in US top 100 | 74.1 million |
Hotmail is still pulling 74.1 million global searches per month despite being rebranded to Outlook years ago.
Most Searched Package Tracking Terms
Package tracking is one of the few categories on the US list with clear transactional intent.
| Tracking Term | US Search Volume |
|---|---|
| USPS Tracking | 16.6 million |
| UPS Tracking | 9.1 million |
| FedEx Tracking | 7.5 million |
Together these three terms represent 33.2 million monthly searches from people who are waiting on a delivery right now.
Regional and Language Patterns in the Global Top 100
The global top 100 is not a single worldwide list. It is really several regional lists stacked on top of each other, and you can see individual countries clearly if you know what to look for.
The sections below identify which markets are driving which entries.
India
India has the largest footprint of any single country outside the US, with nine separate entries in the global top 100.
| Term | Global Search Volume | What It Is |
|---|---|---|
| Cricbuzz | 244.4 million | Cricket scores and news |
| Satta King | 151.3 million | Lottery and betting results |
| Sarkari Result | 101.2 million | Government job results |
| IPL | 81.9 million | Indian Premier League cricket |
| Lottery Sambad | 68.2 million | State lottery results |
| Flipkart | 56.8 million | Ecommerce platform |
| Dpboss | 46.1 million | Betting results |
| Cricket | 36.4 million | Sport |
| Ibomma | 25.8 million | Regional film streaming |
Cricket, government exam results, lottery numbers, and shopping account for almost all of India’s presence on the list.
Spanish-Speaking Markets
Spanish terms appear across both the US and global lists, reflecting Spanish speakers in Latin America, Spain, and the United States.
| Term | Global Search Volume | English Meaning |
|---|---|---|
| Clima | 227.1 million | Weather |
| Traductor | 156 million | Translator |
| Tiempo | 67.6 million | Weather |
| Futbol Libre | 20.4 million | Free football streaming |
Clima and Traductor both appear in the US top 100 as well, at 11.1 million and 13.6 million monthly searches. So do English to Spanish and Spanish to English.
Brazil
Brazilian search interest shows up through Portuguese language terms and one football club.
| Term | Global Search Volume | What It Is |
|---|---|---|
| Tradutor | 73.9 million | Translator |
| Betano | 58 million | Sports betting platform |
| Flamengo | 32.6 million | Football club |
Turkey
Turkey contributes three high-volume terms, all everyday utilities.
| Term | Global Search Volume | English Meaning |
|---|---|---|
| çeviri | 50.5 million | Translation |
| Hava Durumu | 47.6 million | Weather |
Russia and Russian-speaking Markets
Russian terms appear four times, including the local search engine.
| Term | Global Search Volume | English Meaning |
|---|---|---|
| погода | 96.9 million | Weather |
| переводчик | 77.2 million | Translator |
| ютуб | 56.5 million | YouTube |
| Yandex | 44.1 million | Russian search engine |
People searching Google for “ютуб” and Yandex is a good reminder that search engines are used to reach other search engines and platforms constantly.
Other Markets
A few more countries appear once or twice each.
| Term | Global Search Volume | Market |
|---|---|---|
| Google Traduction | 46.8 million | France |
| Meteo | 48.7 million | Italy and France |
| ترجمة | 42.3 million | Arabic speaking markets |
| Xổ Số Miền Nam | 30.7 million | Vietnam |
| BBC News | 63.4 million | United Kingdom |
Trending Google Searches Are Not the Same as Most Searched
There is a common mix-up worth clearing up before you use any of this data.
“Most searched” and “top trending” are two completely different measurements, and Google itself has asked people to stop treating them as interchangeable.
The lists on this page measure total search volume averaged over 12 months. Google’s annual Year in Search report measures something else entirely, which is the searches that grew the fastest compared to the year before.
How Google Defines Trending Searches
Google builds its Year in Search lists by identifying the search terms that saw the biggest increase in traffic during the year compared to the same period the year before. It measures the spike in interest rather than the total number of searches.
Google’s reasoning is straightforward. Generic terms like weather and news are popular every single year, so they say nothing about what made a particular year different.
Google also uses a “breakout” label for anything searched at least 5,000% more than the previous year.
Top Trending Google Searches in 2025
Gemini was the top trending search worldwide in 2025, which shows how quickly AI tools moved into everyday use.
The rest of the global top 10 was mostly sports. Cricket matches between India and England, the Club World Cup, and the Asia Cup all drove major spikes in interest.
In the United States, the list looked very different. Charlie Kirk topped the US trending list, and the animated Netflix film KPop Demon Hunters took second place.
Other 2025 trending highlights included the following.
- Arc Raiders was the most searched video game globally, while Clair Obscur Expedition 33 led in the US.
- d4vd led musician searches, and Taylor Swift led song searches.
- Monster The Ed Gein Story was the most searched TV show worldwide.
- Pedro Pascal and Mikey Madison topped actor searches.
- Hot honey was the most searched food trend of the year.
- Boston, Seattle, and Tokyo led travel itinerary searches.
Why the Two Lists Give Different Answers
If you compare the two, almost nothing overlaps.
YouTube tops the most searched list every year but never appears on a trending list, because its volume barely changes year to year. Gemini topped the trending list but does not appear anywhere in the global top 100 by total volume.
Both measurements are valid. They just answer different questions. Most searched tells you where the traffic is. Trending tells you where the traffic is heading.
What the Top 100 Lists Reveal About Search Behavior
Reading the raw tables is one thing. Understanding what they say about how people actually use Google is more useful.
Here are the five clearest patterns in the data.
Navigational Searches Dominate
Out of the 100 most searched things in the US, 63 carry navigational intent. Worldwide, the figure is 61.
Navigational means the person already knows where they are going. They are searching for YouTube because they want to get to YouTube, not because they want to learn about it.
In other words, most of Google’s highest volume traffic is not really discovery. It is people using the search bar as an address bar.
Almost Nothing on These Lists Is Commercial
Only 9 of the top 100 US searches carry commercial intent, and only 13 carry transactional intent. Worldwide, the numbers are even lower, with just 4 commercial and 13 transactional.
Combine navigational and informational, and you get 91 out of 100 in the US and 92 out of 100 worldwide.
This is the single most important takeaway for anyone doing keyword research. The most searched terms on Google are almost never the terms that make money.
AI Tools Have Broken Into the Top 10
ChatGPT now sits at number 7 in the US with 55.6 million monthly searches. The alternate spelling Chat GPT sits at number 9 with another 37.2 million.
Together, that is 92.8 million monthly searches in the US alone, which would place it fourth overall, ahead of Google itself.
Gemini has also entered the US top 100 at number 39 with 13.6 million monthly searches. Neither of these terms existed at meaningful volume a few years ago.
People Use Google as a Utility
A large share of the top 100 is people asking Google to do a small job for them right now.
Calculator gets 24.9 million US searches. Speed Test gets 9.1 million, plus another 2.7 million for Speedtest. Translate and Google Translate together get 67.6 million. Weather gets 9.1 million in the US and 310.6 million worldwide.
None of these are research queries. They are people using Google the way you would use a pocket tool.
Everyday Needs Outrank Almost Every Brand
This is the pattern that surprises most people.
Worldwide, Translate outranks Instagram, Amazon, ChatGPT, and TikTok. Weather outranks all of them too.
Add every translation variant together, and you get more than 1.1 billion monthly searches. Add every weather variant together, and you get more than 857 million.
Only YouTube beats either of those totals. Two basic human needs, knowing the weather and understanding another language, generate more search demand than nearly every company on earth.
How Google Search Volume Is Changing in 2026
The lists on this page are a snapshot of demand. The bigger picture is that the whole search environment shifted noticeably over the past two years.
Here are the changes that matter most.
How Many Searches Google Handles Per Day
In March 2025, Google confirmed publicly that it processes more than 5 trillion searches per year. That was its first official volume update since 2016, when the figure given was at least 2 trillion.
Five trillion per year works out to roughly 13.7 billion searches per day.
Published daily estimates vary quite a lot, from around 8.5 billion to over 16 billion, depending on the methodology and whether the estimate covers all Google properties. The 5 trillion annual figure is the only number Google has confirmed itself, so it is the safest anchor.
Google has also said that around 15% of the searches it sees each day have never been searched before.
Google Still Holds Around 90% of Search
Despite years of predictions about AI replacing search, Google’s global market share sits at roughly 90% across all devices.
That is down slightly from its peak of nearly 93% in 2023, but it remains overwhelmingly dominant.
Zero Click Searches Keep Rising
A large share of Google searches now end without anyone clicking through to a website. Studies have put the zero click rate close to 60% of all queries.
This is partly by design. When you search Calculator, Weather, or Speed Test, Google answers directly on the results page. A huge portion of the top 100 list falls into exactly that category.
AI Overviews Are Changing Click Behavior
AI Overviews now appear on a meaningful share of results pages, mostly on informational queries, and their presence measurably reduces clicks to the pages listed beneath them.
The practical effect is that informational keywords are becoming less valuable per search than they used to be, while commercial and transactional keywords hold their value better.
Queries Are Getting Longer and More Conversational
Google reported that searches beginning with “tell me about” rose around 70% between 2024 and 2025. Searches starting with “how do I” hit an all-time high, up about 25% year over year.
People are typing full sentences instead of two-word fragments. That shift favors content that answers specific questions clearly over content built around short head terms.
How We Collected This Data
Transparency about sourcing matters, so here is exactly how these lists were put together.
Search volume figures for the top 100 US and global lists come from Semrush keyword data. The question data comes from a keyword database of 28.7 billion keywords.
Search volume is calculated as a rolling 12 month average of monthly searches. That method smooths out seasonal spikes, so a term like Halloween costume that gets most of its traffic in October shows a lower average than its peak month.
Search intent labels come from the same keyword tools and reflect the most likely reason behind each query. Some terms carry two intents where the data supports both.
Before publishing, the lists were cleaned in three ways. NSFW terms were removed, obvious misspellings were removed, and near duplicate variations were consolidated where they added nothing to the list.
Figures on Google’s total search volume, market share, and search behavior changes come from Google’s own public statements where available, and from named third party measurement where no official figure exists.
Search volumes are estimates, not exact counts. No tool has access to Google’s internal query logs, so treat every figure here as a close approximation rather than a precise number.
Source: Google.com, Ahrefs
Final Thoughts
The most searched things on Google are not what most people expect. They are not questions, products, or trending news stories. They are brand names people already know and small daily tasks people need done quickly.
That makes these lists fascinating as a picture of human behavior and almost useless as a keyword strategy. The traffic is real, but it belongs to the brands being searched for.
The more useful data sits further down. Questions, near me searches, and long tail variations are where real opportunity lives for everyone else.
We update this page as new search volume data becomes available.

