


Google gets 98.19 billion visits a month. There are about 8 billion people alive. That works out to more than twelve visits per person, every month, to one website.
That number tells you two things. Traffic on the modern web is concentrated in a very small number of places. And a “visit” is not a person, so any list like this needs to be read carefully.
This article ranks the most visited websites in the world using Semrush Traffic Analytics data from June 2026. It also breaks the rankings down by country, by category, and by engagement metrics like time on site.
Let’s quickly get into the details.
Most Visited Websites of 2026: Key Stats
Here are the numbers that stood out to me while pulling this data together.
- Google leads with 98.19 billion monthly visits, but it is not growing anymore. Traffic is down 2.95% month over month and up just 0.08% year over year.
- YouTube sits second at 52.22 billion visits. That is more than five times Facebook in third place.
- ChatGPT is the fastest riser in the top ten, up 49.19% year over year at 5.32 billion visits.
- Wikipedia and Facebook are both shrinking, down 15.89% and 8.56% year over year.
- Bing lost nearly half its traffic in a year, down 49.04%.
- Of the top 100 websites, 92 get most of their traffic from direct visits. Only 8 are led by search.
Top 20 Most Visited Websites in the World (2026)
Before the table, one point on what “visits” means. A visit is a single session on a site. If the same person opens Google eight times in a day, that counts as eight visits. This is why the totals run so far above global population. Unique visitor counts are much lower, and I cover those further down.
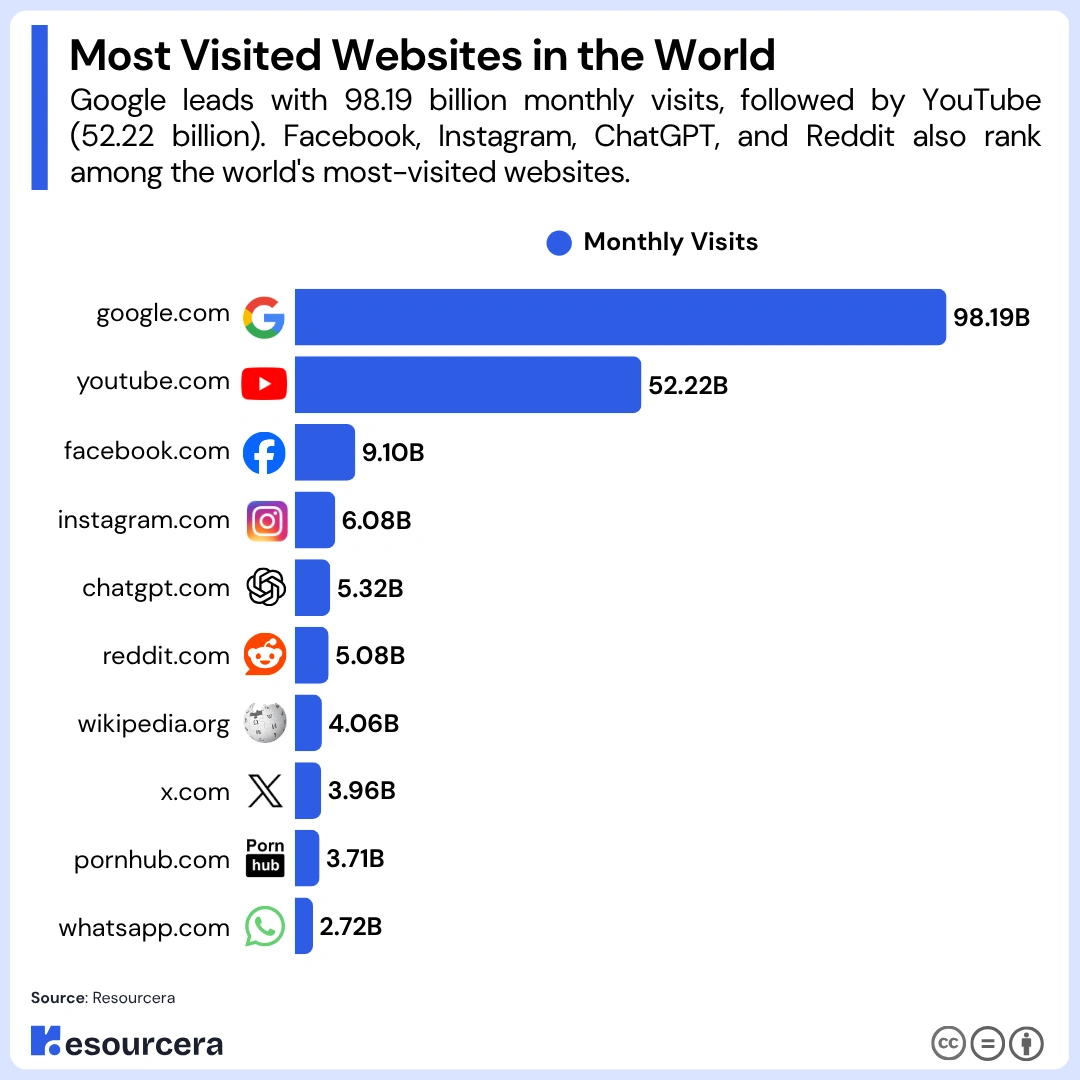
The table below is Semrush data for June 2026.
| Rank | Website | Monthly Visits | Category | Desktop / Mobile | YoY Change |
|---|---|---|---|---|---|
| 1 | google.com | 98.19B | Search | 28.8% / 71.2% | +0.08% |
| 2 | youtube.com | 52.22B | Video | 31.5% / 68.5% | +4.05% |
| 3 | facebook.com | 9.10B | Social | 49.5% / 50.6% | -8.56% |
| 4 | instagram.com | 6.08B | Social | 45.1% / 55.0% | +0.95% |
| 5 | chatgpt.com | 5.32B | AI tools | 77.5% / 22.5% | +49.19% |
| 6 | reddit.com | 5.08B | Social | 38.4% / 61.6% | +14.88% |
| 7 | wikipedia.org | 4.06B | Reference | 26.8% / 73.3% | -15.89% |
| 8 | x.com | 3.96B | Social | 42.5% / 57.5% | +3.20% |
| 9 | pornhub.com | 3.71B | Adult | 9.5% / 90.5% | -14.67% |
| 10 | whatsapp.com | 2.72B | Messaging | 86.0% / 14.0% | -7.96% |
| 11 | tiktok.com | 2.39B | Social | 39.0% / 61.0% | +4.28% |
| 12 | amazon.com | 2.33B | Ecommerce | 42.5% / 57.6% | -14.58% |
| 13 | xvideos.com | 2.31B | Adult | 9.5% / 90.6% | -12.54% |
| 14 | yahoo.com | 2.21B | News | 48.8% / 51.2% | -4.80% |
| 15 | duckduckgo.com | 2.07B | Search | 11.8% / 88.2% | -9.80% |
| 16 | bing.com | 1.86B | Search | 71.0% / 29.0% | -49.04% |
| 17 | yahoo.co.jp | 1.83B | News | 18.7% / 81.3% | -11.69% |
| 18 | weather.com | 1.65B | Weather | 3.7% / 96.3% | +1.38% |
| 19 | xhamster.com | 1.63B | Adult | 13.1% / 86.9% | +23.91% |
| 20 | linkedin.com | 1.48B | Social | 67.0% / 33.0% | -1.09% |
Six of the top twenty are social platforms. Four are search engines. Three are adult sites. The rest are spread across video, ecommerce, news, weather, AI, and messaging. Search engines and social platforms have held those slots for over a decade, and the only genuinely new entrant near the top is ChatGPT.
Semrush publishes the full top 100, but gates ranks 21 and beyond behind an account. The twenty above are what is publicly verifiable.
A Note on Adult Sites
I have left adult sites in the table. Most published lists quietly remove them, and I think that is worth flagging rather than copying.
Pornhub ranks 9th globally. Xvideos ranks 13th. Xhamster ranks 19th. Together they pull 7.65 billion monthly visits, which is more than Instagram and ChatGPT combined. If you drop three sites of that size without saying so, every rank below fifth place shifts, and readers comparing your list to Semrush or Similarweb will see numbers that do not match.
If you want a version of this ranking without adult sites, subtract those three rows and move everything below up three places.
Top 10 Most Visited Websites, Explained
Rankings on their own do not say much. What matters is the direction each site is moving and where its traffic comes from. Here is what the data shows for each of the top ten.
1. Google
| Metric | Value |
|---|---|
| Monthly visits | 98.19B |
| Category | Search |
| Desktop share | 28.8% |
| Mobile share | 71.2% |
| Month over month | -2.95% |
| Year over year | +0.08% |
| Main traffic source | Direct |
Google’s lead is not close. It has 46 billion more visits than YouTube, and YouTube is the second biggest site on the internet. Beyond search, the domain absorbs traffic from Maps, News, Images, and Scholar, which inflates the number relative to a pure search engine.
The interesting part is the trend. Google is down 2.95% month over month and up 0.08% year over year. After years of steady growth, it has flattened. Whether that is AI assistants absorbing simple queries or just market saturation is not something the traffic data alone can prove.
2. YouTube
| Metric | Value |
|---|---|
| Monthly visits | 52.22B |
| Category | Video |
| Desktop share | 31.5% |
| Mobile share | 68.5% |
| Month over month | -1.68% |
| Year over year | +4.05% |
| Main traffic source | Direct |
YouTube is one of the few websites in the top ten that is still growing at a steady rate. It also keeps users engaged for a long time, with an average visit lasting just over 24 minutes, according to Statista.
This is unusual for a website with billions of monthly visits. Most large websites have shorter sessions because users visit for one task and leave. On YouTube, people often watch several videos, browse recommendations, view Shorts, and read comments in a single visit.
Our detailed YouTube statistics report covers more data on its users, watch time, subscribers, and growth.
3. Facebook
| Metric | Value |
|---|---|
| Monthly visits | 9.10B |
| Category | Social |
| Desktop share | 49.5% |
| Mobile share | 50.6% |
| Month over month | -3.56% |
| Year over year | -8.56% |
| Main traffic source | Direct |
The gap between YouTube and Facebook is the largest in the entire ranking, with YouTube receiving around 43 billion more monthly visits.
Facebook’s traffic is also declining, falling 8.56% year over year and 3.56% month over month. Its traffic is almost evenly split between desktop and mobile users, at 49.5% and 50.6%, respectively. This is the most balanced device split among the top five websites and may reflect Facebook’s broader and older user base compared with platforms such as Instagram and TikTok. You can find more details about its users, growth, and revenue in our Facebook Stats.
4. Instagram
| Metric | Value |
|---|---|
| Monthly visits | 6.08B |
| Category | Social |
| Desktop share | 45.1% |
| Mobile share | 55.0% |
| Month over month | -1.99% |
| Year over year | +0.95% |
| Main traffic source | Direct |
Instagram’s traffic remained almost flat, growing by less than 1% over the year. However, Instagram continues to stand out for user engagement. According to Similarweb, visitors view an average of 12.91 pages per session, one of the highest rates among major websites.
This strong engagement reflects how users move between Reels, Stories, posts, and profiles during a single visit. Our detailed [Instagram statistics] article covers more data on its users, reach, and engagement.
5. ChatGPT
| Metric | Value |
|---|---|
| Monthly visits | 5.32B |
| Category | AI tools |
| Desktop share | 77.5% |
| Mobile share | 22.5% |
| Month over month | -5.53% |
| Year over year | +49.19% |
| Main traffic source | Direct |
This is the outlier in the list. ChatGPT grew 49.19% year over year while most of the sites around it shrank.
It is also 77.5% desktop, which almost nothing else at this scale is. Weather.com is 96% mobile. Pornhub is 90% mobile. ChatGPT looks more like a work tool than a consumer app, and that shapes when and how people use it.
6. Reddit
| Metric | Value |
|---|---|
| Monthly visits | 5.08B |
| Category | Social |
| Desktop share | 38.4% |
| Mobile share | 61.6% |
| Month over month | -6.05% |
| Year over year | +14.88% |
| Main traffic source | Search |
Reddit is one of only two sites in the top ten where search is the main traffic source. It grew 14.88% year over year, which is strong for a platform this size.
A large part of that comes from Google surfacing forum results more prominently for questions where people want a human answer rather than a published article.
7. Wikipedia
| Metric | Value |
|---|---|
| Monthly visits | 4.06B |
| Category | Reference |
| Desktop share | 26.8% |
| Mobile share | 73.3% |
| Month over month | -3.03% |
| Year over year | -15.89% |
| Main traffic source | Search |
Wikipedia lost 15.89% of its traffic in a year. It is also search led, which means it depends on people clicking through from Google.
The likely explanation is that AI answers and Google’s own result panels now handle the quick factual lookups that used to send people to Wikipedia. I cannot prove causation from traffic data alone, but the timing lines up with ChatGPT’s growth.
8. X
| Metric | Value |
|---|---|
| Monthly visits | 3.96B |
| Category | Social |
| Desktop share | 42.5% |
| Mobile share | 57.5% |
| Month over month | +1.34% |
| Year over year | +3.20% |
| Main traffic source | Direct |
X grew 3.2% for the year. It has the highest pages per visit of the major social platforms at 13.14, which reflects how much scrolling a single session involves.
One caveat worth knowing. Statista’s unique visitor data still counts x.com and twitter.com separately, at 840 million and 820 million. Any list built from that source may be splitting one audience across two rows.
9. Pornhub
| Metric | Value |
|---|---|
| Monthly visits | 3.71B |
| Category | Adult |
| Desktop share | 9.5% |
| Mobile share | 90.5% |
| Month over month | -0.33% |
| Year over year | -14.67% |
| Main traffic source | Direct |
The most mobile-heavy large site in the ranking. Traffic is down 14.67% year over year, likely tied to age verification laws rolling out across several markets.
10. WhatsApp
| Metric | Value |
|---|---|
| Monthly visits | 2.72B |
| Category | Messaging |
| Desktop share | 86.0% |
| Mobile share | 14.0% |
| Month over month | -2.26% |
| Year over year | -7.96% |
| Main traffic source | Direct |
The 86% desktop share looks wrong until you realize what is being measured. Almost all WhatsApp use happens in the mobile app, which does not register as web traffic. What Semrush counts is whatsapp.com, and that is mostly WhatsApp Web on desktop.
WhatsApp also has the longest average session of any site tracked by Statista at 31 minutes and 17 seconds, because people leave the web client open while they work.
Most Visited Websites by Country
Global rankings are useful for context, but they are close to useless for planning. If you are building a site for one market, what matters is what people in that market actually open.
I pulled Semrush data for four major markets, all from May 2026. Note that these are one month behind the global table above, so small differences in Google’s total are expected.
United States
The US ranking is notable for how high Reddit sits. It is third, ahead of Facebook, which does not happen in any other market I checked.
| Rank | Website | Monthly Visits | Category |
|---|---|---|---|
| 1 | google.com | 24.33B | Search |
| 2 | youtube.com | 9.51B | Video |
| 3 | reddit.com | 2.46B | Social |
| 4 | facebook.com | 2.11B | Social |
| 5 | amazon.com | 1.88B | Ecommerce |
| 6 | yahoo.com | 1.11B | News |
| 7 | instagram.com | 1.10B | Social |
| 8 | wikipedia.org | 1.07B | Reference |
| 9 | chatgpt.com | 1.05B | AI tools |
| 10 | x.com | 857.41M | Social |
Traffic here is heavily concentrated. Semrush reports that the top ten sites account for 68.4% of all visits across the top 150, and the top three alone take 54.6%. Everything below tenth place is competing for a third of the market.
ChatGPT grew 60.96% year over year in the US, faster than its global rate. Bing fell 50.8% over the same period.
India
India is the only market in this set where ChatGPT ranks above Facebook. It sits fourth, and Facebook has dropped to fifth after losing 34.63% of its traffic in a year.
| Rank | Website | Monthly Visits | Category |
|---|---|---|---|
| 1 | google.com | 5.49B | Search |
| 2 | youtube.com | 3.15B | Video |
| 3 | instagram.com | 717.57M | Social |
| 4 | chatgpt.com | 481.88M | AI tools |
| 5 | facebook.com | 415.78M | Social |
| 6 | whatsapp.com | 340.42M | Messaging |
| 7 | amazon.in | 249.17M | Ecommerce |
| 8 | xhamster.com | 225.13M | Adult |
| 9 | reddit.com | 184.46M | Social |
| 10 | bing.com | 177.20M | Search |
Amazon uses its local domain here rather than amazon.com, which is the pattern across most non-US markets. Indiatimes and NDTV both appear just outside the top ten, which shows local news still holds real share against global platforms.
Google’s traffic in India is down 4.68% year over year, one of the few markets where it is losing ground.
United Kingdom
The UK is the clearest example of a domestic publisher holding its own. BBC ranks third, ahead of Facebook and Amazon.
| Rank | Website | Monthly Visits | Category |
|---|---|---|---|
| 1 | google.com | 2.79B | Search |
| 2 | youtube.com | 1.15B | Video |
| 3 | bbc.co.uk | 318.01M | News |
| 4 | facebook.com | 251.09M | Social |
| 5 | amazon.co.uk | 221.23M | Ecommerce |
| 6 | reddit.com | 187.39M | Social |
| 7 | chatgpt.com | 173.65M | AI tools |
| 8 | wikipedia.org | 155.83M | Reference |
| 9 | instagram.com | 125.43M | Social |
| 10 | x.com | 109.79M | Social |
Gov.uk also ranks 15th at 77.5 million visits and is one of the few sites in the country growing, up 10.42% year over year. Almost everything else in the UK top twenty is down.
ChatGPT grew 65.27% here, the fastest of the four markets I looked at.
Germany
Germany shows the strongest preference for local domains anywhere in this data. Amazon.de ranks third, and Google.de, Kleinanzeigen, Bild, T-Online, and DHL all appear in the top twenty.
| Rank | Website | Monthly Visits | Category |
|---|---|---|---|
| 1 | google.com | 3.47B | Search |
| 2 | youtube.com | 1.83B | Video |
| 3 | amazon.de | 299.08M | Ecommerce |
| 4 | facebook.com | 231.89M | Social |
| 5 | wikipedia.org | 228.74M | Reference |
| 6 | chatgpt.com | 210.65M | AI tools |
| 7 | instagram.com | 205.36M | Social |
| 8 | reddit.com | 193.35M | Social |
| 9 | duckduckgo.com | 137.54M | Search |
| 10 | weather.com | 119.16M | Weather |
DuckDuckGo in ninth is worth noting. It ranks higher in Germany than in any other market here, which fits the country’s stronger privacy norms.
Twitch also ranks 14th at 104.51 million visits, well above where it lands elsewhere.
Most Visited Websites by Category
Traffic rankings flatten very different kinds of sites into one list. Splitting by category shows which platform actually owns each part of the web.
The table below draws on Similarweb category data alongside the Semrush figures above.
| Category | Leader | Monthly Visits | Others in Top Ranks |
|---|---|---|---|
| Search | google.com | 98.19B | bing.com, duckduckgo.com, yandex.ru, baidu.com |
| Video and streaming | youtube.com | 52.22B | netflix.com, bilibili.com |
| Social media | facebook.com | 9.10B | instagram.com, x.com, reddit.com, tiktok.com |
| AI tools | chatgpt.com | 5.32B | Leads its category outright |
| Reference | wikipedia.org | 4.06B | quora.com, fandom.com |
| Adult | pornhub.com | 3.71B | xvideos.com, xhamster.com |
| Messaging | whatsapp.com | 2.72B | t.me |
| Ecommerce | amazon.com | 2.33B | temu.com, ebay.com |
| News | yahoo.co.jp | 1.83B | yahoo.com, msn.com, bbc.co.uk |
| Weather | weather.com | 1.65B | Leads its category outright |
| Design | canva.com | Not disclosed | Leads its category outright |
| Travel | booking.com | Not disclosed | Leads its category outright |
The category leaders are stable in most segments. Search, video, social, ecommerce, and reference have had the same top site for over a decade. AI tools is the one category that did not exist in this form three years ago.
Engagement Metrics Beyond Visits
Visit counts reward sites people open often. They say nothing about whether anyone stays. Two other metrics fill that gap.
Longest Average Session
Session length shows how long a single visit lasts. Long sessions usually mean a site people settle into. Short sessions usually mean a tool people use and close.
| Rank | Website | Average Session |
|---|---|---|
| 1 | whatsapp.com | 31m 17s |
| 2 | youtube.com | 24m 15s |
| 3 | msn.com | 18m 09s |
| 4 | x.com | 15m 26s |
| 5 | facebook.com | 14m 55s |
| 6 | netflix.com | 13m 43s |
| 7 | instagram.com | 13m 28s |
| 8 | google.com | 12m 53s |
| 9 | xvideos.com | 12m 35s |
| 10 | reddit.com | 12m 27s |
WhatsApp leads because people leave the web client open, not because they are reading it for half an hour. Google’s 12 minutes is similarly inflated by tabs left running.
Unique Visitors
Unique visitors count people rather than sessions. The gap between the two numbers tells you how often the average person returns.
Google records 6.25 billion unique visitors against 98.19 billion visits, which is roughly sixteen visits per person per month. Wikipedia records 1.54 billion unique visitors against 4.06 billion visits, which is under three. People go to Google constantly and to Wikipedia occasionally, even though both sit in the same top ten.
Statista’s unique visitor figures are from August 2025 and use a different provider, so they are not directly comparable to the Semrush visit counts above. Use them for the ratio, not for the absolute number.
What the Rankings Say About Where Traffic Is Going
Three patterns run through this data, and all three matter if you run a website.
AI Is Absorbing Reference Traffic
ChatGPT grew 49.19% globally. Wikipedia fell 15.89%. Bing fell 49.04%. Those three numbers cover the same twelve months.
The pattern fits a simple story. Quick factual questions that used to end in a Wikipedia click or a search now end in a chat window. I want to be careful here, because traffic data shows correlation and not cause, and Bing’s fall in particular may have other explanations. But the direction is consistent across every market I checked.
Direct Traffic Owns the Top of the List
Of the top 100 websites globally, 92 get most of their traffic directly. Only 8 are search led. In the top ten, only Reddit and Wikipedia depend on search.
This is worth sitting with. The largest sites on the internet do not rely on Google to reach their audience. People type the address or open the app. Search dependence is a feature of mid-sized sites, not large ones, and it is the more fragile position of the two.
Mobile and Desktop Split by Purpose, Not by Size
The device split varies more than anything else in this data, and it tracks what a site is for.
| Website | Desktop Share | What That Reflects |
|---|---|---|
| weather.com | 3.7% | Checked on a phone, in seconds |
| pornhub.com | 9.5% | Private, mobile-first use |
| wikipedia.org | 26.8% | Quick lookups on the go |
| google.com | 28.8% | Search happens everywhere |
| bing.com | 71.0% | Default browser on work machines |
| chatgpt.com | 77.5% | Used for work tasks at a desk |
| whatsapp.com | 86.0% | Web client only, app not counted |
If your audience matches one of these use cases, you can reasonably expect a similar split.
Related Read: 100 Most Asked Questions On Google
Wrap Up: What This Means for Your Website
A few practical takeaways from the numbers above.
Pick platforms by market, not by global rank. Facebook is fourth in the US and fifth in India, but BBC beats both in the UK. If you publish for one country, the local ranking is the only one that matters.
Local domains and local publishers still win. Amazon.de outranks Amazon.com in Germany. BBC outranks Facebook in the UK. Indiatimes and NDTV hold top-twenty spots in India. Being local is still an advantage in most markets.
Direct traffic is the durable position. The sites at the very top do not depend on search referrals. Building an audience that comes to you directly, through email, an app, or habit, is slower than SEO but far more stable.
Search referral is thinning at the top of the web. Wikipedia lost 15.89% while being search-led. That is a warning sign for anyone whose entire traffic model runs through Google.
Frequently Asked Questions
What is the most visited website in the world?
Is YouTube bigger than Google?
Why do different sources give different numbers for the same site?
What is the most visited social media site?
Which website has the longest average visit?
What is the fastest growing major website?
Methodology and Sources
Primary traffic data comes from Semrush Traffic Analytics. The global ranking uses June 2026 data. The four country rankings use May 2026 data, which is what Semrush had published at the time of writing. Semrush builds these figures from clickstream data covering roughly 200 million anonymized users, combined with its own modeling.
Session length and unique visitor figures come from Statista, using August 2025 data sourced from DataReportal. Pages per visit and category leadership come from Similarweb. These are different providers measuring different things over different periods, so I have not mixed them within a single table.
The distinction between visits and unique visitors matters throughout. A visit is one session. A unique visitor is one person, who may account for many sessions. Any headline number in the billions is a visit count, not a headcount.
Adult sites are included in the global ranking because they appear in the underlying data at ranks 9, 13, and 19. Removing them without saying so would shift every rank below fifth place.
Semrush publishes the top 100 for each market but restricts ranks beyond 20 to account holders. The tables here cover what is publicly verifiable.

